Sargent Beach Lessons Learned: Difference between revisions
No edit summary |
No edit summary |
||
| Line 78: | Line 78: | ||
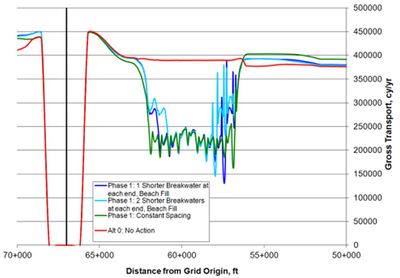
[[Image:Fig10_SB_transport_detail.jpg|400px|thumb|left|Figure 10. Average gross transport for 5 year simulation with varying breakwater lengths with increased detail]] | [[Image:Fig10_SB_transport_detail.jpg|400px|thumb|left|Figure 10. Average gross transport for 5 year simulation with varying breakwater lengths with increased detail]] | ||
<br style="clear:both" / | <br style="clear:both" /> | ||
== Lessons Learned == | |||
Several lessons were learned during the GenCade portion of the Sargent Beach and Matagorda Peninsula study. Two of these lessons were fairly basic while the third refers to an approach for cases that do not meet all of the basic assumptions of GenCade. | |||
=== Extent of GenCade Grid === | |||
Before any of the alternatives could be modeled, GenCade was calibrated and validated. This original grid extended from the San Bernard River to the Matagorda Ship Channel and contain a total of 655 grid cells with variable size from 130 to 490 ft with the smaller cells near the structures and inlets. The total length of the grid was 54.75 miles. It was expected that this grid would be considered a "master grid" for the alternatives. The structures for each alternative would be added and the cell spacing would be adjusted accordingly. | |||
In Phase 1 of the study, several structural and non-structural alternatives were modeled at Sargent Beach (groins, breakwaters, beach fills). Breakwaters are one of the most complex calculations in GenCade, and grids with breakwaters take much longer to simulate than grids with any other feature. The large grid with the breakwaters took too long to simulate. In order to meet the deadline for the first phase of the project, the grid was shortened. | |||
After the first phase of the study was completed, the sponsor refined the goals at Sargent Beach and decided that different breakwater alternatives would be investigated further. While shortening the grids reduces simulation run time, it was necessary to determine how shortening the grid affects the results. | |||
=== Multiple Breakwaters in GenCade === | |||
=== Adaptive Approach === | |||
Revision as of 20:30, 1 August 2013
Introduction and Study Overview
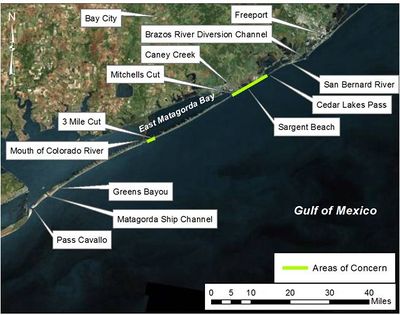
The Port of Bay City, Texas, asked the U.S. Army Corps of Engineers to develop potential structural solutions to reduce erosion of critical beach baitat and to increase protection from tropical storms in Matagorda County. The two primary areas of concern are Sargent Beach and a 2-3 mile stretch of beach on Matagorda Peninsula located about a mile east of the Mouth of the Colorado River (MCR). This two-part study investigated the coastal processes of the region and introducted several structural alternatives to reduce erosion. Phase 1 of the study investigated the coastal processes and determined which structural solutions would be evaluated further in Phase 2. Figure 1 shows a map of the project area and region.
This study was presented in a series of technical reports. Phase 1 was published in 2012 while the Phase 2 report is available as a draft. Since this was a very in-depth study and included analysis with several models, the details of the study will not be presented here. Instead, basic details of the GenCade analysis will be shown. In addition, this study allowed the GenCade team learn several lessons related to the model and improve GenCade for future studies. These lessons are presented here to provide additional information for GenCade users.
Matagorda Peninsula
The orginal objectives at Matagorda Peninsula were to reduce erosion and increase beach width over a defined target area. Following a presentation of the Phase 1 results to the sponsor, the final project goals were refined as listed below.
- Establish a groin field to stabilize the beach from the north access road to 3 Mile Cut.
- Increase the dry beach width by 200 ft over this area.
- Ensure no impact to shoreline change at 3 Mile Cut.
- Exclude bypassing plants at MCR. Natural bypassing and dredging at MCR and placement near the west beach migth occur (various levels of federal funded bypassing are considered in the shoreline modeling, although no additional non-federal bypassing was recommended or tested.)
Several alternatives were modeled in addition to the existing condition. Many of the initial groin configurations resulted in accretion near 3 Mile Cut, which was undesirable because it could change the way the ephemeral inlet has functioned. Therefore, each of the alternatives was rerun with the groin field shifted 1,640 ft to the southwest. The best performing alternative was Alternative 5-Shifted. The alternatives considered are shown below.
- Alternative 0 - No action, no groins constructed
- Alternative 1 - Seven groins, 400 ft long, 800 ft apart (last three groins shorter and closer together); first groin approximately 2,500 ft southwest of 3 Mile Cut
- Alternative 1 - Shifted - Same as Alternative 1, groins shifted 1,640 ft to southwest
- Alternative 2 - Five groins, 400 ft long, 1,200 ft apart (last two shorter and closer together); first groin 2,500 ft southwest of 3 Mile Cut
- Alternative 2 - Shifted - Same as Alternative 2, groins shifted 1,640 ft to southwest
- Alternative 3 - Five groins, 600 ft long, 1,200 ft apart (last two are shorter and closer together); first groin 2,500 ft southwest of 3 Mile Cut
- Alternative 3 - Shifted - Same as Alternative 3, groins shifted 1,640 ft to southwest
- Alternative 4 - Five groins, 600 ft long, 1,800 ft apart (last two shorter and closer together); first groin 2,500 ft southwest of 3 Mile Cut
- Alternative 4 - Shifted - Same as Alternative 4, groins shifted 1,640 ft to southwest
- Alternative 5 - Three groins, 800 ft long, 1,600 ft apart
- Alternative 5 - Shifted - Same as Alternative 5, groins shifted 1,640 ft to southwest
To find out more about the alternatives that were not selected, please refer to the Phase 2 report. Only Alternative 5 - Shifted and non-structural solutions will be discussed here.
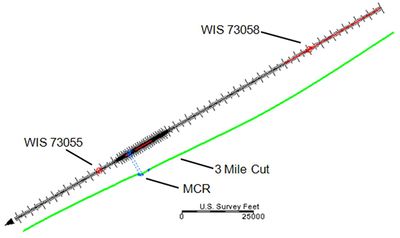
The model domain was 28 miles long, extending about 3.3 miles southwest of Mitchell's Cut to about 8.7 miles southwest of MCR (Figure 2). The model was run for 5 and 16 years.
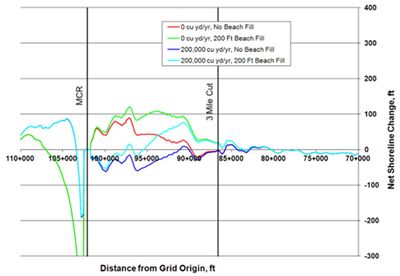
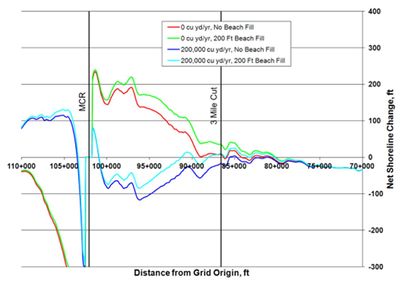
The baseline is to take no action. There are also three variations without structures that were simulated. The four cases are no action (no beach fill, no mechanical bypassing), a 200-ft wide beach fill without mechanical bypassing, 200,000 cu yd/yr of mechanical bypassing without a beach fill, and a 200-ft wide beach fill with 200,000 cu yd/yr of mechancial bypassing. Figure 3 compares shoreline change of the four variations of non-structural alternatives after 5 years while Figure 4 shows the variations after 16 years.
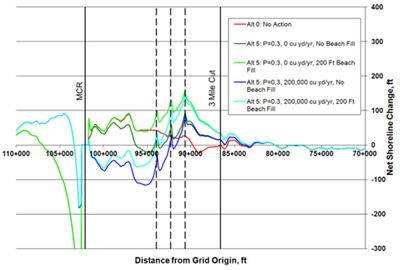
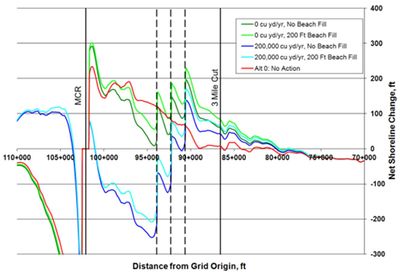
The same variations of beach fills and mechanical bypassing were included in the Alternative 5 - Shifted setup. The shoreline change results of those four variations of Alterantive 5 - Shifted are compared with the no action baseline case after 5 and 16 years (Figures 5 and 6). Regardless of the amount of bypasing and the construction of a beach fill, the shoreline will advance updrift and erode downdrift of the groin field. None of the alternatives resulted in the suggested 200 ft of shoreline advance across the range of the project, even when a beach fill was added. Of all of the modeled alternatives, Alternative 5 - Shifted provided shoreline advance most similar to the recommended project requirements. The wide range of results between the bypassing and no bypassing variations illustrates the need for monitoring at MCR.
Sargent Beach
The initial goal at Sargent Beach was to stop erosion over the target area. Phase 1 modeling results indicated that a breakwater field would best meet this goal. Following the completion of Phase 1, a meeting was held with the sponsor and the following final project goals were specified.
- Segmented breakwaters will be analyzed for shore protection at Sargent.
- The final alternatives might include a terminal groin.
- Beach fill can be included if necessary.
- An adaptive and scalable plan will be developed. The plan will ensure that the project functions as intended with minimal downdrift impacts. The plan will include multiple layouts to accommodate incremental funding.
- The first phase of the adaptive plan should consist of approximately 10 breakwater segments starting near Mitchell’s Cut, moving northward/eastward.
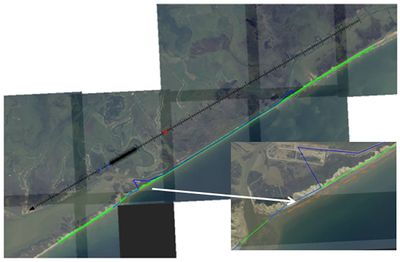
The GenCade grid extends from about 5.1 miles southwest of the Brazos River to about 3.6 miles southwest of Mitchell’s Cut for a total of 16 miles. The cells range in size from 33 to 490 ft. The smallest cells were necessary to provide detail in the breakwater regions and to meet GenCade model guidance recommendations regarding number of cells representing a breakwater. It is recommended that the breakwaters be placed at a distance of 350 ft offshore. The breakwaters were 220 ft long and the gap size was 330 ft. The GenCade setup is shown in Figure 7. The lengths of the first and last breakwaters and the gap sizes were adjusted in some of the alternatives. Additionally, several phases of construction were considered. This is because it is unlikely that there would be enough funding to construct breakwaters in front of the entire revetment at Sargent Beach. This wiki page only describes the first alternative, 10 breakwaters, but the other alternatives are included in the appendix of the Phase 2 report.
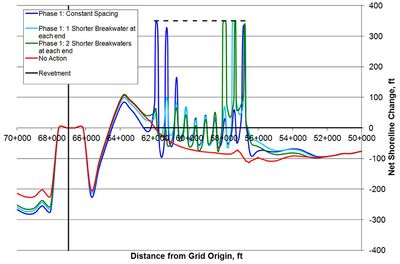
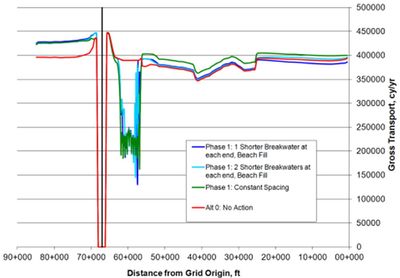
A baseline case with No Action was simulated to compare to the first phase of breakwaters after 5 years. This baseline case included Mitchell’s Cut but did not include any structural alternatives. The ten breakwaters were modeled just north of Mitchell’s Cut to represent the Phase 1 demonstration project. For the initial case, all of the breakwaters are the same length and same distance apart. Figure 8 compares the No Action alternative to the different variations of Phase 1 breakwaters for shoreline change while Figure 9 compares the average gross transport. The “Constant Spacing” in both figures refers to the simulation where the breakwaters were 220 ft long and all gaps sizes were 330 ft. The “Phase 1: 1 Shorter Breakwater at each end” represents the case where the first and last breakwaters were shortened to 98 ft and the gap sizes between those breakwaters were 460 ft. The “Phase 1: 2 Shorter Breakwaters at each end” represents the case where the first, second, ninth, and tenth breakwaters were all shortened to 98 ft while the gaps between the first and second, second and third, eighth and ninth, and ninth and tenth breakwaters were 460 ft. Regardless of the spacing between the breakwaters at the ends, they reduce the erosion in the area of interest. The gross transport in the vicinity of the breakwaters is reduced by about 45%. All breakwater cases include a 36,000 cu yd/yr mitigation beach fill directly to the south of Mitchell’s Cut.
Lessons Learned
Several lessons were learned during the GenCade portion of the Sargent Beach and Matagorda Peninsula study. Two of these lessons were fairly basic while the third refers to an approach for cases that do not meet all of the basic assumptions of GenCade.
Extent of GenCade Grid
Before any of the alternatives could be modeled, GenCade was calibrated and validated. This original grid extended from the San Bernard River to the Matagorda Ship Channel and contain a total of 655 grid cells with variable size from 130 to 490 ft with the smaller cells near the structures and inlets. The total length of the grid was 54.75 miles. It was expected that this grid would be considered a "master grid" for the alternatives. The structures for each alternative would be added and the cell spacing would be adjusted accordingly.
In Phase 1 of the study, several structural and non-structural alternatives were modeled at Sargent Beach (groins, breakwaters, beach fills). Breakwaters are one of the most complex calculations in GenCade, and grids with breakwaters take much longer to simulate than grids with any other feature. The large grid with the breakwaters took too long to simulate. In order to meet the deadline for the first phase of the project, the grid was shortened.
After the first phase of the study was completed, the sponsor refined the goals at Sargent Beach and decided that different breakwater alternatives would be investigated further. While shortening the grids reduces simulation run time, it was necessary to determine how shortening the grid affects the results.
