Sargent Beach Lessons Learned: Difference between revisions
No edit summary |
|||
| (16 intermediate revisions by the same user not shown) | |||
| Line 1: | Line 1: | ||
== Introduction and Study Overview == | == Introduction and Study Overview == | ||
The Port of Bay City, Texas, asked the U.S. Army Corps of Engineers to develop potential structural solutions to reduce erosion of critical beach habitat and to increase protection from tropical storms in Matagorda County. The two primary areas of concern are Sargent Beach and a 2-3 mile stretch of beach on Matagorda Peninsula located about a mile east of the Mouth of the Colorado River (MCR). This two-part study investigated the coastal processes of the region and introduced several structural alternatives to reduce erosion. Phase 1 of the study investigated the coastal processes and determined which structural solutions would be evaluated further in Phase 2. Figure 1 shows a map of the project area and region. | The Port of Bay City, Texas, asked the U.S. Army Corps of Engineers to develop potential structural solutions to reduce erosion of critical beach habitat and to increase protection from tropical storms in Matagorda County. The two primary areas of concern are Sargent Beach and a 2-3 mile stretch of beach on Matagorda Peninsula located about a mile east of the Mouth of the Colorado River (MCR). This two-part study investigated the coastal processes of the region and introduced several structural alternatives to reduce erosion. Phase 1 of the study investigated the coastal processes and determined which structural solutions would be evaluated further in Phase 2. Phase 2 described the detailed alternatives and introduced preliminary design. Figure 1 shows a map of the project area and region. | ||
[[Image:Fig1_studyarea_Matagorda.jpg|400px|thumb|left|Figure 1. Map of Matagorda Peninsula and Sargent Beach]] | [[Image:Fig1_studyarea_Matagorda.jpg|400px|thumb|left|Figure 1. Map of Matagorda Peninsula and Sargent Beach]] | ||
| Line 7: | Line 7: | ||
This study was presented in a series of technical reports. [http://cirp.usace.army.mil/Downloads/PDF/CHL-TR-12-11.pdf Phase 1] was published in 2012 while the [http:// | This study was presented in a series of technical reports. [http://cirp.usace.army.mil/Downloads/PDF/CHL-TR-12-11.pdf Phase 1] was published in 2012 while the [http://acwc.sdp.sirsi.net/client/search/asset/1028561 Phase 2] report was published in 2013. Since this was a very in-depth study and included analysis with several models, the details of the study will not be presented here. Instead, basic details of the GenCade analysis will be shown. In addition, this study allowed the GenCade team learned several lessons related to the model and improve GenCade for future studies. These lessons are presented here to provide additional information for GenCade users. | ||
== Matagorda Peninsula == | == Matagorda Peninsula == | ||
| Line 15: | Line 15: | ||
* Increase the dry beach width by 200 ft over this area. | * Increase the dry beach width by 200 ft over this area. | ||
* Ensure no impact to shoreline change at 3 Mile Cut. | * Ensure no impact to shoreline change at 3 Mile Cut. | ||
* Exclude bypassing plants at MCR. Natural bypassing and dredging at MCR and placement near the west beach might occur (various levels of federal funded bypassing are considered in the shoreline modeling, although no additional non-federal bypassing was recommended or tested. | * Exclude bypassing plants at MCR. Natural bypassing and dredging at MCR and placement near the west beach might occur (various levels of federal funded bypassing are considered in the shoreline modeling, although no additional non-federal bypassing was recommended or tested). | ||
Several alternatives were modeled in addition to the existing condition. Many of the initial groin configurations resulted in accretion near 3 Mile Cut, which was undesirable because it could change the way the ephemeral inlet has functioned. Therefore, each of the alternatives was rerun with the groin field shifted 1,640 ft to the southwest. The best performing alternative was Alternative 5-Shifted. The alternatives considered are shown below. | Several alternatives were modeled in addition to the existing condition. Many of the initial groin configurations resulted in accretion near 3 Mile Cut, which was undesirable because it could change the way the ephemeral inlet has functioned. Therefore, each of the alternatives was rerun with the groin field shifted 1,640 ft to the southwest. The best performing alternative was Alternative 5-Shifted. The alternatives considered are shown below. | ||
| Line 31: | Line 31: | ||
* Alternative 5 - Shifted - Same as Alternative 5, groins shifted 1,640 ft to southwest | * Alternative 5 - Shifted - Same as Alternative 5, groins shifted 1,640 ft to southwest | ||
To find out more about the alternatives that were not selected, please refer to the [http:// | To find out more about the alternatives that were not selected, please refer to the [http://acwc.sdp.sirsi.net/client/search/asset/1028561 Phase 2 report]. Only Alternative 5 - Shifted and non-structural solutions will be discussed here. | ||
The model domain was 28 miles long, extending about 3.3 miles southwest of Mitchell's Cut to about 8.7 miles southwest of MCR (Figure 2). The model was run for 5 and 16 years. | The model domain was 28 miles long, extending about 3.3 miles southwest of Mitchell's Cut to about 8.7 miles southwest of MCR (Figure 2). The model was run for 5 and 16 years. | ||
| Line 65: | Line 65: | ||
* The first phase of the adaptive plan should consist of approximately 10 breakwater segments starting near Mitchell’s Cut, moving northward/eastward. | * The first phase of the adaptive plan should consist of approximately 10 breakwater segments starting near Mitchell’s Cut, moving northward/eastward. | ||
The GenCade grid extends from about 5.1 miles southwest of the Brazos River to about 3.6 miles southwest of Mitchell’s Cut for a total of 16 miles. The cells range in size from 33 to 490 ft. The smallest cells were necessary to provide detail in the breakwater regions and to meet GenCade model guidance recommendations regarding number of cells representing a breakwater. It | The GenCade grid extends from about 5.1 miles southwest of the Brazos River to about 3.6 miles southwest of Mitchell’s Cut for a total of 16 miles. The cells range in size from 33 to 490 ft. The smallest cells were necessary to provide detail in the breakwater regions and to meet GenCade model guidance recommendations regarding number of cells representing a breakwater. It was recommended that the breakwaters be placed at a distance of 350 ft offshore. The breakwaters were 220 ft long and the gap size was 330 ft. The GenCade setup is shown in Figure 7. The lengths of the first and last breakwaters and the gap sizes were adjusted in some of the alternatives. Additionally, several phases of construction were considered. This is because it is unlikely that there would be enough funding to construct breakwaters in front of the entire revetment at Sargent Beach. This wiki page only describes the first alternative, 10 breakwaters, but the other alternatives are included in the appendix of the Phase 2 report. | ||
[[Image:Fig7_SB_setup.jpg|400px|thumb|left|Figure 7. GenCade setup for 10 breakwaters]] | [[Image:Fig7_SB_setup.jpg|400px|thumb|left|Figure 7. GenCade setup for 10 breakwaters]] | ||
<br style="clear:both" /> | <br style="clear:both" /> | ||
A baseline case with No Action was simulated to compare to the first phase of breakwaters after 5 years. This baseline case included Mitchell’s Cut but did not include any structural alternatives. The ten breakwaters were modeled just north of Mitchell’s Cut to represent the Phase 1 demonstration project. For the initial case, all of the breakwaters are the same length and same distance apart. Figure 8 compares the No Action alternative to the different variations of Phase 1 breakwaters for shoreline change while | A baseline case with No Action was simulated to compare to the first phase of breakwaters after 5 years. This baseline case included Mitchell’s Cut but did not include any structural alternatives. The ten breakwaters were modeled just north of Mitchell’s Cut to represent the Phase 1 demonstration project. For the initial case, all of the breakwaters are the same length and same distance apart. Figure 8 compares the No Action alternative to the different variations of Phase 1 breakwaters for shoreline change while Figures 9 and 10 compare the average gross transport. The “Constant Spacing” in both figures refers to the simulation where the breakwaters were 220 ft long and all gaps sizes were 330 ft. The “Phase 1: 1 Shorter Breakwater at each end” represents the case where the first and last breakwaters were shortened to 98 ft and the gap sizes between those breakwaters were 460 ft. The “Phase 1: 2 Shorter Breakwaters at each end” represents the case where the first, second, ninth, and tenth breakwaters were all shortened to 98 ft while the gaps between the first and second, second and third, eighth and ninth, and ninth and tenth breakwaters were 460 ft. Regardless of the spacing between the breakwaters at the ends, they reduce the erosion in the area of interest. The gross transport in the vicinity of the breakwaters is reduced by about 45%. All breakwater cases include a 36,000 cu yd/yr mitigation beach fill directly to the south of Mitchell’s Cut. | ||
[[Image:Fig8_SB_shorelinechange.jpg|400px|thumb|left|Figure 8. Shoreline change after 5 years for Phase 1 breakwaters at 350 ft offshore with varying breakwater lengths]] | [[Image:Fig8_SB_shorelinechange.jpg|400px|thumb|left|Figure 8. Shoreline change after 5 years for Phase 1 breakwaters at 350 ft offshore with varying breakwater lengths]] | ||
| Line 87: | Line 87: | ||
Before any of the alternatives could be modeled, GenCade was calibrated and validated. This original grid extended from the San Bernard River to the Matagorda Ship Channel and contained a total of 655 grid cells with variable size from 130 to 490 ft with the smaller cells near the structures and inlets. The total length of the grid was 54.75 miles. It was expected that this grid would be considered a "master grid" for the alternatives. The structures for each alternative would be added and the cell spacing would be adjusted accordingly. | Before any of the alternatives could be modeled, GenCade was calibrated and validated. This original grid extended from the San Bernard River to the Matagorda Ship Channel and contained a total of 655 grid cells with variable size from 130 to 490 ft with the smaller cells near the structures and inlets. The total length of the grid was 54.75 miles. It was expected that this grid would be considered a "master grid" for the alternatives. The structures for each alternative would be added and the cell spacing would be adjusted accordingly. | ||
In Phase 1 of the study, several structural and non-structural alternatives were modeled at Sargent Beach (groins, breakwaters, beach fills). Breakwaters are one of the most computationally complex features in GenCade, and grids with breakwaters take much longer to simulate than grids with any other feature. The large grid with the breakwaters took | In Phase 1 of the study, several structural and non-structural alternatives were modeled at Sargent Beach (groins, breakwaters, beach fills). Breakwaters are one of the most computationally complex features in GenCade, and grids with breakwaters take much longer to simulate than grids with any other feature. The large grid with the breakwaters took more than a day to finish the simulation. The grids that did not include breakwaters took less than 20 minutes. In order to meet the deadline for the first phase of the project, the grid was shortened. | ||
After the first phase of the study was completed, the sponsor refined the goals at Sargent Beach and decided that different breakwater alternatives would be investigated further. In addition, during phase 2, many groin alternatives would need to be simulated at Matagorda Peninsula. Due to the large number of simulations, it would be very difficult to meet the project deadlines while using the large grid. While shortening the grids reduces simulation run time, it was necessary to determine how shortening the grid affects the results. | After the first phase of the study was completed, the sponsor refined the goals at Sargent Beach and decided that different breakwater alternatives would be investigated further. In addition, during phase 2, many groin alternatives would need to be simulated at Matagorda Peninsula. Due to the large number of simulations, it would be very difficult to meet the project deadlines while using the large grid. While shortening the grids reduces simulation run time, it was necessary to determine how shortening the grid affects the results. | ||
First, a shorter grid was set up with the same parameters as the longer, initial grid. The same shorelines and waves were also used. Then the results of these two grid were compared in the region where the grids overlapped. The shorter grid focused on Matagorda Peninsula | First, a shorter grid was set up with the same parameters as the longer, initial grid. The same shorelines and waves were also used. Then the results of these two grid were compared in the region where the grids overlapped. The shorter grid focused on Matagorda Peninsula was 28 miles long and had 335 cells. Figure 11 compares shoreline change between the two grids. The original grid is in blue and the shorter grid is in red. The shoreline change rates in the overlap region are nearly identical. There is a slight difference in the shoreline change near MCR. The reason for this is due to the grid spacing. Although the same cell spacing was specified in each case, the length of each grid will cause the cell spacing to adjust slightly. For example, the specified minimum and maximum cell sizes were 40 and 150 m (130 and 490 ft). In the original grid, these cell sizes were adjusted to 37.348 m and 149.98 m. The shorter grid cell sizes were adjusted to 39.013 m and 149.379 m. These small adjustments in cell size cause the locations of the inlet, bypassing bars, and bypasing operations to be slightly different. These small differences in location will cause the minor change in calculated shoreline near MCR. | ||
[[Image:Fig11_comp_grids.jpg|400px|thumb|left|Figure 11. Comparison between original and shorter grids]] | [[Image:Fig11_comp_grids.jpg|400px|thumb|left|Figure 11. Comparison between original and shorter grids]] | ||
| Line 98: | Line 98: | ||
Once it was determined that the shorter grid produced very similar results to the longer grid, it was possible to continue the alternatives with the shorter grid. However, it was still not known how long of a grid was needed to ensure boundary conditions did not affect the area of interest. The no action alternative at Matagorda Peninsula was compared to Alternative 5 and Alternative 5 - Shifted. Both the left and right boundaries were classified as pinned. When the three alternatives were compared, there was no difference in shoreline change from the left boundary to nearly 14 miles from the boundary. The location where differences in shoreline change were noted was 2.5 miles northeast of 3 Mile Cut. It was also noted that shoreline changes were not seen until 1.7 miles south of MCR. This is shown in Figure 12. Since the groins did not affect shoreline change outside of a 7 mile region near the center of the grid, this grid length was adequate to use for the Matagorda Peninsula alternatives. The same type of response was noted for the Sargent Beach grids. | Once it was determined that the shorter grid produced very similar results to the longer grid, it was possible to continue the alternatives with the shorter grid. However, it was still not known how long of a grid was needed to ensure boundary conditions did not affect the area of interest. The no action alternative at Matagorda Peninsula was compared to Alternative 5 and Alternative 5 - Shifted. Both the left and right boundaries were classified as pinned. When the three alternatives were compared, there was no difference in shoreline change from the left boundary to nearly 14 miles from the boundary. The location where differences in shoreline change were noted was 2.5 miles northeast of 3 Mile Cut. It was also noted that shoreline changes were not seen until 1.7 miles south of MCR. This is shown in Figure 12. Since the groins did not affect shoreline change outside of a 7 mile region near the center of the grid, this grid length was adequate to use for the Matagorda Peninsula alternatives. The same type of response was noted for the Sargent Beach grids. | ||
[[Image:Fig12_MP_comp.jpg|400px|thumb|left|Figure | [[Image:Fig12_MP_comp.jpg|400px|thumb|left|Figure 12. Comparison between alternatives at Matagorda Peninsula]] | ||
<br style="clear:both" /> | <br style="clear:both" /> | ||
=== Multiple Breakwaters in GenCade === | === Multiple Breakwaters in GenCade === | ||
As mentioned in the last section, breakwaters take significantly longer to model than any other feature in GenCade. For example, a typical grid takes less than one minute to run for each year simulated. This grid can include inlets, beach fills, seawalls, groins, and multiple wave gauges. If a breakwater is added to this same grid, the computation time might increase from one minute per simulation year to more than 20 minutes per simulation year. If multiple breakwaters are included, this further slows down the model. The 10 breakwater alternative took about 2.5 hours to run for 5 years in the simulation. However, one of the last alternatives that needed to be modeled consists of more than 80 breakwaters (extending more than 8 miles). This setup took more than a day to run each year of the simulation, so the five year simulation took almost a week to run. This is not reasonable for a 1-line model. In addition, instabilities in the model could occur at some point in the simulation and require the user to | As mentioned in the last section, breakwaters take significantly longer to model than any other feature in GenCade. For example, a typical grid takes less than one minute to run for each year simulated. This grid can include inlets, beach fills, seawalls, groins, and multiple wave gauges. If a breakwater is added to this same grid, the computation time might increase from one minute per simulation year to more than 20 minutes per simulation year. If multiple breakwaters are included, this further slows down the model. The 10 breakwater alternative took about 2.5 hours to run for 5 years in the simulation. However, one of the last alternatives that needed to be modeled consists of more than 80 breakwaters (extending more than 8 miles). This setup took more than a day to run each year of the simulation, so the five year simulation took almost a week to run. This is not reasonable for a 1-line model. In addition, instabilities in the model could occur at some point in the simulation and require the user to modify the time step or cell spacing and start the simulation over. | ||
For this study, the 10 breakwater cases were simulated first. Once these were simulated, the 15 and 81 breakwaters were set up and run. Due to the large number of breakwaters and diffracting tips of the breakwaters, instabilities occurred. The time step was decreased, but this further slows down the simulation time. About halfway through the 81 breakwater case, a system-wide power outage occurred, requiring the simulation to be restarted. | For this study, the 10 breakwater cases were simulated first. Once these were simulated, the 15 and 81 breakwaters were set up and run. Due to the large number of breakwaters and diffracting tips of the breakwaters, instabilities occurred. The time step was decreased, but this further slows down the simulation time. About halfway through the 81 breakwater case, a system-wide power outage occurred, requiring the simulation to be restarted. | ||
This was the first study which included more than a few breakwaters. Before this study, none of the development team members realized that breakwaters would increase the run time so significantly. While the study was being completed, the GenCade coder attempted to streamline the code to improve the efficiency of the model. Unfortunately, these improvements did not speed up the simulation times with breakwaters present. During the study, the team came across a few ideas that could help a person running a simulation with multiple breakwaters. First, it is more efficient to run the simulation outside of the SMS. For example, on a certain machine, two simulations can be run through SMS. When the simulations are run in the command prompt, three can be run at once. Many users do not have multiple computers at their disposal, so increasing the number of simulations that can be performed at once will decrease the amount of time necessary to complete a study. Secondly, this study compared alternatives after 5 and 16 years. Instead of running the 5 and 16 year simulations separately, the 5 years can be run as part of the 16 year simulation. The waves and initial shoreline in both cases are identical. While the simulation will continue running past 5 years, the user can view and analyze the results after 5 years. None of the output files can be opened before the full simulation is finished. In order to view the files, copy the *.prt, *.slo, and any other necessary output file to another folder. The user will be able to open and work with those files from that other folder. The results after 5 years in a 16 year simulation were compared to the results of a 5 year simulation. The results were almost identical (rounding differences), so this allows the user to run a single simulation instead of duplicating the first 5 years in multiple simulations. | This was the first study which included more than a few breakwaters. Before this study, none of the development team members realized that breakwaters would increase the run time so significantly. While the study was being completed, the GenCade coder attempted to streamline the code to improve the efficiency of the model. Unfortunately, these improvements did not speed up the simulation times with breakwaters present. During the study, the team came across a few ideas that could help a person running a simulation with multiple breakwaters. First, it is more efficient to run the simulation outside of the SMS. For example, on a certain machine, two simulations can be run through SMS. When the simulations are run in the command prompt, three can be run at once. Many users do not have multiple computers at their disposal, so increasing the number of simulations that can be performed at once will decrease the amount of time necessary to complete a study. To run a simulation from the command prompt, the GenCade executable needs to be copied to the directory containing the input files. After the command prompt is opened and the proper directory is located, simply enter the name of the executable followed by the name of the *.gen file. It is also possible to drag-and-drop the *.gen file onto the GenCade executable in the windows environment. Secondly, this study compared alternatives after 5 and 16 years. Instead of running the 5 and 16 year simulations separately, the 5 years can be run as part of the 16 year simulation. The waves and initial shoreline in both cases are identical. While the simulation will continue running past 5 years, the user can view and analyze the results after 5 years. None of the output files can be opened before the full simulation is finished. In order to view the files, copy the *.prt, *.slo, and any other necessary output file to another folder. The user will be able to open and work with those files from that other folder. The results after 5 years in a 16 year simulation were compared to the results of a 5 year simulation. The results were almost identical (rounding differences), so this allows the user to run a single simulation instead of duplicating the first 5 years in multiple simulations. | ||
After this project was over, the GenCade coder developed adaptive time-stepping. Although this did not help speed up the simulations for this study, it will be beneficial for future studies. Adaptive time-stepping is not available in the SMS; instead, the user must modify the *.gen file (shown below). | After this project was over, the GenCade coder developed adaptive time-stepping. Although this did not help speed up the simulations for this study, it will be beneficial for future studies. Adaptive time-stepping is not available in the SMS; instead, the user must modify the *.gen file (shown below). | ||
| Line 129: | Line 129: | ||
STABMAX: 0.5 !MAX STABILITY VALUE (LOWER THRESHOLD OF STABILITY) FOR ADAPTIVE TIME-STEPPING (VALUE OF STABMIN SHOULD BE <=0.5) | STABMAX: 0.5 !MAX STABILITY VALUE (LOWER THRESHOLD OF STABILITY) FOR ADAPTIVE TIME-STEPPING (VALUE OF STABMIN SHOULD BE <=0.5) | ||
=== Adaptive Approach === | === Adaptive Approach === | ||
GenCade (and all 1-line shoreline change models) is constrained by a number of standard assumptions. The complex processes at Sargent | GenCade (and all 1-line shoreline change models) is constrained by a number of standard assumptions. The complex processes at Sargent Beach related to the presence of cohesive sediments clearly stretch the standard assumptions. However, no better model exists to evaluate the long-term function of proposed alternatives. Therefore, it was necessary to consider the model results qualitatively and apply engineering judgment in the application to design. | ||
First, it should be noted, GenCade modeling was only a part of this study. Before any simulations were modeled, the coastal processes of the region were studied. A sediment budget was completed, an equilibrium analysis at Mitchell’s Cut was performed, and the influence of the Brazos River on shoreline change was analyzed. | First, it should be noted, GenCade modeling was only a part of this study. Before any simulations were modeled, the coastal processes of the region were studied. A sediment budget was completed, an equilibrium analysis at Mitchell’s Cut was performed, and the influence of the Brazos River on shoreline change was analyzed. | ||
| Line 142: | Line 141: | ||
Since the performance of the shoreline stabilization project on Matagorda Peninsula (3 groins) is heavily dependent on the natural bypassing at MCR, no structures should be constructed until sufficient data has been gathered and analyzed to determine the influence of the new east jetty on adjacent beaches and inlet dynamics. A monitoring project to determine the rate of natural bypassing at MCR, the rate of sediment trapping and shoreline change to the northeast, and the rate of sediment lost and shoreline change to the southwest was recommended. Once the monitoring data have been analyzed and the final groin and beach fill configuration | Since the performance of the shoreline stabilization project on Matagorda Peninsula (3 groins) is heavily dependent on the natural bypassing at MCR, no structures should be constructed until sufficient data has been gathered and analyzed to determine the influence of the new east jetty on adjacent beaches and inlet dynamics. A monitoring project to determine the rate of natural bypassing at MCR, the rate of sediment trapping and shoreline change to the northeast, and the rate of sediment lost and shoreline change to the southwest was recommended. Once the monitoring data have been analyzed and the final groin and beach fill configuration chosen, the system should be constructed starting with the downdrift (southwest) groin, then completed in order towards the northeast. If the beach fill is included in the final design, it should be placed as the groins are completed. | ||
==== Sargent Beach ==== | ==== Sargent Beach ==== | ||
| Line 167: | Line 166: | ||
Sediment success criteria | Sediment success criteria | ||
* Trapping 50% of the incident longshore transport under normal conditions | * Trapping 50% of the incident longshore transport under normal conditions | ||
* Reduced/ | * Reduced/no net shoreline recession behind breakwater field | ||
* Downdrift placement has minimal/no impact at Mitchell's Cut | * Downdrift placement has minimal/no impact at Mitchell's Cut | ||
* Mitchell's Cut remained stable with breakwaters placed | * Mitchell's Cut remained stable with breakwaters placed | ||
| Line 196: | Line 195: | ||
After collecting and analyzing data, the project team should discuss the results, determine how well the preliminary analyses represented observed conditions, and consider preferred alternatives for future actions. | After collecting and analyzing data, the project team should discuss the results, determine how well the preliminary analyses represented observed conditions, and consider preferred alternatives for future actions. | ||
Reference: Kraus, N.C., Lin, L., Smith, E.R., Heilman, D.J., and Thomas, R.C., 2008. Long-term structural solution for the Mouth of the Colorado River Navigation Channel. ERDC/CHL TR-08-4. Vicksburg, MS: U.S. Army Engineer Research and Development Center. | |||
Latest revision as of 16:03, 20 December 2013
Introduction and Study Overview
The Port of Bay City, Texas, asked the U.S. Army Corps of Engineers to develop potential structural solutions to reduce erosion of critical beach habitat and to increase protection from tropical storms in Matagorda County. The two primary areas of concern are Sargent Beach and a 2-3 mile stretch of beach on Matagorda Peninsula located about a mile east of the Mouth of the Colorado River (MCR). This two-part study investigated the coastal processes of the region and introduced several structural alternatives to reduce erosion. Phase 1 of the study investigated the coastal processes and determined which structural solutions would be evaluated further in Phase 2. Phase 2 described the detailed alternatives and introduced preliminary design. Figure 1 shows a map of the project area and region.
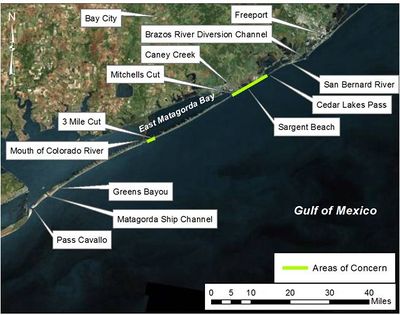
This study was presented in a series of technical reports. Phase 1 was published in 2012 while the Phase 2 report was published in 2013. Since this was a very in-depth study and included analysis with several models, the details of the study will not be presented here. Instead, basic details of the GenCade analysis will be shown. In addition, this study allowed the GenCade team learned several lessons related to the model and improve GenCade for future studies. These lessons are presented here to provide additional information for GenCade users.
Matagorda Peninsula
The original objectives at Matagorda Peninsula were to reduce erosion and increase beach width over a defined target area. Following a presentation of the Phase 1 results to the sponsor, the final project goals were refined as listed below.
- Establish a groin field to stabilize the beach from the north access road to 3 Mile Cut.
- Increase the dry beach width by 200 ft over this area.
- Ensure no impact to shoreline change at 3 Mile Cut.
- Exclude bypassing plants at MCR. Natural bypassing and dredging at MCR and placement near the west beach might occur (various levels of federal funded bypassing are considered in the shoreline modeling, although no additional non-federal bypassing was recommended or tested).
Several alternatives were modeled in addition to the existing condition. Many of the initial groin configurations resulted in accretion near 3 Mile Cut, which was undesirable because it could change the way the ephemeral inlet has functioned. Therefore, each of the alternatives was rerun with the groin field shifted 1,640 ft to the southwest. The best performing alternative was Alternative 5-Shifted. The alternatives considered are shown below.
- Alternative 0 - No action, no groins constructed
- Alternative 1 - Seven groins, 400 ft long, 800 ft apart (last three groins shorter and closer together); first groin approximately 2,500 ft southwest of 3 Mile Cut
- Alternative 1 - Shifted - Same as Alternative 1, groins shifted 1,640 ft to southwest
- Alternative 2 - Five groins, 400 ft long, 1,200 ft apart (last two shorter and closer together); first groin 2,500 ft southwest of 3 Mile Cut
- Alternative 2 - Shifted - Same as Alternative 2, groins shifted 1,640 ft to southwest
- Alternative 3 - Five groins, 600 ft long, 1,200 ft apart (last two are shorter and closer together); first groin 2,500 ft southwest of 3 Mile Cut
- Alternative 3 - Shifted - Same as Alternative 3, groins shifted 1,640 ft to southwest
- Alternative 4 - Five groins, 600 ft long, 1,800 ft apart (last two shorter and closer together); first groin 2,500 ft southwest of 3 Mile Cut
- Alternative 4 - Shifted - Same as Alternative 4, groins shifted 1,640 ft to southwest
- Alternative 5 - Three groins, 800 ft long, 1,600 ft apart
- Alternative 5 - Shifted - Same as Alternative 5, groins shifted 1,640 ft to southwest
To find out more about the alternatives that were not selected, please refer to the Phase 2 report. Only Alternative 5 - Shifted and non-structural solutions will be discussed here.
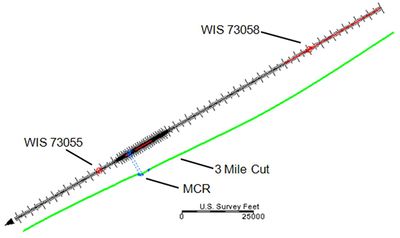
The model domain was 28 miles long, extending about 3.3 miles southwest of Mitchell's Cut to about 8.7 miles southwest of MCR (Figure 2). The model was run for 5 and 16 years.
The baseline is to take no action. There are also three variations without structures that were simulated. The four cases are no action (no beach fill, no mechanical bypassing), a 200-ft wide beach fill without mechanical bypassing, 200,000 cu yd/yr of mechanical bypassing without a beach fill, and a 200-ft wide beach fill with 200,000 cu yd/yr of mechanical bypassing. Figure 3 compares shoreline change of the four variations of non-structural alternatives after 5 years while Figure 4 shows the variations after 16 years.
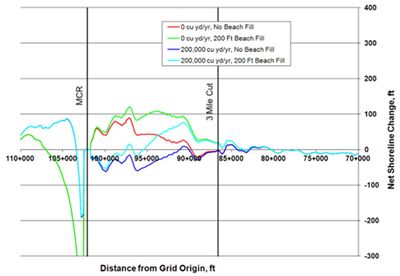
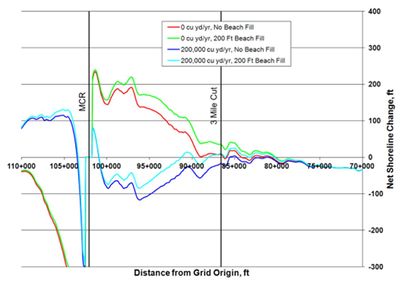
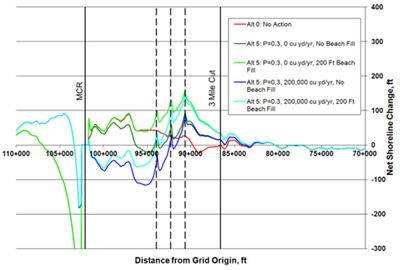
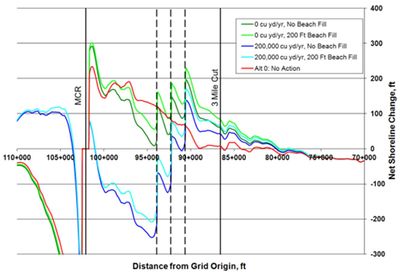
The same variations of beach fills and mechanical bypassing were included in the Alternative 5 - Shifted setup. The shoreline change results of those four variations of Alternative 5 - Shifted are compared with the no action baseline case after 5 and 16 years (Figures 5 and 6). Regardless of the amount of bypassing and the construction of a beach fill, the shoreline will advance updrift and erode downdrift of the groin field. None of the alternatives resulted in the suggested 200 ft of shoreline advance across the range of the project, even when a beach fill was added. Of all of the modeled alternatives, Alternative 5 - Shifted provided shoreline advance most similar to the recommended project requirements. The wide range of results between the bypassing and no bypassing variations illustrates the need for monitoring at MCR.
Sargent Beach
The initial goal at Sargent Beach was to stop erosion over the target area. Phase 1 modeling results indicated that a breakwater field would best meet this goal. Following the completion of Phase 1, a meeting was held with the sponsor and the following final project goals were specified.
- Segmented breakwaters will be analyzed for shore protection at Sargent.
- The final alternatives might include a terminal groin.
- Beach fill can be included if necessary.
- An adaptive and scalable plan will be developed. The plan will ensure that the project functions as intended with minimal downdrift impacts. The plan will include multiple layouts to accommodate incremental funding.
- The first phase of the adaptive plan should consist of approximately 10 breakwater segments starting near Mitchell’s Cut, moving northward/eastward.
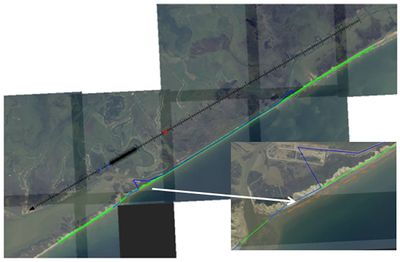
The GenCade grid extends from about 5.1 miles southwest of the Brazos River to about 3.6 miles southwest of Mitchell’s Cut for a total of 16 miles. The cells range in size from 33 to 490 ft. The smallest cells were necessary to provide detail in the breakwater regions and to meet GenCade model guidance recommendations regarding number of cells representing a breakwater. It was recommended that the breakwaters be placed at a distance of 350 ft offshore. The breakwaters were 220 ft long and the gap size was 330 ft. The GenCade setup is shown in Figure 7. The lengths of the first and last breakwaters and the gap sizes were adjusted in some of the alternatives. Additionally, several phases of construction were considered. This is because it is unlikely that there would be enough funding to construct breakwaters in front of the entire revetment at Sargent Beach. This wiki page only describes the first alternative, 10 breakwaters, but the other alternatives are included in the appendix of the Phase 2 report.
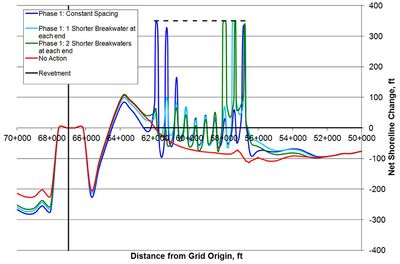
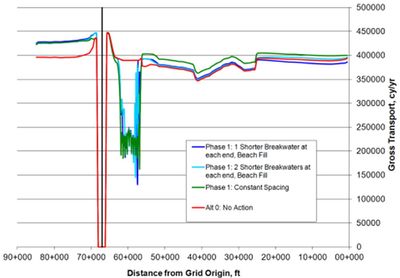
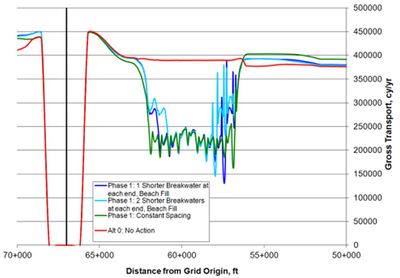
A baseline case with No Action was simulated to compare to the first phase of breakwaters after 5 years. This baseline case included Mitchell’s Cut but did not include any structural alternatives. The ten breakwaters were modeled just north of Mitchell’s Cut to represent the Phase 1 demonstration project. For the initial case, all of the breakwaters are the same length and same distance apart. Figure 8 compares the No Action alternative to the different variations of Phase 1 breakwaters for shoreline change while Figures 9 and 10 compare the average gross transport. The “Constant Spacing” in both figures refers to the simulation where the breakwaters were 220 ft long and all gaps sizes were 330 ft. The “Phase 1: 1 Shorter Breakwater at each end” represents the case where the first and last breakwaters were shortened to 98 ft and the gap sizes between those breakwaters were 460 ft. The “Phase 1: 2 Shorter Breakwaters at each end” represents the case where the first, second, ninth, and tenth breakwaters were all shortened to 98 ft while the gaps between the first and second, second and third, eighth and ninth, and ninth and tenth breakwaters were 460 ft. Regardless of the spacing between the breakwaters at the ends, they reduce the erosion in the area of interest. The gross transport in the vicinity of the breakwaters is reduced by about 45%. All breakwater cases include a 36,000 cu yd/yr mitigation beach fill directly to the south of Mitchell’s Cut.
Lessons Learned
Several lessons were learned during the GenCade portion of the Sargent Beach and Matagorda Peninsula study. Two of these lessons were fairly basic while the third refers to an approach for cases that do not meet all of the basic assumptions of GenCade.
Extent of GenCade Grid
Before any of the alternatives could be modeled, GenCade was calibrated and validated. This original grid extended from the San Bernard River to the Matagorda Ship Channel and contained a total of 655 grid cells with variable size from 130 to 490 ft with the smaller cells near the structures and inlets. The total length of the grid was 54.75 miles. It was expected that this grid would be considered a "master grid" for the alternatives. The structures for each alternative would be added and the cell spacing would be adjusted accordingly.
In Phase 1 of the study, several structural and non-structural alternatives were modeled at Sargent Beach (groins, breakwaters, beach fills). Breakwaters are one of the most computationally complex features in GenCade, and grids with breakwaters take much longer to simulate than grids with any other feature. The large grid with the breakwaters took more than a day to finish the simulation. The grids that did not include breakwaters took less than 20 minutes. In order to meet the deadline for the first phase of the project, the grid was shortened.
After the first phase of the study was completed, the sponsor refined the goals at Sargent Beach and decided that different breakwater alternatives would be investigated further. In addition, during phase 2, many groin alternatives would need to be simulated at Matagorda Peninsula. Due to the large number of simulations, it would be very difficult to meet the project deadlines while using the large grid. While shortening the grids reduces simulation run time, it was necessary to determine how shortening the grid affects the results.
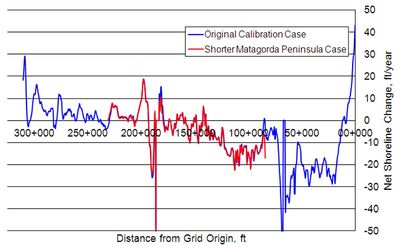
First, a shorter grid was set up with the same parameters as the longer, initial grid. The same shorelines and waves were also used. Then the results of these two grid were compared in the region where the grids overlapped. The shorter grid focused on Matagorda Peninsula was 28 miles long and had 335 cells. Figure 11 compares shoreline change between the two grids. The original grid is in blue and the shorter grid is in red. The shoreline change rates in the overlap region are nearly identical. There is a slight difference in the shoreline change near MCR. The reason for this is due to the grid spacing. Although the same cell spacing was specified in each case, the length of each grid will cause the cell spacing to adjust slightly. For example, the specified minimum and maximum cell sizes were 40 and 150 m (130 and 490 ft). In the original grid, these cell sizes were adjusted to 37.348 m and 149.98 m. The shorter grid cell sizes were adjusted to 39.013 m and 149.379 m. These small adjustments in cell size cause the locations of the inlet, bypassing bars, and bypasing operations to be slightly different. These small differences in location will cause the minor change in calculated shoreline near MCR.
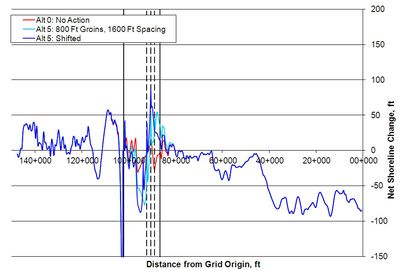
Once it was determined that the shorter grid produced very similar results to the longer grid, it was possible to continue the alternatives with the shorter grid. However, it was still not known how long of a grid was needed to ensure boundary conditions did not affect the area of interest. The no action alternative at Matagorda Peninsula was compared to Alternative 5 and Alternative 5 - Shifted. Both the left and right boundaries were classified as pinned. When the three alternatives were compared, there was no difference in shoreline change from the left boundary to nearly 14 miles from the boundary. The location where differences in shoreline change were noted was 2.5 miles northeast of 3 Mile Cut. It was also noted that shoreline changes were not seen until 1.7 miles south of MCR. This is shown in Figure 12. Since the groins did not affect shoreline change outside of a 7 mile region near the center of the grid, this grid length was adequate to use for the Matagorda Peninsula alternatives. The same type of response was noted for the Sargent Beach grids.
Multiple Breakwaters in GenCade
As mentioned in the last section, breakwaters take significantly longer to model than any other feature in GenCade. For example, a typical grid takes less than one minute to run for each year simulated. This grid can include inlets, beach fills, seawalls, groins, and multiple wave gauges. If a breakwater is added to this same grid, the computation time might increase from one minute per simulation year to more than 20 minutes per simulation year. If multiple breakwaters are included, this further slows down the model. The 10 breakwater alternative took about 2.5 hours to run for 5 years in the simulation. However, one of the last alternatives that needed to be modeled consists of more than 80 breakwaters (extending more than 8 miles). This setup took more than a day to run each year of the simulation, so the five year simulation took almost a week to run. This is not reasonable for a 1-line model. In addition, instabilities in the model could occur at some point in the simulation and require the user to modify the time step or cell spacing and start the simulation over.
For this study, the 10 breakwater cases were simulated first. Once these were simulated, the 15 and 81 breakwaters were set up and run. Due to the large number of breakwaters and diffracting tips of the breakwaters, instabilities occurred. The time step was decreased, but this further slows down the simulation time. About halfway through the 81 breakwater case, a system-wide power outage occurred, requiring the simulation to be restarted.
This was the first study which included more than a few breakwaters. Before this study, none of the development team members realized that breakwaters would increase the run time so significantly. While the study was being completed, the GenCade coder attempted to streamline the code to improve the efficiency of the model. Unfortunately, these improvements did not speed up the simulation times with breakwaters present. During the study, the team came across a few ideas that could help a person running a simulation with multiple breakwaters. First, it is more efficient to run the simulation outside of the SMS. For example, on a certain machine, two simulations can be run through SMS. When the simulations are run in the command prompt, three can be run at once. Many users do not have multiple computers at their disposal, so increasing the number of simulations that can be performed at once will decrease the amount of time necessary to complete a study. To run a simulation from the command prompt, the GenCade executable needs to be copied to the directory containing the input files. After the command prompt is opened and the proper directory is located, simply enter the name of the executable followed by the name of the *.gen file. It is also possible to drag-and-drop the *.gen file onto the GenCade executable in the windows environment. Secondly, this study compared alternatives after 5 and 16 years. Instead of running the 5 and 16 year simulations separately, the 5 years can be run as part of the 16 year simulation. The waves and initial shoreline in both cases are identical. While the simulation will continue running past 5 years, the user can view and analyze the results after 5 years. None of the output files can be opened before the full simulation is finished. In order to view the files, copy the *.prt, *.slo, and any other necessary output file to another folder. The user will be able to open and work with those files from that other folder. The results after 5 years in a 16 year simulation were compared to the results of a 5 year simulation. The results were almost identical (rounding differences), so this allows the user to run a single simulation instead of duplicating the first 5 years in multiple simulations.
After this project was over, the GenCade coder developed adaptive time-stepping. Although this did not help speed up the simulations for this study, it will be beneficial for future studies. Adaptive time-stepping is not available in the SMS; instead, the user must modify the *.gen file (shown below).
***** ADAPTIVE DT *****
DTADAPT: 1
For a generic case, this is all a user will need to add. This section should be added just before the ***** WAVES ***** section of the *.gen file. All of the defaults for adaptive time-stepping will be used in this case.
On the other hand, a user may have total advanced control of the adaptive time-stepping by adding the following cards:
***** ADAPTIVE DT *****
DTADAPT: 1 !FLAG TO TURN ON ADAPTIVE TIME-STEPPING
DTMIN: 0.0001 !MIN THRESHOLD OF DT FOR ON-THE-FLY ADAPTIVE TIME-STEPPING
DTMAX: DT !MAX THRESHOLD OF DT FOR ON-THE-FLY ADAPTIVE TIME-STEPPING
NSTABDTMIN: 28 !MIN THRESHOLD FOR NUMBER OF STABLE SIMULATED DAYS TO ELAPSE BEFORE ENGAGING IN ADAPTIVE TIME-STEPPING; CURRENTLY SET TO 28 DAYS = 4 WEEKS
STABMIN: 0.5 !MIN STABILITY VALUE (UPPER THRESHOLD OF STABILITY) FOR ADAPTIVE TIME-STEPPING (VALUE OF STABMIN SHOULD USUALLY BE 0.5, BUT ALWAYS <= 0.5)
STABMAX: 0.5 !MAX STABILITY VALUE (LOWER THRESHOLD OF STABILITY) FOR ADAPTIVE TIME-STEPPING (VALUE OF STABMIN SHOULD BE <=0.5)
Adaptive Approach
GenCade (and all 1-line shoreline change models) is constrained by a number of standard assumptions. The complex processes at Sargent Beach related to the presence of cohesive sediments clearly stretch the standard assumptions. However, no better model exists to evaluate the long-term function of proposed alternatives. Therefore, it was necessary to consider the model results qualitatively and apply engineering judgment in the application to design. First, it should be noted, GenCade modeling was only a part of this study. Before any simulations were modeled, the coastal processes of the region were studied. A sediment budget was completed, an equilibrium analysis at Mitchell’s Cut was performed, and the influence of the Brazos River on shoreline change was analyzed.
Matagorda Peninsula
GenCade was the only model used for the Matagorda Peninsula alternatives. Based on the wide range of results on Matagorda Peninsula and the limitations of the model, the results were viewed qualitatively. This means that specific rates of shoreline change were not considered, only the comparison between cases and the shoreline change trends of those cases. For example, Alternative 5 – Shifted with a beach fill may experience more accretion that Alternative 5 – Shifted without a beach fill, but the calculated shoreline change rates were not considered in the analysis. In addition to the GenCade modeling, a preliminary groin system design was provided. While the length and locations of the groins were based on the GenCade modeling, the armor size, groin section, and beach fill design were based on engineering calculations.
The new east jetty at MCR was constructed in 2010. This has caused a change in the equilibrium conditions that has not been monitored or documented. The design documents for the new jetty (Kraus et al. 2008) predicted that 200,000 cu yd/yr of mechanical bypassing from the north to the south sides of the jetty would be required. In addition, there is a risk associated with predicting beach response to structures based on simplified models forced with historical data. This uncertainty in how beaches east of MCR will respond to the new jetty increases the uncertainty associated with beach response to the new groin system.
Since the performance of the shoreline stabilization project on Matagorda Peninsula (3 groins) is heavily dependent on the natural bypassing at MCR, no structures should be constructed until sufficient data has been gathered and analyzed to determine the influence of the new east jetty on adjacent beaches and inlet dynamics. A monitoring project to determine the rate of natural bypassing at MCR, the rate of sediment trapping and shoreline change to the northeast, and the rate of sediment lost and shoreline change to the southwest was recommended. Once the monitoring data have been analyzed and the final groin and beach fill configuration chosen, the system should be constructed starting with the downdrift (southwest) groin, then completed in order towards the northeast. If the beach fill is included in the final design, it should be placed as the groins are completed.
Sargent Beach
Due to the complexity of Sargent Beach, two models were used to simulate the breakwater alternatives. Before either numerical model was used, basic design criteria for segmented breakwaters at other Gulf of Mexico projects was researched for comparison. Barge-based and land-based construction were considered. These previously constructed breakwaters gave the team a starting point for the crest height, distance offshore, length, and depth. As mentioned previously, GenCade was used to model the different alternatives (breakwaters with different lengths, different gap size, different distances offshore). GenCade provided the shoreline change results. The CMS was used to model the salient size, transmitted wave heights, currents, and to evaluate the option of a terminal groin. Following the GenCade and CMS modeling, a preliminary breakwater design was produced. The armor size, breakwater section (crest width, scour protection, side slopes, and typical section), and beach fill design were calculated.
Sargent Beach experiences some of the highest rates of erosion on the Texas coast and the beach includes silts, clay, and sand. The net transport in the area is small relative to the gross transport. The recommended plan includes the construction of segmented breakwaters which is one of the most sensitive coastal protection structures. These factors make it impossible to reduce risk to an acceptable level to move forward with full-scale construction. A fully adaptive approach to project implementation is recommended. By building one or more smaller demonstration projects, then monitoring performance and revising structure design, it will be possible to evaluate performance and potential negative outcomes in a manageable way with less risk and dependence on science not yet understood.
The general adaptive process is listed below.
- Define goals or objectives
- Develop an understanding of the environment and create/modify a plan based on the best available science and data
- Take action
- Monitor the project
- Analyze monitoring data
- Start over at step 1, reducing risk through each iteration
The demo project recommended in the study is the 10 breakwater system. The demo project will be considered successful if structural and sediment success criteria are met.
Structural success criteria
- No significant scouring or settlement
- No significant displacement of armor stone
- Structure crest height maintained within given tolerances
- Wave overtopping as expected
Sediment success criteria
- Trapping 50% of the incident longshore transport under normal conditions
- Reduced/no net shoreline recession behind breakwater field
- Downdrift placement has minimal/no impact at Mitchell's Cut
- Mitchell's Cut remained stable with breakwaters placed
- Structure placement does not cause excessive trapping end effects or tombolo formation over the project design lifetime
- The predicted amount of mitigation material is approximately equal to the amount of material trapped by the breakwaters
After construction of the 10 breakwaters, the system should be monitored for at least a year or until performance and impacts are conclusively measured. Any lessons learned from the demo should be applied to the design of subsequent phases and modification of the 10 breakwaters.
Monitoring goals:
- Quantify shoreline change in and adjacent to the project area
- Quantify volume trapped and bypassed at the breakwater field and the volume lost on adjacent beaches
- Quantify stability of Mitchell's Cut
- Quantify wave transmission through breakwater field
Recommended monitoring actions:
- Monthly surveys of the beach and Mitchell's Cut during the first 3 months after construction. Surveys should be collect biannually and after energetic storms
- Quarterly surveys and inspection of segmented breakwaters
- Continuous water-level monitoring in the GIWW at FM457
- Quarterly georeferenced vertical aerial photography
- Deploy wave gauges seaward and landward of the breakwaters
Recommended analyses:
- Aerial photographs should be analyzed to determine shoreline change
- Surveys should be analyzed and coupled with the shoreline change analysis to determine volume trapped and lost on the beaches behind and adjacent to the breakwater field
- Water level data should be used to help evaluate project performance and to determine how well actual conditions relate to modeled conditions
- Breakwater surveys and inspections will enable analysis of structural performance and inform design adaptations
- Analysis of Mitchell's Cut morphology should be conducted to ensure stability
After collecting and analyzing data, the project team should discuss the results, determine how well the preliminary analyses represented observed conditions, and consider preferred alternatives for future actions.
Reference: Kraus, N.C., Lin, L., Smith, E.R., Heilman, D.J., and Thomas, R.C., 2008. Long-term structural solution for the Mouth of the Colorado River Navigation Channel. ERDC/CHL TR-08-4. Vicksburg, MS: U.S. Army Engineer Research and Development Center.