CMS-Flow:Wind Pressure: Difference between revisions
No edit summary |
No edit summary |
||
| Line 40: | Line 40: | ||
\right. | \right. | ||
</math>|3}} | </math>|3}} | ||
<center>[[File:fig_2_2.bmp|400px]] | <center>[[File:fig_2_2.bmp|400px]] | ||
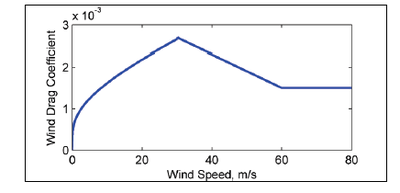
'''Modified Hsu (1988) wind drag coefficient.'''</center> | '''Figure 2. Modified Hsu (1988) wind drag coefficient.'''</center> | ||
Powell et al. (2003) speculate that the reason for the decrease in drag coefficient with higher wind speeds is due to increasing foam coverage leading to the formation of a ''slip'' surface at the air-sea interface. | Powell et al. (2003) speculate that the reason for the decrease in drag coefficient with higher wind speeds is due to increasing foam coverage leading to the formation of a ''slip'' surface at the air-sea interface. | ||
Revision as of 14:54, 18 February 2015
Wind Surface Stress
The wind surface stress is calculated as
| (1) |
where
- = air density at sea level [~1.2 kg/m3]
- = wind drag coefficient [-]
- = 10-m wind speed [m/s]
- = 10-m wind velocity magnitude [m/s].
The wind speed is calculated using either an Eulerian or Lagrangian reference frame as
| (2) |
where:
- = 10-m atmospheric wind speed relative to the solid earth (Eulerian wind speed) [m/s]
- = equal to zero for the Eulerian reference frame or one for the Lagrangian reference frame
- = current velocity [m/s].
Using the Lagrangian reference frame or relative wind speed is more accurate and realistic for field applications (Bye 1985; Pacanowski 1987; Dawe and Thompson 2006), but the option to use the Eulerian wind speed is provided for idealized cases and backward compatibility. The drag coefficient is calculated using the formula of Hsu (1988) and modified for high wind speeds based on field data by Powell et al. (2003) (Figure 2):
| (3) |

Powell et al. (2003) speculate that the reason for the decrease in drag coefficient with higher wind speeds is due to increasing foam coverage leading to the formation of a slip surface at the air-sea interface.
Wind measurements taken at heights other than 10 m are converted to 10-m wind speeds using the 1/7 rule (Shore Protection Manual (SPM) 1984; Coastal Engineering Manual (CEM) 2002):
| (4) |
where z is the elevation above the sea surface of the wind measurement, and Wiz is the wind velocity at height z.
Pressure
The atmospheric pressure is included in the momentum equations as an additional pressure gradient term
| (5) |
Symbol Index
| Symbol | Description | Units |
|---|---|---|
| Wind shear stress | Pa | |
| Atmospheric density (~1.2 kg/m^3) | kg/m^3 | |
| Wind drag coefficient | none | |
| 10-min averaged wind speed at 10 m above the sea surface | m/sec | |
| Wind direction | m/sec |
References
- Coastal Engineering Manual (CEM). 2002. Engineer Manual 1110-2-1100. Washington, DC: US Army Corps of Engineers.
- Dawe, J. T., and L. Thompson. 2006. Effect of ocean surface currents on wind stress, heat flux, and wind power input to the ocean. Geophysical Research Letters (3):3, L09604.
- Hsu, S.A. (1988) Coastal meteorology. Academic Press, San Diego, CA.
- Pacanowski, R. C. 1987. Effect of equatorial currents on surface wind stress. Journal of Physical Oceanography (17):833–838.
- Powell, M. D., P. J., Vickery, and T. A. Reinhold. 2003. Reduced drag coefficient for high wind speeds in tropical cyclones. Nature (422):279–283.
- Shore Protection Manual (1984) 4th ed., 2nd Vol, U.S. Army Engineer Waterways Experiment Station, U.S. Government Printing Office, Washington, DC.


