GenCade:Grid System: Difference between revisions
(Initial Creation) |
m (Finished first section) |
||
| Line 7: | Line 7: | ||
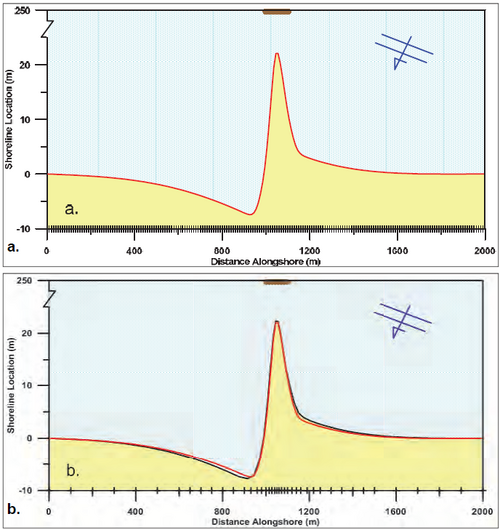
GenCade allows the use of irregular grid spacing, as illustrated in Figure 2. Figure 2a displays the shoreline response by a 100-m long detached breakwater located 100 m offshore of the initially straight shoreline (note the break in the vertical axis for better display). The system was exposed to constant waves with H = 1 m, T = 5 sec, and . = -5 deg for three months. The grid spacing was held constant at dx = 10 m for all 200 cells. Figure 2b shows the same application with an irregular grid. The higher resolution of dxmin = 10 m was now only used in the immediate vicinity of the structure and the grid cell size was gradually increased to dxmax = 100 m further away from the breakwater. The resulting response from the simulation with the higher resolution is shown by a red line, whereas the corresponding result using the variable grid resolution is shown by a black line. '''As seen in Figure 2b, the two results are almost identical even though (a) used five times as much computation effort as (b). Thus, by using higher resolution only in areas with greater variation in processes and using lower resolution elsewhere, significant execution effort may be saved.''' | GenCade allows the use of irregular grid spacing, as illustrated in Figure 2. Figure 2a displays the shoreline response by a 100-m long detached breakwater located 100 m offshore of the initially straight shoreline (note the break in the vertical axis for better display). The system was exposed to constant waves with H = 1 m, T = 5 sec, and . = -5 deg for three months. The grid spacing was held constant at dx = 10 m for all 200 cells. Figure 2b shows the same application with an irregular grid. The higher resolution of dxmin = 10 m was now only used in the immediate vicinity of the structure and the grid cell size was gradually increased to dxmax = 100 m further away from the breakwater. The resulting response from the simulation with the higher resolution is shown by a red line, whereas the corresponding result using the variable grid resolution is shown by a black line. '''As seen in Figure 2b, the two results are almost identical even though (a) used five times as much computation effort as (b). Thus, by using higher resolution only in areas with greater variation in processes and using lower resolution elsewhere, significant execution effort may be saved.''' | ||
[[File:ThreeMonthSimulation.png|500px|thumb|center|Figure 2. Three Month Simulation]] | [[File:ThreeMonthSimulation.png|500px|thumb|center|Figure 2. Three Month Simulation with (A) having 200 cells at a 10 meter resolution and (B) having 40 cells at various resolutions]] | ||
For detailed analysis, it is recommended that at least nine grid points (eight cells) be placed behind detached breakwaters and between adjacent groins. In a scoping mode application or if a wide coastal extent is being covered for which detail at any one structure is not vital, it is recommended that at least four cells be used. Grid spacing in the modeling system should be selected through a balance of the following five conditions: | |||
#Resolution desired | |||
#Numerical stability | |||
#Accuracy of measured shoreline positions and other data | |||
#Expected reliability of the prediction (which mainly depends on the verification and quality of input wave data) | |||
#Computer execution time (which depends on the time step, number of cells on the grid, and the simulation interval) | |||
It should be remembered that execution time increases substantially as the number of diffracting structures increases. As stated above, by using the variable grid capability in GenCade, higher grid resolution can be applied behind detached breakwaters and between adjacent groins, while a lower resolution is used along open sections of the model domain. The variable grid capability can reduce execution time while allowing sufficient resolution in the vicinity of diffracting structures. | |||
== Useful Links == | == Useful Links == | ||
Revision as of 21:46, 21 December 2022
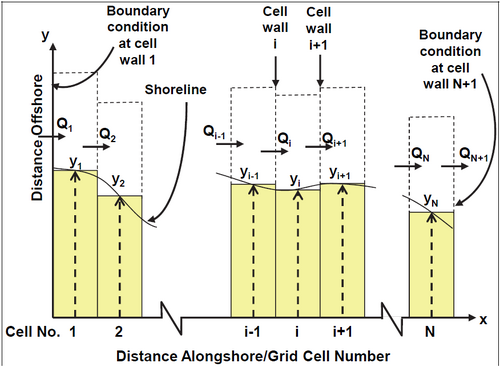
As discussed above, a right-hand coordinate system is laid out with the xaxis following the main trend of the shoreline and the y-axis perpendicular to it and pointing offshore (Figure 1). The shoreline grid along the x-axis consists of N cells defined by N+l cell walls. The user may specify a maximum of 4000 cells to define a domain. The cell resolution may be distributed uniformly or variably alongshore. In GenCade, calculated quantities along the shoreline are discretized on a staggered grid in which shoreline positions yi are defined at the center of the grid cells (“y-points”) and transport rates Qi at the cell walls (“Q-points”), as shown in Figure 1. The left boundary is located at grid cell 1, and the right boundary is at cell N. In total there are N values of the shoreline position. Similarly, there are N+l values of the longshore sand transport rate since N+l cell walls enclose the N cells; values of the transport rate must be specified at the boundaries, Q1 and QN+l, and the remainder of the Qi and all yi will be calculated. Since the Qi-rates are a function of the wave conditions, all wave quantities are calculated at Q-points. The tips of groins and detached breakwaters are likewise located at Q-points. Seawalls, beach fills, river discharges, and other sand sources and sinks are located at y-points.
Recommended Resolution
GenCade allows the use of irregular grid spacing, as illustrated in Figure 2. Figure 2a displays the shoreline response by a 100-m long detached breakwater located 100 m offshore of the initially straight shoreline (note the break in the vertical axis for better display). The system was exposed to constant waves with H = 1 m, T = 5 sec, and . = -5 deg for three months. The grid spacing was held constant at dx = 10 m for all 200 cells. Figure 2b shows the same application with an irregular grid. The higher resolution of dxmin = 10 m was now only used in the immediate vicinity of the structure and the grid cell size was gradually increased to dxmax = 100 m further away from the breakwater. The resulting response from the simulation with the higher resolution is shown by a red line, whereas the corresponding result using the variable grid resolution is shown by a black line. As seen in Figure 2b, the two results are almost identical even though (a) used five times as much computation effort as (b). Thus, by using higher resolution only in areas with greater variation in processes and using lower resolution elsewhere, significant execution effort may be saved.
For detailed analysis, it is recommended that at least nine grid points (eight cells) be placed behind detached breakwaters and between adjacent groins. In a scoping mode application or if a wide coastal extent is being covered for which detail at any one structure is not vital, it is recommended that at least four cells be used. Grid spacing in the modeling system should be selected through a balance of the following five conditions:
- Resolution desired
- Numerical stability
- Accuracy of measured shoreline positions and other data
- Expected reliability of the prediction (which mainly depends on the verification and quality of input wave data)
- Computer execution time (which depends on the time step, number of cells on the grid, and the simulation interval)
It should be remembered that execution time increases substantially as the number of diffracting structures increases. As stated above, by using the variable grid capability in GenCade, higher grid resolution can be applied behind detached breakwaters and between adjacent groins, while a lower resolution is used along open sections of the model domain. The variable grid capability can reduce execution time while allowing sufficient resolution in the vicinity of diffracting structures.

