GenCade Val:Genesis Validation - Jucar River: Difference between revisions
m Added sections |
mNo edit summary |
||
| (2 intermediate revisions by 2 users not shown) | |||
| Line 1: | Line 1: | ||
{{DISPLAYTITLE:GenCade Validation - Jucar River, Cullera, Spain}} | |||
Analysis of shoreline change along beaches adjacent the Jucar River in Spain was performed by Gravens (1997, 1998a, b) using the Generalized Model for Simulating Shoreline Change (GENESIS) model (Hanson 1987), a predecessor of the GenCade model. The Jucar River case was analyzed with GenCade to provide additional model validation for simple cases excluding the inlet within the model domain and to investigate potential differences between GenCade and GENESIS for one well documented case. | Analysis of shoreline change along beaches adjacent the Jucar River in Spain was performed by Gravens (1997, 1998a, b) using the Generalized Model for Simulating Shoreline Change (GENESIS) model (Hanson 1987), a predecessor of the GenCade model. The Jucar River case was analyzed with GenCade to provide additional model validation for simple cases excluding the inlet within the model domain and to investigate potential differences between GenCade and GENESIS for one well documented case. | ||
| Line 33: | Line 35: | ||
Two model domains were developed. The beaches to the north of the jetties at Jucar River, Playa de San Antonio and Playa del Reco, comprise the north domain. Playa del Marenyet and Playa de Estany beaches, south of the jetties, comprise the southern domain (domain locations labeled in Figure 1). Both domains used the jetties as one boundary. The northern end of the north domain was pinned and the southern end of the south domain was specified with measured shoreline change. A constant cell size of 25 m was applied. Figure 8 shows the northern domain. Figure 9 shows the southern domain. Table 1 lists common input data applied. | Two model domains were developed. The beaches to the north of the jetties at Jucar River, Playa de San Antonio and Playa del Reco, comprise the north domain. Playa del Marenyet and Playa de Estany beaches, south of the jetties, comprise the southern domain (domain locations labeled in Figure 1). Both domains used the jetties as one boundary. The northern end of the north domain was pinned and the southern end of the south domain was specified with measured shoreline change. A constant cell size of 25 m was applied. Figure 8 shows the northern domain. Figure 9 shows the southern domain. Table 1 lists common input data applied. | ||
[[File:GenCadeNorthDomain.jpg| | [[File:GenCadeNorthDomain.jpg|400px|thumb|center|Figure 8. GenCade North Domain, red line is the initial shoreline, blue line is the north jetty.]] | ||
[[File:GenCadeSouthDomain.jpg| | [[File:GenCadeSouthDomain.jpg|400px|thumb|center|Figure 9. GenCade South Domain, red line is the initial shoreline, blue and orange lines represent the composite south jetty.]] | ||
[[File:Table5ModelInput.jpg|600px|thumb|center|Table 1. Model Input]] | [[File:Table5ModelInput.jpg|600px|thumb|center|Table 1. Model Input]] | ||
Latest revision as of 16:57, 6 March 2023
Analysis of shoreline change along beaches adjacent the Jucar River in Spain was performed by Gravens (1997, 1998a, b) using the Generalized Model for Simulating Shoreline Change (GENESIS) model (Hanson 1987), a predecessor of the GenCade model. The Jucar River case was analyzed with GenCade to provide additional model validation for simple cases excluding the inlet within the model domain and to investigate potential differences between GenCade and GENESIS for one well documented case.
Background
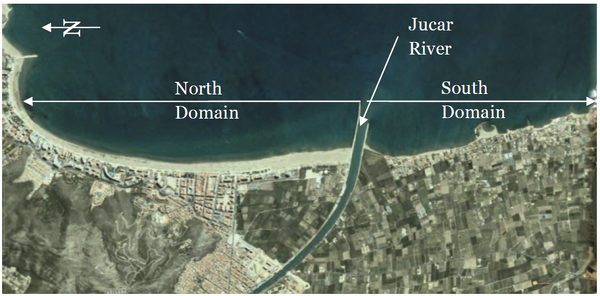
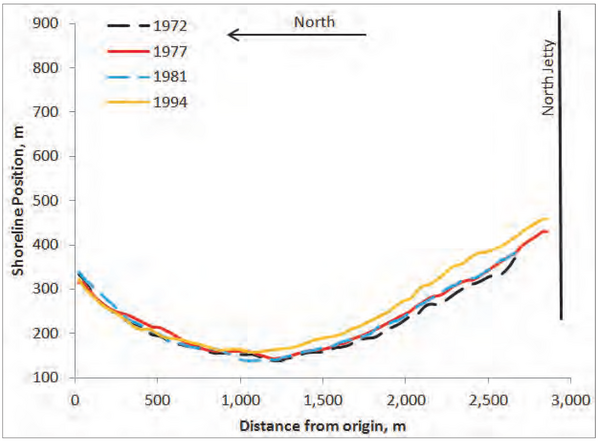
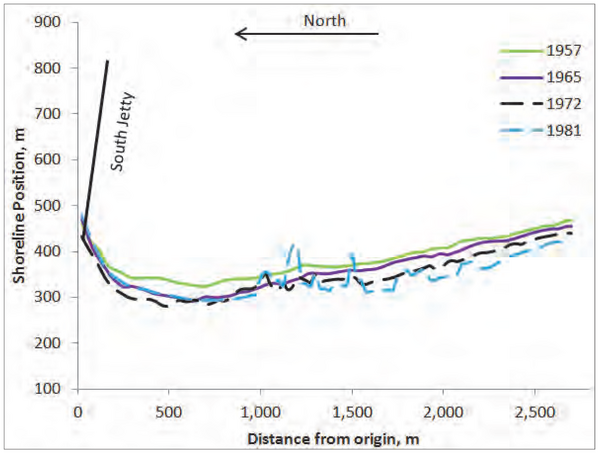
Figure 1 shows a recent aerial of the Jucar River and beaches. Shoreline position data are available from 1957, 1965, 1972, 1977, 1981, and 1994 (shorelines plotted in Figures 2 and 3); however, shorelines do not cover both north and south sides of the inlet for most data sets. The data show persistence of a sandy beach to the north with shoreline advance adjacent the north jetty. Sand was extracted from the beach north of the jetties multiple times between 1982 and 1994. Beaches to the south experienced chronic erosion and were armored in the early 1970s to protect beach property.
Gravens (1997) applied a target sediment budget, developed based on a 1994 CEDEX report, along with measured shoreline change to help calibrate the models. Net sand transport along the beaches was reported to be approximately 65,000 m3/year to the south with gross transport of 115,000 m3/year.
GENESIS Results
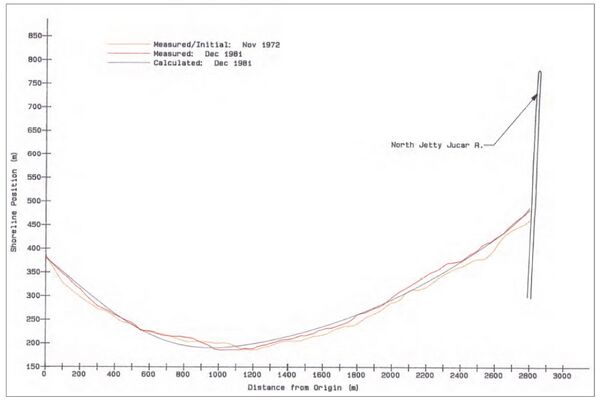
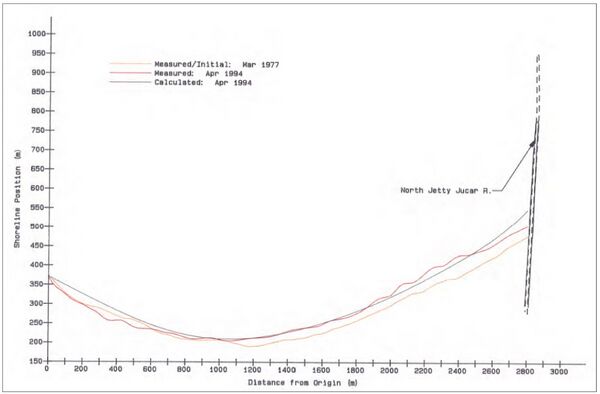
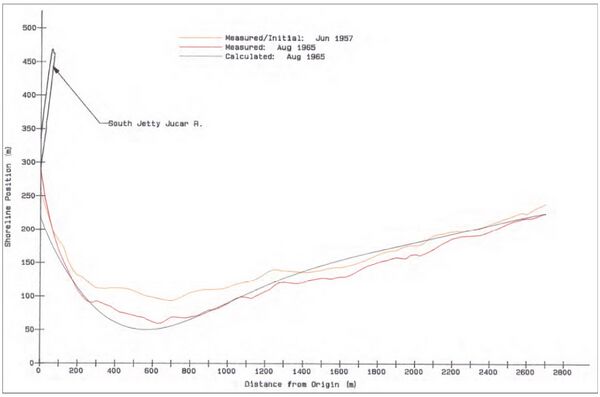
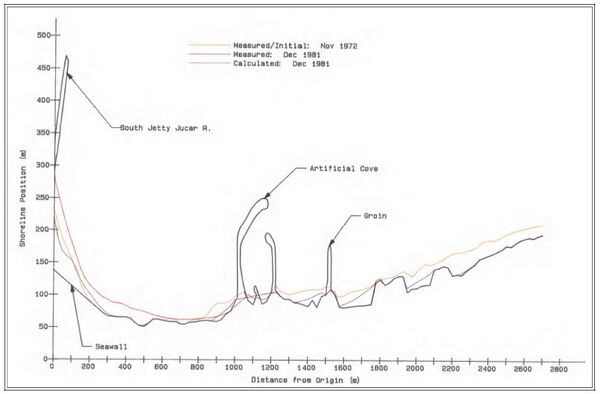
GENESIS results, excerpted from Gravens (1997), are plotted in Figures 4 – 7 for comparison to GenCade. North domain model results (Figures 4 – 5) show shoreline advance except for a region about 2,000 m north of the jetty, following the general trends observed in the measured shorelines. GENESIS results fit observations less well for the southern domain (Figure 6). The model over predicts retreat near the jetty and predicts advance further south where the observed shoreline retreated. Observations available to verify model performance over the south domain include construction of groins and revetments, complicating shoreline response and modeling.
Calculated average net transport for the north domain during the calibration period was 61,900 m3/year to the south with gross transport of 90,000 m3/year. Calculated average net transport for the south domain during the calibration period was 59,300 m3/year to the south with gross transport of 98,000 m3/year. Calculated rates over both domains match the target budget well.
GenCade Model Setup and Parameters
Model Domain
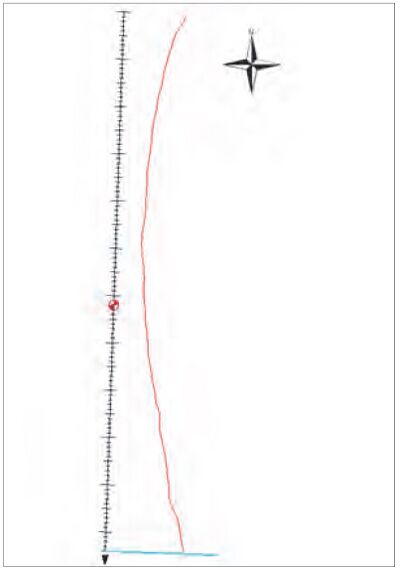
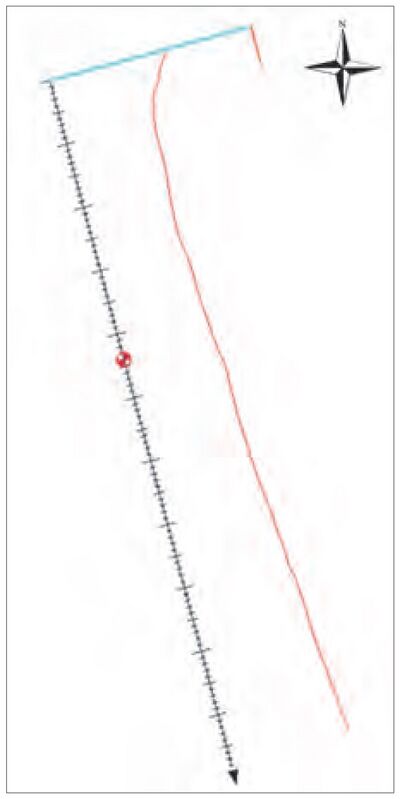
Two model domains were developed. The beaches to the north of the jetties at Jucar River, Playa de San Antonio and Playa del Reco, comprise the north domain. Playa del Marenyet and Playa de Estany beaches, south of the jetties, comprise the southern domain (domain locations labeled in Figure 1). Both domains used the jetties as one boundary. The northern end of the north domain was pinned and the southern end of the south domain was specified with measured shoreline change. A constant cell size of 25 m was applied. Figure 8 shows the northern domain. Figure 9 shows the southern domain. Table 1 lists common input data applied.

Model Forcing: Waves
Statistical wave data based on ship board observations analyzed by ALATEC S.A. in November 1996 were applied in Gravens (1997). The data were binned in seven heights and 16 directions and organized in 6-hour time steps to represent a typical year. Data applied in Gravens (1997) was applied in GenCade to enable consistent comparison between model results. Wave observations are assumed to be at the 20 m depth contour.
Model Parameters
Various parameters were adjusted to calibrate GenCade. Table 2 lists the best fit values for each domain.

GenCade Model Results and Discussion
North Domain
K1 and K2 were initially varied to match the target sediment budget, and then modified to improve the shoreline change predictions. Table 3 shows the GenCade calculated transport rates. Similar values for K1 and K2 were required to match observed shoreline change observed. Calculated transport was higher than GENESIS calculated transport rates which were lower than estimated transport rates.

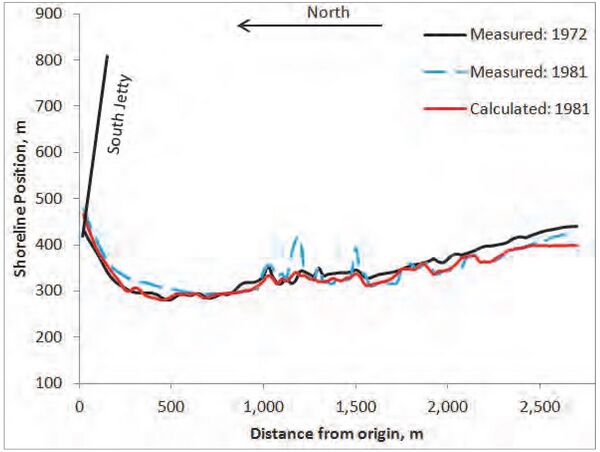
Figure 10 plots the measured and GenCade calculated shoreline position from 1972 to 1981 over the north domain. GenCade matches the observed shoreline change well near the jetty and middle of the domain, but over predicts to the north.
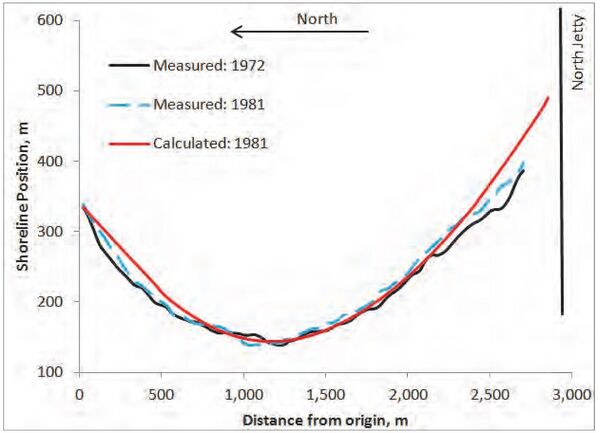
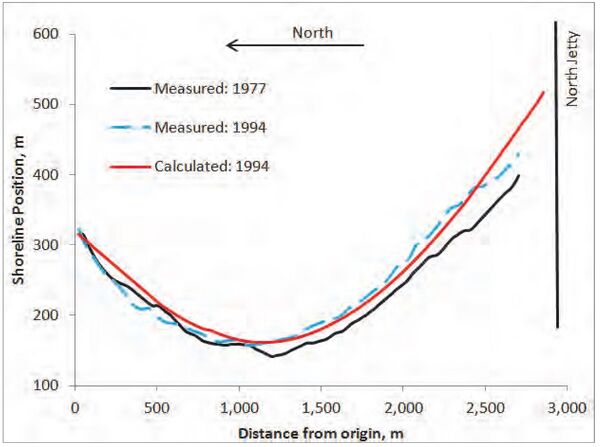
Figure 11 plots the measured and GenCade calculated shoreline position from 1977 to 1994 over the north domain to verify the calibrated model setup. Over this time period, GenCade matches the observed shoreline change well near the jetty and tends to over-predict advance over the northward 1,000 m. GENESIS results in Figure 5 shows the same general trend.
South Domain
Table 5 shows the GenCade mean calculated transport rates. Net transport during the calibration period is slightly above the target, while the gross transport is about equivalent to the target budget. Calculated transport rate during the verification period is lower than the target, likely the result of shoreline armoring.

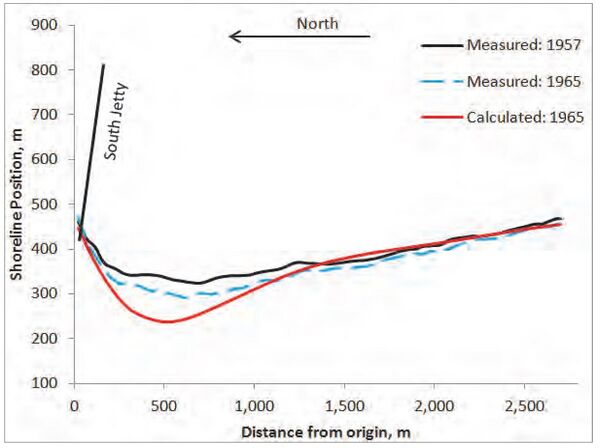
Figure 12 plots the measured and GenCade calculated shoreline position from 1957 to 1965 over the south domain. GenCade over-predicts retreat 500 m south of the jetty. Beyond about 1,500 m south of the jetty, GenCade predictions are seaward of the observations. GENESIS results in Figure 6 show the same general trend.
Figure 13 plots the measured and GenCade calculated shoreline position from 1972 to 1981 over the south domain to verify the calibrated model setup. The shoreline was heavily armored during this period, making it difficult to accurately verify the model. The verification does provide an opportunity to test the seawall function within GenCade. A seawall and multiple short groins were specified to represent the revetment and marina construction along the shoreline. The modeled shoreline retreats to the seawall with small pocket beaches forming between groins and in places where the revetment acts as a groin. These pocket beaches are evident in the modern aerial photo (Figure 1). The GENESIS model effort encountered the same difficulty and resulted in the same trends.
Conclusions
A GenCade model was developed for the beaches adjacent the Jucar River mouth near Cullera, Spain. The model demonstrates GenCade performance for sandy beaches adjacent a jettied river mouth and enables comparison to GENESIS. The following general conclusions are offered:
- GenCade reproduced shoreline change and transport as well as GENESIS for this case;
- GenCade calculated transport rates varied slightly from the target transport. The magnitude of the difference in GenCade was similar to the difference calculated in GENESIS.