Long wave propagation: Difference between revisions
Jump to navigation
Jump to search
(→Setup) |
(→Setup) |
||
| Line 7: | Line 7: | ||
*Bottom friction: | *Bottom friction: | ||
:0 sec/m^(1/3) (Manning N) | :0 sec/m^(1/3) (Manning N) | ||
*Horizontal eddy viscosity: 0 m^2/sec | *Horizontal eddy viscosity: | ||
* | :0 m^2/sec | ||
Run duration: 5 days | *Run duration: | ||
:5 days | |||
Ramp period: 2 days | *Ramp period: | ||
:2 days | |||
Time step: 10 min | *Time step: | ||
:10 min | |||
Wall Friction: Off | *Wall Friction: | ||
:Off | |||
Grid resolution: | *Grid resolution: | ||
:1000 x 1000 m (constant) | |||
Number of cells: 23409 | *Number of cells: | ||
:23409 | |||
<br style="clear:both" /> | <br style="clear:both" /> | ||
Revision as of 19:30, 13 May 2010
Setup
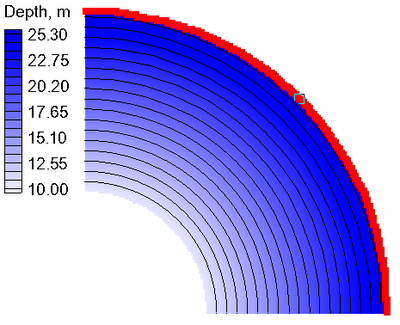
- Forcing:
- 0.3048 m amplitude M2 tide (red cell string)
- Bottom friction:
- 0 sec/m^(1/3) (Manning N)
- Horizontal eddy viscosity:
- 0 m^2/sec
- Run duration:
- 5 days
- Ramp period:
- 2 days
- Time step:
- 10 min
- Wall Friction:
- Off
- Grid resolution:
- 1000 x 1000 m (constant)
- Number of cells:
- 23409
Results
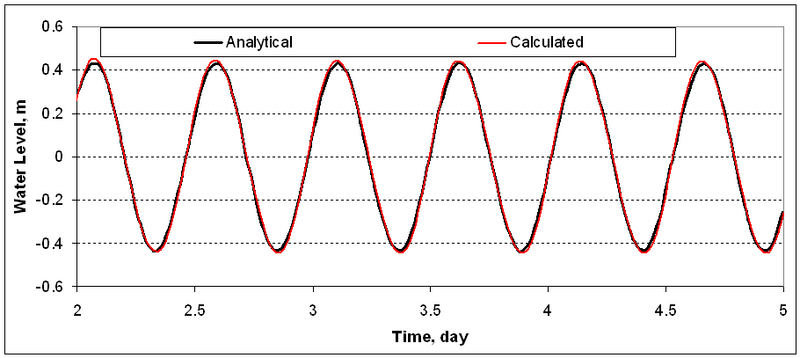
The figure below shows a time series of water
levels at the green point shown in the figure above.

