Channel infilling under waves perpendicular to steady currents: Difference between revisions
Created page with '== '''Setup''' == Normal 0 false false false MicrosoftInternetExplorer4 A laboratory experiment on the channel morphology change under cross-cha…' |
|||
| (6 intermediate revisions by the same user not shown) | |||
| Line 1: | Line 1: | ||
= | <big> | ||
__NOTOC__ | |||
<font color=red>'''UNDER CONSTRUCTION'''</font> | |||
==Experiment== | |||
[[Image:vanRijn_Havinga_Exp_Setup.png|thumb|right|600px| Figure 1. Experimental setup. (from van Rijn and Havinga 1993)]] | |||
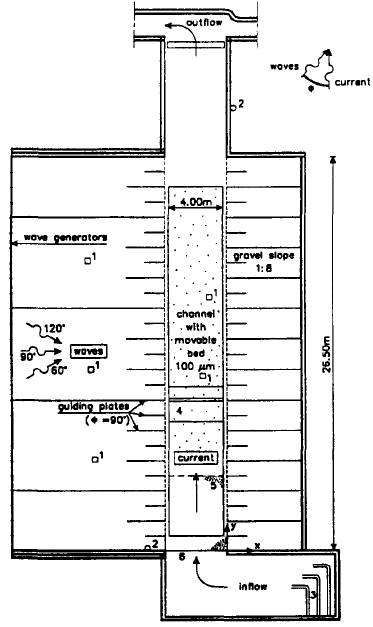
A laboratory experiment on the channel morphology change under cross-channel flow with waves perpendicular to the channel axis was carried out by van Rijn and Havinga (1986). The rectangular experiment flume was 17 m long and 0.3 m wide. The channel had a side slope of 1:10 and a depth of 0.125 m with respect to the sides. The water depth and current velocity at the upstream end of the flume were 0.255 m and 0.18 m/s, respectively. Regular waves were generated in the same direction of the flow with a height of 0.08 m and period of 1.5 s. The movable bed consisted of fine sand (d50= 0.1 mm). The measured suspended sediment transport at the upstream end of the flume was 0.0167 kg/m-s. For further details on the experiment see van Rijn and Havinga (1986). | |||
<br style="clear:both" /> | <br style="clear:both" /> | ||
== | ==Model Setup== | ||
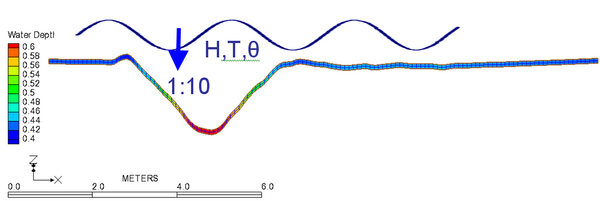
The computational grid and model setup is shown in Figure 2. | |||
[[Image:VanRijn_Havinga_Grid.png|thumb|left|600px| Figure 2. Computational grid for van Rijn and Havinga 1993).]] | |||
<br style="clear:both" /> | |||
==Results == | |||
[[Image:vanRijn_Havinga_Results.png|thumb|right|600px| Figure 3. Computed bed elevations and current velocities at t=10 hrs.]] | |||
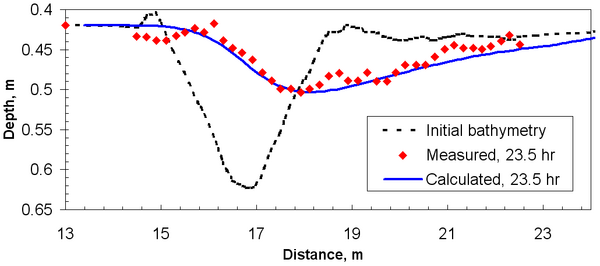
Lund-CIRP transport equation, which is calibrated to match the inflow transport by multiplying a correction factor equal to 0.8. This factor is within the generally accepted range of 0.5-2. Since no measurements for bed load are available, the bed-load transport capacity is not modified. As in the previous case, the transport grain size is set to so that no hiding and exposure is considered in the present simulation. The bed slope coefficient is set to 1.0. The adaptation length is calibrated as approximately 2.5 m by comparing the measured and calculated morphologic changes. Figure 3 shows a comparison of the measured and computed bed elevations after 10 hrs. The model is able to reproduce well the overall trend channel infilling but slightly underestimates the upstream bank migration and slightly overestimates downstream bank erosion. The RMSE and RMAE for case 2 are 0.01 m and 3%, respectively. | |||
<br style="clear:both" /> | <br style="clear:both" /> | ||
== | ==References== | ||
*van Rijn, L. C., Havinga, F. J. (1986) “Transport of fine sands by currents and waves”, Journal of Waterway, Port, Coastal, and Ocean Engineering, 121(2), 123-133. | |||
---- | ---- | ||
[[Test_Cases]] | [[Test_Cases]] | ||
Latest revision as of 15:14, 28 October 2010
UNDER CONSTRUCTION
Experiment

A laboratory experiment on the channel morphology change under cross-channel flow with waves perpendicular to the channel axis was carried out by van Rijn and Havinga (1986). The rectangular experiment flume was 17 m long and 0.3 m wide. The channel had a side slope of 1:10 and a depth of 0.125 m with respect to the sides. The water depth and current velocity at the upstream end of the flume were 0.255 m and 0.18 m/s, respectively. Regular waves were generated in the same direction of the flow with a height of 0.08 m and period of 1.5 s. The movable bed consisted of fine sand (d50= 0.1 mm). The measured suspended sediment transport at the upstream end of the flume was 0.0167 kg/m-s. For further details on the experiment see van Rijn and Havinga (1986).
Model Setup
The computational grid and model setup is shown in Figure 2.

Results

Lund-CIRP transport equation, which is calibrated to match the inflow transport by multiplying a correction factor equal to 0.8. This factor is within the generally accepted range of 0.5-2. Since no measurements for bed load are available, the bed-load transport capacity is not modified. As in the previous case, the transport grain size is set to so that no hiding and exposure is considered in the present simulation. The bed slope coefficient is set to 1.0. The adaptation length is calibrated as approximately 2.5 m by comparing the measured and calculated morphologic changes. Figure 3 shows a comparison of the measured and computed bed elevations after 10 hrs. The model is able to reproduce well the overall trend channel infilling but slightly underestimates the upstream bank migration and slightly overestimates downstream bank erosion. The RMSE and RMAE for case 2 are 0.01 m and 3%, respectively.
References
- van Rijn, L. C., Havinga, F. J. (1986) “Transport of fine sands by currents and waves”, Journal of Waterway, Port, Coastal, and Ocean Engineering, 121(2), 123-133.