Flow over a bump: Difference between revisions
Jump to navigation
Jump to search
No edit summary |
|||
| Line 12: | Line 12: | ||
where <math>z_b</math> is the bed elevation and <math>x</math> is the horizontal distance. | where <math>z_b</math> is the bed elevation and <math>x</math> is the horizontal distance. | ||
Table 1. General Settings for Flow over a Bump | |||
{|border="1" | |||
|'''Parameter''' | |||
|'''Value''' | |||
|- | |||
|Discharge | |||
| 0.18 m^3/s | |||
|- | |||
|Downstream water level | |||
| 0.33 m | |||
|- | |||
|Bottom friction | |||
| None | |||
|} | |||
== Model Setup == | == Model Setup == | ||
The computational domain is 25 m long and has a constant grid resolution of 0.1 m. A flux boundary condition is specified at the inflow boundary and a constant water level boundary condition is applied to the downstream boundary. An adaptive time between 0.1-10 seconds is applied. | |||
[[Image:Bump_Grid.png|thumb|left|600px| Figure 1. Computational grid.]] | [[Image:Bump_Grid.png|thumb|left|600px| Figure 1. Computational grid.]] | ||
<br | <br style="clear:both" /> | ||
== Results == | == Results == | ||
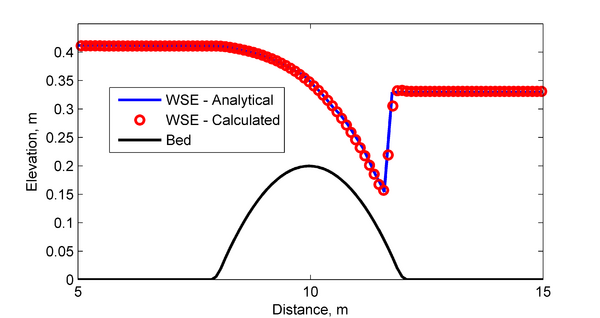
[[Image:Bump_Results.png|thumb|left|600px| Figure 2. Comparison of analytical and calculated water surface elevations and bed elevations.]] | [[Image:Bump_Results.png|thumb|left|600px| Figure 2. Comparison of analytical and calculated water surface elevations and bed elevations.]] | ||
<br | <br style="clear:both" /> | ||
Table | Table 2. Goodness of fit statistics for the water surface elevation | ||
{|border="1" | {|border="1" | ||
|'''Statistic''' | |'''Statistic''' | ||
| Line 40: | Line 56: | ||
| 0.0017 m | | 0.0017 m | ||
|} | |} | ||
== References == | |||
*Caleffi, V., Valiani, A., and Zanni, A. (2003). "Finite volume method for simulating extreme flood events in naturalchannels," Journal of Hydraulic Research, 41(2), 167-177. | |||
---- | ---- | ||
Revision as of 23:31, 14 December 2010
UNDER CONSTRUCTION
Setup
The spatial domain consists of a rectangular
| (1) |
where is the bed elevation and is the horizontal distance.
Table 1. General Settings for Flow over a Bump
| Parameter | Value |
| Discharge | 0.18 m^3/s |
| Downstream water level | 0.33 m |
| Bottom friction | None |
Model Setup
The computational domain is 25 m long and has a constant grid resolution of 0.1 m. A flux boundary condition is specified at the inflow boundary and a constant water level boundary condition is applied to the downstream boundary. An adaptive time between 0.1-10 seconds is applied.
Results
Table 2. Goodness of fit statistics for the water surface elevation
| Statistic | Value |
| RMSE | 0.0074 m |
| RMAE | 0.0068 m |
| R^2 | 0.991 |
| Bias | 0.0017 m |
References
- Caleffi, V., Valiani, A., and Zanni, A. (2003). "Finite volume method for simulating extreme flood events in naturalchannels," Journal of Hydraulic Research, 41(2), 167-177.


