CMS-Flow Boundary Conditions: Difference between revisions
| Line 24: | Line 24: | ||
Two types of Water Surface Elevation Forcing exist for CMS-Flow. Once a water surface elevation curve (or series of curves) is applied, the user is able to display the curve information graphically. | Two types of Water Surface Elevation Forcing exist for CMS-Flow. Once a water surface elevation curve (or series of curves) is applied, the user is able to display the curve information graphically. | ||
1. | === 1. Single time series curve for each cell string (Option "Define curve" in SMS) === | ||
[[Image:Shark_Fig19.PNG|thumb|right|400px|Figure 1. Selecting the cellstring along the ocean boundary, and clicking on]] | [[Image:Shark_Fig19.PNG|thumb|right|400px|Figure 1. Selecting the cellstring along the ocean boundary, and clicking on]] | ||
For this type of BC, a single time series of water levels is specified and is applied at all of the cells along a boundary cell string. The time series curve may be specified by either importing an SMS *.xys file, copying tabular data into SMS, or manually entered the time series information in SMS. To assign this type of BC in SMS: | |||
* | # Select the ''Select a Cellstring'' button, right-click the blue cellstring along the ocean boundary (if this cannot be selected it is because all cellstrings were deleted; this can be regenerated by clicking and clicking around the ocean cells or selecting ''Cellstring'' and ''Generate Along Boundary''), select ''Assign BC'' (Figure 1). | ||
# Select the ''WSE-forcing'' boundary condition, and click curve undefined (Figure 2) <br style="clear:both" /> | |||
<br style="clear:both" /> | |||
[[Image:Shark_Fig20.PNG|thumb|right|400px|Figure 2. Top: is the blank ''''''''XY Series Editor''''''''; Bottom: after the data is pasted in.]] | [[Image:Shark_Fig20.PNG|thumb|right|400px|Figure 2. Top: is the blank ''''''''XY Series Editor''''''''; Bottom: after the data is pasted in.]] | ||
# Copy-paste a time series into the ''XY Series Editor'' (Figure 2), | |||
# Zoom in on the graph on the right (Figure 2) to view the data up close, | |||
# Click export to save the xys (time series file) of the tide for use in other of the Shark River grid<nowiki>’</nowiki>s cellstrings, and save in the Tide folder, click ''OK'' when finished inspecting the pasted data, click ''OK''. | |||
# Save the ''CMS-Flow Simulation File'' (.cmcards) in the original folder this alternative was saved in, and the new cellstring information will be saved with the card file. | |||
<br style="clear:both" /> | <br style="clear:both" /> | ||
=== 2. Time series curve for each cell on cell string (Option "Extract from data set" in SMS) === | |||
User creates a cellstring for the given boundary and extracts multiple time series curves from a dataset or database. Each cell along the cellstring is given its own time-series curve information. Examples are: | |||
* Extraction of water surface elevation values from a larger domain solution (ie. Larger CMS-Flow or ADCIRC grid) | |||
* Extraction of tidal constituent information from a tidal database, from which a water surface elevation curve can be generated. | |||
==Tidal Constituent Forcing== | ==Tidal Constituent Forcing== | ||
Revision as of 21:19, 15 January 2011
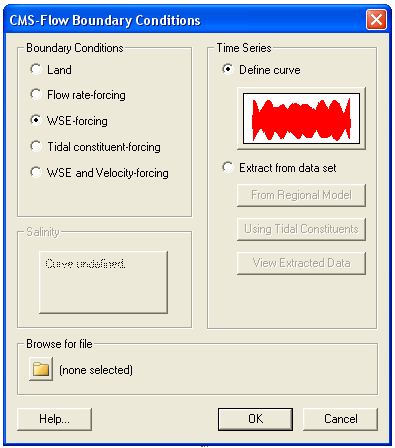
CMS-Flow has five types of boundary conditions which are listed and discussed below. The figure below shows the CMS-Flow Boundary Conditions window in SMS. All CMS-Flow boundary conditions are forced at the edges of the domain by use of cellstrings defined with the Surfacewater Modeling System (SMS). Cellstrings can either be created manually or using the SMS tool called Generate Along Boundary which is found under the Cellstring menu.
Land
The land boundary conditions is equivalent to a zero flux boundary condition. The land boundary condition is the default boundary condition when a cell string is created. It is not necessary to define land boundaries in the interior of the CMS-Flor domain, since land boundarys will automatically be detected by CMS-Flow based on the local water depths and the presence of inactive land cells.
Flow Rate-Forcing
The flow rate boundary condition specifies a time series of water fluxes in units of m^3/s per cell.
NOTES:
- Total flow rate specified is divided between the total number of cells in the cellstring with each carrying a portion of the total.
- This boundary type may only be specified along cell strings which are straight.
- The sign of the flow rate curve is dependent on the direction of flow with respect to the origin (always lower-left hand corner of the grid).
- This guide should assist in proper assignment:
- Flow rate from the East - Negative value
- Flow rate from the West - Positive value
- Flow rate from the North - Negative value
- Flow rate from the South - Positive value
Water Surface Elevation Forcing
Two types of Water Surface Elevation Forcing exist for CMS-Flow. Once a water surface elevation curve (or series of curves) is applied, the user is able to display the curve information graphically.
1. Single time series curve for each cell string (Option "Define curve" in SMS)
For this type of BC, a single time series of water levels is specified and is applied at all of the cells along a boundary cell string. The time series curve may be specified by either importing an SMS *.xys file, copying tabular data into SMS, or manually entered the time series information in SMS. To assign this type of BC in SMS:
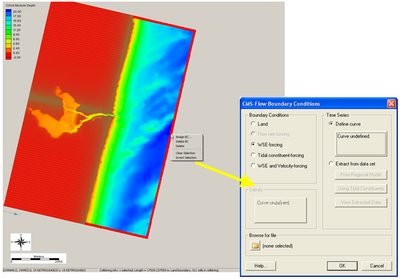
- Select the Select a Cellstring button, right-click the blue cellstring along the ocean boundary (if this cannot be selected it is because all cellstrings were deleted; this can be regenerated by clicking and clicking around the ocean cells or selecting Cellstring and Generate Along Boundary), select Assign BC (Figure 1).
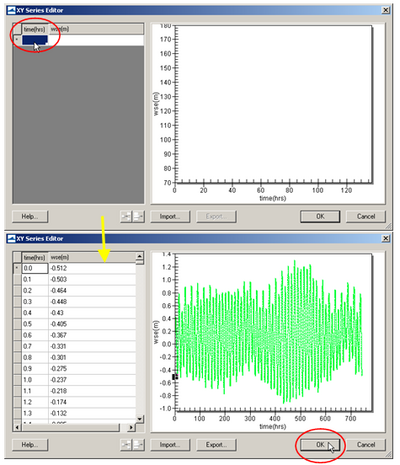
- Select the WSE-forcing boundary condition, and click curve undefined (Figure 2)
- Copy-paste a time series into the XY Series Editor (Figure 2),
- Zoom in on the graph on the right (Figure 2) to view the data up close,
- Click export to save the xys (time series file) of the tide for use in other of the Shark River grid’s cellstrings, and save in the Tide folder, click OK when finished inspecting the pasted data, click OK.
- Save the CMS-Flow Simulation File (.cmcards) in the original folder this alternative was saved in, and the new cellstring information will be saved with the card file.
2. Time series curve for each cell on cell string (Option "Extract from data set" in SMS)
User creates a cellstring for the given boundary and extracts multiple time series curves from a dataset or database. Each cell along the cellstring is given its own time-series curve information. Examples are:
- Extraction of water surface elevation values from a larger domain solution (ie. Larger CMS-Flow or ADCIRC grid)
- Extraction of tidal constituent information from a tidal database, from which a water surface elevation curve can be generated.
Tidal Constituent Forcing
CMS-Flow as the option of forcing with a harmonic tidal water surface elevation. To assign a boundary as a tidal boundary:
- Select a cellstring
- Click under CMS-Flow | Assign BChttp://cirp.usace.army.mil/CIRPwiki/index.php?title=CMS-Flow_Boundary_Conditions&action=edit...
- In the CMS-Flow Boundary Conditions window, click on Tidal constituent-forcing, and click OK.
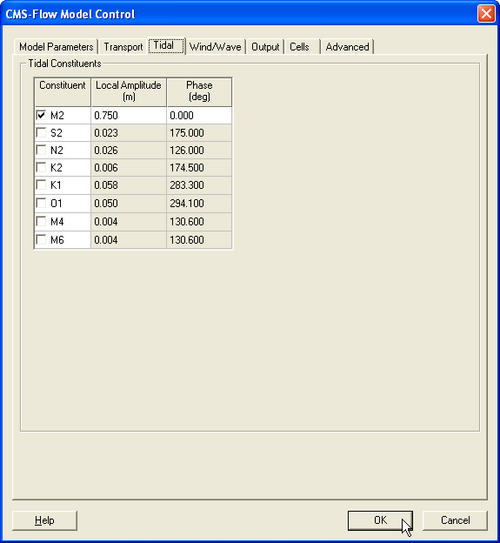
- Open the CMS-Flow Model Control window and click on the tab labeled Tidal.
- Enter the amplitudes and phases of the tidal constituents. Note that the same amplitude and phase are applied to entire cellstring and click OK
Tidal constituents used in CMS
| Constituent | Speed | Constituent | Speed | Constituent | Speed | Constituent | Speed |
|---|---|---|---|---|---|---|---|
| SA* | 0.041067 | SSA* | 0.082137 | MM* | 0.54438 | MSF* | 1.0159 |
| MF* | 1.098 | 2Q1* | 12.8543 | Q1* | 13.3987 | RHO1* | 13.4715 |
| O1* | 13.943 | M1* | 14.4967 | P1* | 14.9589 | S1* | 15.0 |
| K1* | 15.0411 | J1* | 15.5854 | OO1* | 16.1391 | 2N2* | 27.8954 |
| MU2* | 27.9682 | N2* | 28.4397 | NU2* | 28.5126 | M2 | 28.9841 |
| LDA2* | 29.4556 | L2* | 29.5285 | T2* | 29.9589 | S2 | 30 |
| R2* | 30.0411 | K2 | 30.0821 | 2SM2* | 31.0159 | 2MK3* | 42.9271 |
| M3* | 43.4762 | MK3* | 44.0252 | MN4* | 57.4238 | M4 | 57.9682 |
| MS4* | 58.9841 | S4* | 60.0 | M6 | 86.9523 | S6* | 90.0 |
| M8* | 115.9364 |
* Only available through advanced cards for CMS >v4.0
Water Surface Elevation and Velocity Forcing
Users are able to extract both water surface elevations and velocity components from a larger domain solution (ie. Larger CMS-Flow or ADCIRC grid).


