GenCade Application at Point Lookout, NY: Difference between revisions
| (15 intermediate revisions by 2 users not shown) | |||
| Line 4: | Line 4: | ||
[[Image:GenCade1.png|thumb|Fig. 1. Study area map of Point Lookout, Long Beach Island, New York.|250px|]] | [[Image:GenCade1.png|thumb|Fig. 1. Study area map of Point Lookout, Long Beach Island, New York.|250px|Fig. 1. Study area map of Point Lookout, Long Beach Island, New York.]] | ||
The U.S. Army Engineer District, New York, requested the Coastal Inlets Research Program (CIRP) and the Regional Sediment Management Program (RSMP) apply the shoreline change model, GenCade to Point Lookout Beach, located to the west of Jones Inlet on the south shore of Long Island, NY (Figure 1), as part of the Long Beach Island Storm Damage Reduction Project. GenCade is a new model that combines two numerical shoreline change models, the engineering detail of GENESIS (Hanson and Kraus 1989) and the long | The U.S. Army Engineer District, New York, requested the Coastal Inlets Research Program (CIRP) and the Regional Sediment Management Program (RSMP) apply the shoreline change model, GenCade to Point Lookout Beach, located to the west of Jones Inlet on the south shore of Long Island, NY (Figure 1), as part of the Long Beach Island Storm Damage Reduction Project. GenCade is a new model that combines two numerical shoreline change models, the engineering detail of GENESIS (Hanson and Kraus 1989) and the long | ||
| Line 12: | Line 12: | ||
scale sediment management plan that includes the inlet and adjacent beaches. | scale sediment management plan that includes the inlet and adjacent beaches. | ||
[[Image:GenCade2.png|Fig. 2. GenCade grid domain from east to west covers Jones Beach, Point Lookout Beach, Lido Beach, and part of Long Beach | [[Image:GenCade2.png||thumb|250px|Fig. 2. GenCade grid domain from east to west covers Jones Beach, Point Lookout Beach, Lido Beach, and part of Long Beach.]] | ||
Point Lookout Beach is a small beach between two groins that are adjacent to the western terminal groin of Jones Inlet. A public park is located west of Point Lookout and is situated along Hempstead Beach, which is a chronically eroding beach, or erosional hotspot, with a crescentic shoreline. Both Point Lookout and Hempstead are considered part of an isolated beach (Hanson and Kraus 2001) because they are located in the lee of the Jones Inlet ebb | Point Lookout Beach is a small beach between two groins that are adjacent to the western terminal groin of Jones Inlet. A public park is located west of Point Lookout and is situated along Hempstead Beach, which is a chronically eroding beach, or erosional hotspot, with a crescentic shoreline. Both Point Lookout and Hempstead are considered part of an isolated beach (Hanson and Kraus 2001) because they are located in the lee of the Jones Inlet ebb | ||
- | - | ||
| Line 31: | Line 31: | ||
An unavailable report prepared for the State of New York 2006 (Moffatt & Nichol 2006) developed a sediment budget based on shoreline change rates and potential sediment transport values. The report states that present | An unavailable report prepared for the State of New York 2006 (Moffatt & Nichol 2006) developed a sediment budget based on shoreline change rates and potential sediment transport values. The report states that present | ||
- | - | ||
day net transport rates at Jones Beach are on the order of 600,000 cubic yards per year (cy/year), with approximately 480,000 cy/year bypassed to the downdrift Hempstead and Lido Beaches. This budget was included in a New York State report (State of New York 1998) citing net transport rates of 200,000 cy/year the west. In contrast to the potential transport rates calculated by Moffatt & Nichol, the New York District (USACE 2008) measured average channel infilling rates for Jones Inlet of approximately 200,000 cy/year to the west. Point Lookout Beach, which is sheltered by | day net transport rates at Jones Beach are on the order of 600,000 cubic yards per year (cy/year), with approximately 480,000 cy/year bypassed to the downdrift Hempstead and Lido Beaches. This budget was included in a New York State report (State of New York 1998) citing net transport rates of 200,000 cy/year the west. In contrast to the potential transport rates calculated by Moffatt & Nichol, the New York District (USACE 2008) measured average channel infilling rates for Jones Inlet of approximately 200,000 cy/year to the west. Point Lookout Beach, which is sheltered by theJones Inlet ebb | ||
- | - | ||
tidal delta, had a much smaller net transport rate of 20,000 | tidal delta, had a much smaller net transport rate of 20,000 | ||
– | – | ||
80,000 cy/year to the west. From these references, the variability in transport rate between the updrift Jones Beach and the Point Lookout and Hempstead beaches can be considered a ratio where the transport at these isolated beaches is only 10 | |||
- | - | ||
40% of the magnitude of the up | 40% of the magnitude of the up | ||
| Line 77: | Line 77: | ||
The main objective of this study is to provide the New York District with a calibrated GenCade model representing several engineering alternatives to the present layout of Point Lookout. A set of existing condition and alternative simulations for the project area were developed by the District. All of the parameters in GenCade must be fully calibrated to the study site as the simulation results of alternatives are limited to the initial parameterization of the model. The final product of this study will include modeling results from the calibration period simulation and a set of 9 alternatives. | The main objective of this study is to provide the New York District with a calibrated GenCade model representing several engineering alternatives to the present layout of Point Lookout. A set of existing condition and alternative simulations for the project area were developed by the District. All of the parameters in GenCade must be fully calibrated to the study site as the simulation results of alternatives are limited to the initial parameterization of the model. The final product of this study will include modeling results from the calibration period simulation and a set of 9 alternatives. | ||
[[Image:GenCade3.png|thumb| | [[Image:GenCade3.png|thumb|350px|Fig. 3. Project area of the Long Beach Island Storm Damage Reduction Plan. The four New Groins and existing groins located along Point Lookout are evaluated in this study.]] | ||
Alternative simulations are run with the same parameters, waves, and overall shoreline and structural setup except for slight modifications. The New York Districts’ Storm Damage Reduction Plan for the next 50 years proposed long | Alternative simulations are run with the same parameters, waves, and overall shoreline and structural setup except for slight modifications. The New York Districts’ Storm Damage Reduction Plan for the next 50 years proposed long | ||
- | - | ||
| Line 87: | Line 87: | ||
* A) Existing Condition[[Image:GenCade4.png|thumb| | * A) Existing Condition[[Image:GenCade4.png|thumb|thumbpx|Fig. 4. Alternative grids including the Existing Condition (A 1-3), 2 Full-length Groins (B 1,2), two Short-length Groins (B 3,4), and four Full-length Groins (C 1,2).]] | ||
| Line 99: | Line 99: | ||
* B) Two Additional Groins[[Image:GenCade5.png|thumb| | * B) Two Additional Groins[[Image:GenCade5.png|thumb|300px|Fig. 5. Example of GenCade grid showing A) the present terminal groin length, and B) the proposed 100-ft extension.]] | ||
| Line 114: | Line 114: | ||
* C) Four Additional Groins[[Image:GenCade6.png|thumb| | * C) Four Additional Groins[[Image:GenCade6.png|thumb|300px|Fig. 6. Alternative grids for the T-groin alternatives C3, C4, C5 & C6.]] | ||
| Line 130: | Line 130: | ||
The model control parameters set for sediment transport and morphology of the beach include Effective Grain Size, Average Berm Height, Closure Depth, and the Longshore Sand Transport Calibration Coefficients. The grain size, berm height, and closure depth all define the representative beach profile and the active zone of transport. The average sediment grain size for the area is between 0.21 and 0.22 mm (USACE 2006), and the sand size of 0.22 mm was chosen as the constant grain size for the entire domain. Beach profiles surveyed along Point Lookout and Hempstead Beach were analyzed to find an average berm height of 10 ft (msl) and closure depth of 11 ft (msl). Note that the chosen closure depth represents the beach profiles of interest in the vicinity of the project site and do not represent the regional trend with is typically much deeper (~20 | The model control parameters set for sediment transport and morphology of the beach include Effective Grain Size, Average Berm Height, Closure Depth, and the Longshore Sand Transport Calibration Coefficients. The grain size, berm height, and closure depth all define the representative beach profile and the active zone of transport. The average sediment grain size for the area is between 0.21 and 0.22 mm (USACE 2006), and the sand size of 0.22 mm was chosen as the constant grain size for the entire domain. Beach profiles surveyed along Point Lookout and Hempstead Beach were analyzed to find an average berm height of 10 ft (msl) and closure depth of 11 ft (msl). Note that the chosen closure depth represents the beach profiles of interest in the vicinity of the project site and do not represent the regional trend with is typically much deeper (~20 | ||
- | - | ||
28 ft deep). The default for the Longshore Sand Transport Calibration Coefficients is 0.5 for | 28 ft deep). The default for the Longshore Sand Transport Calibration Coefficients is 0.5 for K1and 0.25 for K2. These are adjusted during model calibration. | ||
GenCade is entirely driven by waves. The waves used in this study are from the Wave Information Study (WIS), which are a set of hindcast waves developed by the U.S. Army Engineer Research and Development Center ( | GenCade is entirely driven by waves. The waves used in this study are from the Wave Information Study (WIS), which are a set of hindcast waves developed by the U.S. Army Engineer Research and Development Center ( | ||
| Line 146: | Line 146: | ||
area overall shoreline response. Offshore wave contours along this stretch of coast are relatively uniform, with minor variations due to the presence of obliquely | area overall shoreline response. Offshore wave contours along this stretch of coast are relatively uniform, with minor variations due to the presence of obliquely | ||
- | - | ||
oriented offshore shoals. For the production runs, the contour largely followed the shape of | oriented offshore shoals. For the production runs, the contour largely followed the shape of theislands following a nearshore depth contour similar to the 20 | ||
- | - | ||
or 30 | |||
- | - | ||
ft depth contour. For the calibration runs, the regional contour had a slightly different configuration from the alternative simulations in order to represent the development of morphologic features through the contour such as the ebb | ft depth contour. For the calibration runs, the regional contour had a slightly different configuration from the alternative simulations in order to represent the development of morphologic features through the contour such as the ebb | ||
| Line 156: | Line 156: | ||
Inlet processes are represented in the Inlet Reservoir Model (IRM) (Kraus 2000), which is a subroutine in GenCade. The IRM starts where an inlet is designated along the 1 | Inlet processes are represented in the Inlet Reservoir Model (IRM) (Kraus 2000), which is a subroutine in GenCade. The IRM starts where an inlet is designated along the 1 | ||
- | - | ||
D grid and takes in to account the incoming sediment in to the morphologic reservoirs. Inlet shoal volumes (representative of morphologic features), which include the initial and equilibrium volumes, distribute sediment quantities through algorithms between the interconnected features. The sediment that is not stored in the inlet morphologic feature is bypassed updrift or downdrift of the inlet. As a part of the IRM, dredged quantities of these shoals can also be calculated through time, and therefore were included in the model. | D grid and takes in to account the incoming sediment in to the morphologic reservoirs. Inlet shoal volumes (representative of morphologic features), which include the initial and equilibrium volumes, distribute sediment quantities through algorithms between the interconnected features. The sediment that is not stored in the inlet morphologic feature is bypassed updrift or downdrift of the inlet. As a part of the IRM, dredged quantities of these shoals can also be calculated through time,and therefore were included in the model. | ||
In addition to the modified engineering structures (mainly groins) included in the model grid, other engineering activities such as beach fills were included in the modeled simulations. The New York District has been practicing regional sediment management in the form of beneficial use of dredged materials from the Jones Inlet Navigation Project. Five dredged material placements occurred over the modeled calibration time periods between 1980 and 1999. GenCade has the capability to remove the dredged quantities from Jones Inlet and place a specified berm width over a designated beach fill area and can do so over the time period that each dredging and placement occurred. | In addition to the modified engineering structures (mainly groins) included in the model grid, other engineering activities such as beach fills were included in the modeled simulations. The New York District has been practicing regional sediment management in the form of beneficial use of dredged materials from the Jones Inlet Navigation Project. Five dredged material placements occurred over the modeled calibration time periods between 1980 and 1999. GenCade has the capability to remove the dredged quantities from Jones Inlet and place a specified berm width over a designated beach fill area and can do so over the time period that each dredging and placement occurred. | ||
== Calibration == | == Calibration == | ||
The calibration of GenCade began with developing a model setup that produced the measured net transport rates (USACE 2008), for the Point Lookout area, in the range of 150,000 to 200,000 cy/year to the west. As suggested in the Genesis User’s Manual (Gravens et al. 1991): Calibration refers to the procedure of determining values of adjustable coefficients that allow the model to reproduce changes in shoreline position measured over a certain time interval. The first step in the calibration procedure is to determine K1 by reproducing referenced transport rates along the grid. Next, K1 may be further modified in order to match with measured shoreline change. Finally, some adjustment of the K2 coefficient should modify the shoreline change downdrift of structures. When modeling precise shoreline change around a groin or structure, the K1 value should be adjusted to reproduce shoreline change updrift of the groin, and then the K2 value should then be adjusted to reproduce the downdrift shoreline change. | The calibration of GenCade began with developing a model setup that produced the measured net transport rates (USACE 2008), for the Point Lookout area, in the range of 150,000 to 200,000 cy/year to the west. As suggested in the Genesis User’s Manual (Gravens et al. 1991): Calibration refers to the procedure of determining values of adjustable coefficients that allow the model to reproduce changes in shoreline position measured over a certain time interval. The first step in the calibration procedure is to determine K1 by reproducing referenced transport rates along the grid. Next, K1 may be further modified in order to match with measured shoreline change. Finally, some adjustment of the K2 coefficient should modify the shoreline change downdrift of structures. When modeling precise shoreline change around a groin or structure, the K1 value should be adjusted to reproduce shoreline change updrift of the groin, and then the K2 value should then be adjusted to reproduce the downdrift shoreline change. | ||
Sediment transport rates in GenCade are largely controlled by input wave parameters and the longshore sediment transport coefficients K1 and K2. Initial calibration by waves was conducted through modeling the 20 years of WIS hindcast waves to reproduce the general variation in transport magnitudes. Values of 0.4 and 0.25, for K1 and K2 respectively, were found to best represent the average transport rate reported by the New York District (USACE 2008). Modeled transport values fromthe calibration run are given in Figure 7. | Sediment transport rates in GenCade are largely controlled by input wave parameters and the longshore sediment transport coefficients K1 and K2. Initial calibration by waves was conducted through modeling the 20 years of WIS hindcast waves to reproduce the general variation in transport magnitudes. Values of 0.4 and 0.25, for K1 and K2 respectively, were found to best represent the average transport rate reported by the New York District (USACE 2008). Modeled transport values fromthe calibration run are given in Figure 7. | ||
[[Image:GenCade7.png|thumb|widthpx|Fig. 7. Calculated mean net transport across the study area for the calibration period.]] | |||
<br style="clear:both" /> | |||
Following the initial determination of transport magnitude, the wave input to the model was modified for the isolated beaches located behind the ebb | Following the initial determination of transport magnitude, the wave input to the model was modified for the isolated beaches located behind the ebb | ||
- | - | ||
tidal delta. Waves in this region are modified by sheltering of the shoal, and also from the eastern quadrant (90 to 160 deg) due to sheltering by the east jetty of Jones Inlet. A wave angle and height reduction was applied to account for this sheltering. This in turn directly modifies the sediment transport and is illustrated in Figure 7 in the decrease between the inlet and the attachment point. | tidal delta. Waves in this region are modified by sheltering of the shoal, and also from the eastern quadrant (90 to 160 deg) due to sheltering by the east jetty of Jones Inlet. A wave angle and height reduction was applied to account for this sheltering. This in turn directly modifies the sediment transport and is illustrated in Figure 7 in the decrease between the inlet and the attachment point. | ||
The regional contour was tested initially to calibrate to shoreline response. Calibration of groins also had significant control of the shoreline response to transported sand. Permeabilities of existing groins for the calibration period were 30 | The regional contour was tested initially to calibrate to shoreline response. Calibration of groins also had significant control of the shoreline response to transported sand. Permeabilities of existing groins for the calibration period were 30 | ||
- | - | ||
| Line 181: | Line 177: | ||
year simulation form 1980 | year simulation form 1980 | ||
- | - | ||
1999. | 1999. Figure 8 is a plot of measured shoreline change rates from 1978 to 1991. | ||
[[Image:GenCade8.png|thumb|widthpx|Fig. 8. Measured shoreline change rates from 1978 to 1991. Note that Point Lookout Beach is largely erosional in comparison to Lido Beach which is accretionary due to the growing bypassing and attachment to the shoreline.]] | |||
<br style="clear:both" /> | |||
A comparison of shorelines from 1991, 1994, and 1996 are given in Figure 9.[[Image:GenCade9.png|thumb|widthpx|Fig. 9. Comparison of shoreline locations for the calibration period.]] | |||
<br style="clear:both" /> | |||
Shoreline accretion rates in model compared to the measured show significant variance from year toyear, but have averaged values similar to those measured (Figure 10).[[Image:GenCade10.png|thumb|widthpx|Fig. 10. Calculated shoreline change rates for the calibration period.]] | |||
<br style="clear:both" /> | |||
Seaward advancement of theprofile over the location of the attachment point was attained, with shoreline change rates of +12to +23 ft/year and an average advance rate of 20 ft/year. Point Lookout shoreline change, following the historical beach nourishments, was reproduced accurately in shape and location due in large part to the calibration of the groin permeability. Shoreline change here was modeled to erode at 5 | |||
-10 ft/year, including the presence of the additional historic beach nourishments. | -10 ft/year, including the presence of the additional historic beach nourishments. | ||
| Line 196: | Line 197: | ||
== Evaluation of Alternatives == | == Evaluation of Alternatives == | ||
Modeling results of the 50 year projection into the future for existing and alternative conditionsprovided insight and a greater contrast of the potential of each type of modification. The domaincoverage in GenCade captures the appropriate length of shoreline and broad | |||
[[Image:GenCade11.png|thumb|150px|Fig. 11. Final shorelines model results for the existing condition alternative A1 that has no action. (Top: Full grid; Bottom: Zoom to Point Lookout.)]] | |||
scale variance of shoreline orientation from the updrift Jones Beach to the downdrift Long Beach groin fields. Transport rates are similar or equal along the model boundaries for the existing condition and all other alternatives. This consistency illustrates that sediment moving in to and out of the system is modeled as compatible with present conditions. Also, that there are no greatimpoundments of sand correlates to a comparable transport rate for each engineering alternativeThe existing condition alternative simulation, with no remediation action, is shown in Figure 11,at the end of the 50 year run. Persistent erosion occurs west of the third groin and the unmitigated permeability of groins one and two induce increased erosion of the groin cells. The modified existing condition alternatives A2 and A3 include the rehabilitation of the three groins (decreased permeability in GenCade to 10%) and show greater sand retention and less synchronized shorelinechange (Figure 12)..[[Image:GenCade12.png|thumb|150px|Fig. 12. Final Shorelines for existing condition alternatives A2 and A3. A) A2 includes the 110-ft wide berm at 5-year intervals. B) B1 includes the 110-ft wide berm at 5-year intervals with the terminal groin extended 100 ft.]] | |||
<br style="clear:both" /> | |||
scale variance of shoreline orientation from the updrift Jones Beach to the downdrift Long Beach groin fields. Transport rates are similar or equal along the model boundaries for the existing condition and all other alternatives. This consistency illustrates that sediment moving in to and out of the system is modeled as compatible with present conditions. Also, that there are no | |||
year run. Persistent erosion occurs west of the third groin and the unmitigated permeability of groins one and two induce increased erosion of the groin cells. The modified existing condition alternatives A2 and A3 include the rehabilitation of the three groins (decreased permeability in GenCade to 10%) and show greater sand retention and less synchronized | |||
[[Image: | |||
Results of shoreline change for two additional groins are illustrated in Figures 13 and 14 for full | Results of shoreline change for two additional groins are illustrated in Figures 13 and 14 for full | ||
length (B1 and B2) and shortened groins (B3 and B4), respectively. The right (longer) groin has the greatest effect on shoreline position, with the shorter left groin providing some shoreline location stability. Little difference in shoreline position is found between the full length and shortened groins. | |||
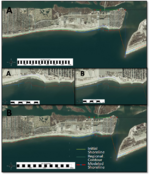
[[Image:GenCade13.png|thumb|150px|Fig. 13. Final Shorelines for B1 and B2 alternatives. A) B1 includes the 110-ft wide berm at 5-year intervals with two full-length groins. B) B1 includes the 110-ft wide berm at 5-year intervals with two full-length groins and the terminal groin extended 100 ft.]] | |||
length (B1 and B2) and shortened groins (B3 and B4), respectively. The right (longer) groin has the greatest effect on shoreline position, with the shorter left groin providing some shoreline location stability. Little difference in shoreline position is found between the full length and shortened groins. However, results of four additional groins for alternatives C1 and C2 (shown in Figure 15) show greater shoreline accretion across Hempstead Beach, providing | <br style="clear:both" /> | ||
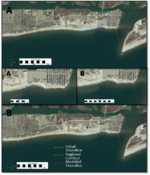
[[Image:GenCade14.png|thumb|150px|Fig. 14. Final Shorelines for B3 and B4 alternatives. A) B3 includes the 110-ft wide berm at 5-year intervals with two short-length groins. B) B4 includes the 110-ft wide berm at 5-year intervals with two short-length groins and the terminal groin extended 100 ft.]] | |||
[[Image:GenCade15.png|thumb|150px | <br style="clear:both" /> | ||
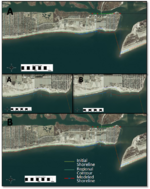
However, results of four additional groins for alternatives C1 and C2 (shown in Figure 15) show greater shoreline accretion across Hempstead Beach, providing longterm stability for the erosionhotspot as compared to two groins.[[Image:GenCade15.png|thumb|150px|Fig. 15. Final Shorelines for C1 and C2 alternatives. A) C1 includes the 110-ft wide berm at 5-year intervals with four full-length groins. B) C2 includes the 110-ft wide berm at 5-year intervals with four full-length groins and the terminal groin extended 100 ft]] | |||
<br style="clear:both" /> | |||
Extension of the terminal groin provides additional sand retention under proposed nourishments. | Extension of the terminal groin provides additional sand retention under proposed nourishments.Though shoreline change does not show a great difference, retention of sand from the extension is noted as a decrease eastward bypassing back in to the inlet around the terminal groin. Representation of reoccurring nourishments was essential to project success. A nourishment interval of 5 years is effective at shoreline stabilization without structure modification. | ||
Of the alternatives evaluated, Alternative A2 and A3 provided mitigation for the shoreline erosion occurring along Point Lookout and Hempstead beaches. This alternative provided shoreline stabilization, however did not mitigate for other storm protection parameters such as a consistent berm width for dune to grow upon. Alternatives B3 and B4 proved to have the greatest longevity and least cost of all alternatives involving structure modification and addition. Though the extension of the terminal groin does not hold a greater volume of sand, this structural enhancement does improve functionality of the structure in the lee of large | Of the alternatives evaluated, Alternative A2 and A3 provided mitigation for the shoreline erosion occurring along Point Lookout and Hempstead beaches. This alternative provided shoreline stabilization, however did not mitigate for other storm protection parameters such as a consistent berm width for dune to grow upon. Alternatives B3 and B4 proved to have the greatest longevity and least cost of all alternatives involving structure modification and addition. Though the extension of the terminal groin does not hold a greater volume of sand, this structural enhancement does improve functionality of the structure in the lee of large | ||
scale, inlet | scale, inlet | ||
- | - | ||
| Line 249: | Line 236: | ||
Structures spanning the erosional area were modeled and found to increase accretion along the shore, suggesting structures will best mitigate for erosion and provide the most shoreline stability. Each of the two | Structures spanning the erosional area were modeled and found to increase accretion along the shore, suggesting structures will best mitigate for erosion and provide the most shoreline stability. Each of the two | ||
- | - | ||
and four | |||
- | - | ||
additional groin alternatives predicted advancement of the shoreline toward the seaward ends of the groins. For these alternatives, each illustrated accretionary trends along the shoreline, however, with some displacement between the positions of shoreline from one groin compartment to the next. Finally, the terminal groin extension was found to have little effect on the shoreline location, but was effective in preventing some transport east, back in to the inlet channel. | additional groin alternatives predicted advancement of the shoreline toward the seaward ends of the groins. For these alternatives, each illustrated accretionary trends along the shoreline, however, with some displacement between the positions of shoreline from one groin compartment to the next. Finally, the terminal groin extension was found to have little effect on the shoreline location, but was effective in preventing some transport east, back in to the inlet channel. | ||
== References == | == References == | ||
Latest revision as of 14:29, 16 March 2011
Introduction and Study Overview
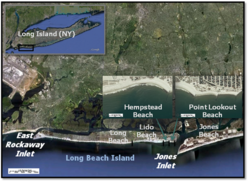
The U.S. Army Engineer District, New York, requested the Coastal Inlets Research Program (CIRP) and the Regional Sediment Management Program (RSMP) apply the shoreline change model, GenCade to Point Lookout Beach, located to the west of Jones Inlet on the south shore of Long Island, NY (Figure 1), as part of the Long Beach Island Storm Damage Reduction Project. GenCade is a new model that combines two numerical shoreline change models, the engineering detail of GENESIS (Hanson and Kraus 1989) and the long - term, regional transport processes of Cascade (Connell et al. 2007). GenCade was developed by the CIRP and the Regional Sediment Management Program. It is applied here to Point Lookout Beach to evaluate new alternatives involving local structures in the framework of a large - scale sediment management plan that includes the inlet and adjacent beaches.
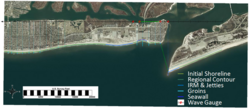
Point Lookout Beach is a small beach between two groins that are adjacent to the western terminal groin of Jones Inlet. A public park is located west of Point Lookout and is situated along Hempstead Beach, which is a chronically eroding beach, or erosional hotspot, with a crescentic shoreline. Both Point Lookout and Hempstead are considered part of an isolated beach (Hanson and Kraus 2001) because they are located in the lee of the Jones Inlet ebb - tidal delta. Lido Beach stretches from the western end of Hempstead Beach toward the central part of Long Beach Island. The attachment bar from the ebb - tidal delta is located at the eastern end of Lido Beach, which is largely accretionary. Lido Beach then transitions to a regularly spaced groin field that extends west toward Long Beach. The Point Lookout GenCade grid covers this eastern half of Long Beach Island and 7,000 ft of shoreline along Jones Beach (located on the eastern side of Jones Inlet). The entire grid length is 30,000 ft, or 5.15 miles (Figure 2).
The littoral processes in this system are complicated, and longshore sediment transport exhibits variable gradients which are the result of inlet processes, structures, and large offsets in shoreline location and orientation. The regional net longshore sediment transport direction is from east to west (Panuzio 1968) with higher transport rates at Jones Beach grading down to lower values over Point Lookout, Hempstead, and Lido Beaches under sheltering from the ebb - tidal delta and structures such as the Jones Inlet east jetty. Historically, a greater variation than present - day dynamics was measured and is attributed largely to the development of the ebb - tidal delta since construction of the east Jones Inlet jetty in 1951 (U.S. Army Corps of Engineers (USACE) 1995). As the ebb - tidal delta grew towards equilibrium, bypassing from the updrift Jones Beach became more efficient, and sediment supply to Hempstead and Lido Beaches increased as is apparent in the present configuration of the bypassing attachment point, but isolating the beaches to the east.
An unavailable report prepared for the State of New York 2006 (Moffatt & Nichol 2006) developed a sediment budget based on shoreline change rates and potential sediment transport values. The report states that present - day net transport rates at Jones Beach are on the order of 600,000 cubic yards per year (cy/year), with approximately 480,000 cy/year bypassed to the downdrift Hempstead and Lido Beaches. This budget was included in a New York State report (State of New York 1998) citing net transport rates of 200,000 cy/year the west. In contrast to the potential transport rates calculated by Moffatt & Nichol, the New York District (USACE 2008) measured average channel infilling rates for Jones Inlet of approximately 200,000 cy/year to the west. Point Lookout Beach, which is sheltered by theJones Inlet ebb - tidal delta, had a much smaller net transport rate of 20,000 – 80,000 cy/year to the west. From these references, the variability in transport rate between the updrift Jones Beach and the Point Lookout and Hempstead beaches can be considered a ratio where the transport at these isolated beaches is only 10 - 40% of the magnitude of the up - drift beaches.
Using a regional - scale sediment transport model to simulate project level processes is challenging. The study area has various distinct morphologic features that are difficult to reproduce under assumption - based simplifications if certain processes are omitted or only schematically represented in a one - dimensional (1 - D) model such as GenCade. On the other hand, full multi - dimensional process models are not reliable for simulating long - term change. In particular, sediment transport at Point Lookout and Hempstead Beaches is highly controlled by the inlet processes acting upon the shoreline including flood marginal channels and large - scale eddies driven onshore from the ebbing and flooding currents. The application to this heavily engineered, short stretch of coast proved to be a unique test for GenCade, illustrating the capacity of the Genesis - type or 1 - D shoreline change calculations in the model.
Design guidance for long - term response to modification of the inlet jetties and adjacent groins is needed on a longer timescale than typical shoreline change engineering models can simulate for regional sediment management. In addition to shoreline change processes, there existed a need to include large - scale inlet dynamics in the analysis. Coupling the inlet’s influence on local sediment transport solves a common issue with connecting beaches and inlets in a regional coverage and, therefore, this analysis will work within the framework of regional sediment management. This project leverages funding from the New York District, the CIRP, and the RSMP with a three - fold purpose: (1) Test consequences of different engineering alternatives along Point Lookout Beach; (2) test and improve modeling methodology for long - term shoreline change models that include engineering structures; and (3) develop long - term shoreline change modeling guidance for District offices.
Modeling Objectives
The main objective of this study is to provide the New York District with a calibrated GenCade model representing several engineering alternatives to the present layout of Point Lookout. A set of existing condition and alternative simulations for the project area were developed by the District. All of the parameters in GenCade must be fully calibrated to the study site as the simulation results of alternatives are limited to the initial parameterization of the model. The final product of this study will include modeling results from the calibration period simulation and a set of 9 alternatives.
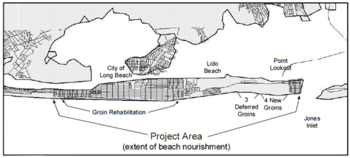
Alternative simulations are run with the same parameters, waves, and overall shoreline and structural setup except for slight modifications. The New York Districts’ Storm Damage Reduction Plan for the next 50 years proposed long - term activities in addition to several potential modifications to structures (Figure 3). The proposed structures are illustrated in the GenCade alternatives given in Figures 4, 5, and 6. A sand placement, with a 110 - ft wide berm, is proposed to occur on a 5 year interval, coinciding with reoccurring dredging of the sand material from the Jones Inlet Navigation Project. These two activities are to be modeled under the proposed structure modifications as listed below.
Alternatives
- A) Existing Condition
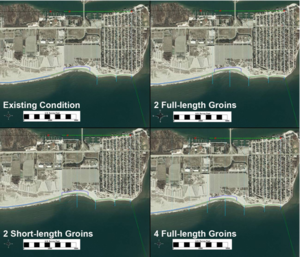
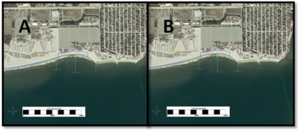
Fig. 4. Alternative grids including the Existing Condition (A 1-3), 2 Full-length Groins (B 1,2), two Short-length Groins (B 3,4), and four Full-length Groins (C 1,2).
- 1) No action (no nourishments or inlet processes included). No structures.
- 2) Proposed nourishment with a 110-ft berm width occurring at 5-year intervals. No structures.
- 3) Proposed nourishment with a 110-ft berm width occurring at 5-year intervals and a terminal groin extension of 100 ft.
- B) Two Additional Groins
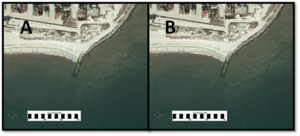
Fig. 5. Example of GenCade grid showing A) the present terminal groin length, and B) the proposed 100-ft extension.
- 1) Proposed nourishment with a 110-ft berm width occurring at 5-year intervals. The first two proposed new groins are included at full length.
- 2) Proposed nourishment with a 110-ft berm width occurring at 5-year intervals and a terminal groin extension of 100 ft. The first two proposed new groins are included at full length.
- 3) Proposed nourishment with a 110-ft berm width occurring at 5- year intervals. The first two proposed new groins are included at a shortened length.
- 4) Proposed nourishment with a 110-ft berm width occurring at 5-year intervals and a terminal groin extension of 100 ft. The first two proposed new groins are included at a shortened length.
- 1) Proposed nourishment with a 110-ft berm width occurring at 5-year intervals. The complete four proposed new groins are included at full length.
- 2) Proposed nourishment with a 110-ft berm width occurring at 5-year intervals and a terminal groin extension of 100 ft. The complete four proposed new groins are included at full length.
GenCade Setup
The design of the GenCade grid for Point Lookout, which has a small domain, was set to capture all processes judged to be relevant that act on the several - mile long shore of interest. Because Point Lookout and adjacent beaches are within direct influence of Jones Inlet, the Inlet Reservoir Model (Kraus 2000) within GenCade was set up to incorporate major inlet processes. Through including Jones Inlet, the domain for the project area was set to cover 1 mile of shoreline to the east of the inlet and 4 miles of shoreline to the west.
The model control parameters set for sediment transport and morphology of the beach include Effective Grain Size, Average Berm Height, Closure Depth, and the Longshore Sand Transport Calibration Coefficients. The grain size, berm height, and closure depth all define the representative beach profile and the active zone of transport. The average sediment grain size for the area is between 0.21 and 0.22 mm (USACE 2006), and the sand size of 0.22 mm was chosen as the constant grain size for the entire domain. Beach profiles surveyed along Point Lookout and Hempstead Beach were analyzed to find an average berm height of 10 ft (msl) and closure depth of 11 ft (msl). Note that the chosen closure depth represents the beach profiles of interest in the vicinity of the project site and do not represent the regional trend with is typically much deeper (~20 - 28 ft deep). The default for the Longshore Sand Transport Calibration Coefficients is 0.5 for K1and 0.25 for K2. These are adjusted during model calibration.
GenCade is entirely driven by waves. The waves used in this study are from the Wave Information Study (WIS), which are a set of hindcast waves developed by the U.S. Army Engineer Research and Development Center ( http://chl.erdc.usace.army.mil/wis) . This dataset has a large spatial coverage, with the hindcast station locations nearer to the shoreline than any nearby National Oceanic and Atmospheric Administration (NOAA) wave buoys. The station chosen for this study is 126, located at 40.41654 Latitude and - 73.83347 Longitude, in 70 ft water depth 11 miles offshore. The nearest NOAA wave buoy is approximately 40 miles to the southeast and is not applicable to this study site. The WIS waves, spanning 20 years from 1980 - 1999, were applied in the calibration. The 20 years were duplicated to produce a 50 - year dataset to run the full simulations following calibration.
The regional contour in GenCade defines how waves are transformed to the shoreline (including wave refraction) and acts as a representative average offshore contour that controls wide - area overall shoreline response. Offshore wave contours along this stretch of coast are relatively uniform, with minor variations due to the presence of obliquely - oriented offshore shoals. For the production runs, the contour largely followed the shape of theislands following a nearshore depth contour similar to the 20 - or 30 - ft depth contour. For the calibration runs, the regional contour had a slightly different configuration from the alternative simulations in order to represent the development of morphologic features through the contour such as the ebb - tidal delta’s attachment point.
Inlet processes are represented in the Inlet Reservoir Model (IRM) (Kraus 2000), which is a subroutine in GenCade. The IRM starts where an inlet is designated along the 1 - D grid and takes in to account the incoming sediment in to the morphologic reservoirs. Inlet shoal volumes (representative of morphologic features), which include the initial and equilibrium volumes, distribute sediment quantities through algorithms between the interconnected features. The sediment that is not stored in the inlet morphologic feature is bypassed updrift or downdrift of the inlet. As a part of the IRM, dredged quantities of these shoals can also be calculated through time,and therefore were included in the model.
In addition to the modified engineering structures (mainly groins) included in the model grid, other engineering activities such as beach fills were included in the modeled simulations. The New York District has been practicing regional sediment management in the form of beneficial use of dredged materials from the Jones Inlet Navigation Project. Five dredged material placements occurred over the modeled calibration time periods between 1980 and 1999. GenCade has the capability to remove the dredged quantities from Jones Inlet and place a specified berm width over a designated beach fill area and can do so over the time period that each dredging and placement occurred.
Calibration
The calibration of GenCade began with developing a model setup that produced the measured net transport rates (USACE 2008), for the Point Lookout area, in the range of 150,000 to 200,000 cy/year to the west. As suggested in the Genesis User’s Manual (Gravens et al. 1991): Calibration refers to the procedure of determining values of adjustable coefficients that allow the model to reproduce changes in shoreline position measured over a certain time interval. The first step in the calibration procedure is to determine K1 by reproducing referenced transport rates along the grid. Next, K1 may be further modified in order to match with measured shoreline change. Finally, some adjustment of the K2 coefficient should modify the shoreline change downdrift of structures. When modeling precise shoreline change around a groin or structure, the K1 value should be adjusted to reproduce shoreline change updrift of the groin, and then the K2 value should then be adjusted to reproduce the downdrift shoreline change.
Sediment transport rates in GenCade are largely controlled by input wave parameters and the longshore sediment transport coefficients K1 and K2. Initial calibration by waves was conducted through modeling the 20 years of WIS hindcast waves to reproduce the general variation in transport magnitudes. Values of 0.4 and 0.25, for K1 and K2 respectively, were found to best represent the average transport rate reported by the New York District (USACE 2008). Modeled transport values fromthe calibration run are given in Figure 7.
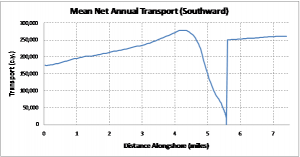
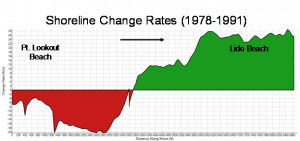
Following the initial determination of transport magnitude, the wave input to the model was modified for the isolated beaches located behind the ebb - tidal delta. Waves in this region are modified by sheltering of the shoal, and also from the eastern quadrant (90 to 160 deg) due to sheltering by the east jetty of Jones Inlet. A wave angle and height reduction was applied to account for this sheltering. This in turn directly modifies the sediment transport and is illustrated in Figure 7 in the decrease between the inlet and the attachment point. The regional contour was tested initially to calibrate to shoreline response. Calibration of groins also had significant control of the shoreline response to transported sand. Permeabilities of existing groins for the calibration period were 30 - 40%. Measured shorelines were compared throughout the 20 - year simulation form 1980 - 1999. Figure 8 is a plot of measured shoreline change rates from 1978 to 1991.
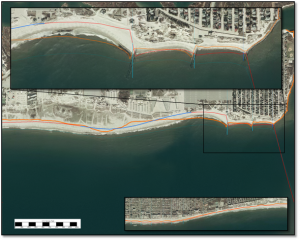
A comparison of shorelines from 1991, 1994, and 1996 are given in Figure 9.
Shoreline accretion rates in model compared to the measured show significant variance from year toyear, but have averaged values similar to those measured (Figure 10).
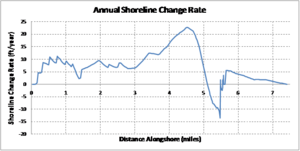
Seaward advancement of theprofile over the location of the attachment point was attained, with shoreline change rates of +12to +23 ft/year and an average advance rate of 20 ft/year. Point Lookout shoreline change, following the historical beach nourishments, was reproduced accurately in shape and location due in large part to the calibration of the groin permeability. Shoreline change here was modeled to erode at 5 -10 ft/year, including the presence of the additional historic beach nourishments.
Overall, the calibration to transport rates and directions, shoreline change rates, and general geomorphic response was successful. Sensitivities found in GenCade proved to be connected to known, large - scale events, typically beach nourishments. The most significant natural, or non - anthropogenic, event included in the model was the reproduction of the growth of the attachment location of the ebb - tidal delta of Jones Inlet. With some sensitivity tests to the location of sedimentation from the attachment point, and to the wave refraction over the regional contour, GenCade produced the shape and gradient of the attachment point in the shoreline.
Evaluation of Alternatives
Modeling results of the 50 year projection into the future for existing and alternative conditionsprovided insight and a greater contrast of the potential of each type of modification. The domaincoverage in GenCade captures the appropriate length of shoreline and broad
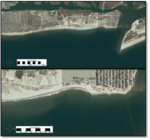
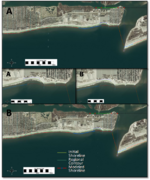
scale variance of shoreline orientation from the updrift Jones Beach to the downdrift Long Beach groin fields. Transport rates are similar or equal along the model boundaries for the existing condition and all other alternatives. This consistency illustrates that sediment moving in to and out of the system is modeled as compatible with present conditions. Also, that there are no greatimpoundments of sand correlates to a comparable transport rate for each engineering alternativeThe existing condition alternative simulation, with no remediation action, is shown in Figure 11,at the end of the 50 year run. Persistent erosion occurs west of the third groin and the unmitigated permeability of groins one and two induce increased erosion of the groin cells. The modified existing condition alternatives A2 and A3 include the rehabilitation of the three groins (decreased permeability in GenCade to 10%) and show greater sand retention and less synchronized shorelinechange (Figure 12)..
Results of shoreline change for two additional groins are illustrated in Figures 13 and 14 for full
length (B1 and B2) and shortened groins (B3 and B4), respectively. The right (longer) groin has the greatest effect on shoreline position, with the shorter left groin providing some shoreline location stability. Little difference in shoreline position is found between the full length and shortened groins.
However, results of four additional groins for alternatives C1 and C2 (shown in Figure 15) show greater shoreline accretion across Hempstead Beach, providing longterm stability for the erosionhotspot as compared to two groins.
Extension of the terminal groin provides additional sand retention under proposed nourishments.Though shoreline change does not show a great difference, retention of sand from the extension is noted as a decrease eastward bypassing back in to the inlet around the terminal groin. Representation of reoccurring nourishments was essential to project success. A nourishment interval of 5 years is effective at shoreline stabilization without structure modification.
Of the alternatives evaluated, Alternative A2 and A3 provided mitigation for the shoreline erosion occurring along Point Lookout and Hempstead beaches. This alternative provided shoreline stabilization, however did not mitigate for other storm protection parameters such as a consistent berm width for dune to grow upon. Alternatives B3 and B4 proved to have the greatest longevity and least cost of all alternatives involving structure modification and addition. Though the extension of the terminal groin does not hold a greater volume of sand, this structural enhancement does improve functionality of the structure in the lee of large
scale, inlet
-
generated eddies. Because little difference was found between the full
-
length and short
-
length two additional groins, B3 or B4 are recommended to the district as best alternatives.
Conclusions
GenCade was successful in evaluating long - term effects to the shoreline under the influence of incipient waves for the 50 - year planning period of the Storm Damage Reduction (SDR) Project at Point Lookout. Inlet bypassing processes were included in the simulation to represent sediment transport around Jones Inlet, including the inlet bypassing capacity to provide material to the downdrift Lido Beach.
The modeled calibration period results showed good correspondence with transport rates and general trends of shoreline change and position. Modeled erosion rates along the domain show similar variance as compared to Figure 8, where shoreline change rates of recession of 15 to 20 ft/yr in Point Lookout transform to a shoreline advance rate of 25 ft/yr in Lido Beach.
Long - term stability of shoreline at the erosional hotspot can be mitigated with frequent nourishments. However, nourishment alone may not account for necessary berm width required for the SDR Project. Model results show shore stability only if nourishment is provided. Berm width is a criterion for dune development, which is another method of storm protection. Because the ‘nourishment only’ option only maintains shoreline location, which does not provide appropriate berm width, this may not be a viable option for the long term storm protection.
Structures spanning the erosional area were modeled and found to increase accretion along the shore, suggesting structures will best mitigate for erosion and provide the most shoreline stability. Each of the two - and four - additional groin alternatives predicted advancement of the shoreline toward the seaward ends of the groins. For these alternatives, each illustrated accretionary trends along the shoreline, however, with some displacement between the positions of shoreline from one groin compartment to the next. Finally, the terminal groin extension was found to have little effect on the shoreline location, but was effective in preventing some transport east, back in to the inlet channel.
References
Connell, K. J., Larson, M., and Kraus, N. C. 2007 Morphologic Modeling of Multiple Barrier Island Breaches for Regional Application. Proceedings Coastal Sediments '07 Conference, ASCE Press, 2011 - 2073.
Gravens, M. B., Kraus, N. C., and Hanson, H. 1991. GENESIS: Generalized Model for Simulating Shoreline Change. Report 2: Workbook and System User's Manual, Technical Report CERC - 89 - 19, U.S. Army Engineer Waterways Experiment Station, Coastal Engineering Research Center, Vicksburg, MS.
Hanson, H., and Kraus, N.C. 1989. GENESIS: Generalized Model for Simulating Shoreline Change. Report 1: Technical Reference, Technical Report CERC - 89 - 19, U.S. Army Engineer Waterways Experiment Station, Coastal Engineering Research Center, Vicksburg, MS.
Hanson, H., and Kraus, N.C., 2001. Chronic beach erosion adjacent to inlets and remediation by composite (T - head) groins. Coastal Engineering Technical Note CHETN - IV - 36, U.S. Army Engineer Research and Development Center, Vicksburg, MS.
Kraus, N.C. 2000. Reservoir Model of Ebb - Tidal Shoal Evolution and Sand Bypassing. Journal Waterway, Port, Coastal, and Ocean Engineering 126(3), 305 - 313.
Moffatt & Nichol, 2006. Unavailable document.
State of New York, Department of State, 1998. Sand Bypassing Plan: Jones Inlet, New York, (Draft) Panuzio, F.L. 1968. The Atlantic coast of Long Island. Proceedings 11th Coastal Engineering Conference, ASCE Press, 1222 - 1241.
U.S. Army Corps of Engineers, April 1992. Section 933 Evaluation Report: Jones Inlet, New York., New York: New York District.
U.S. Army Corps of Engineers, 1995 (Revised 2006). Limited Reevaluation report. Long Beach Island, New York: Feasibility Report. U.S. Army Engineer District, New York, NY.U.S. Army Engineer District.
U.S. Army Corps of Engineers, 2008. Terminal Groin Rehabilitation and Extension at Jones Inlet, Long Beach Island. Final Report. New York District.
