Morphology Change Validation of Shark River Inlet: Difference between revisions
No edit summary |
|||
| (66 intermediate revisions by 2 users not shown) | |||
| Line 1: | Line 1: | ||
<big> | <big> | ||
__NOTOC__ | __NOTOC__ | ||
[[Image:Validation_SRI_-_Study_Area_Figure.jpg|thumb|right|350px|Figure 1. Shark River Inlet study area.]] | |||
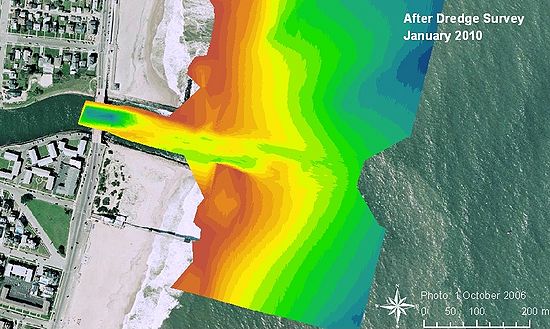
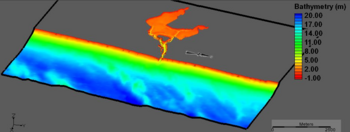
Shark River Inlet, located on the north New Jersey coast (Figure 1), is served by a federal navigation channel that has until recently required little maintenance dredging. Although possessing a small estuary, the inlet is hydraulically efficient because of the small width to depth ratio of its entrance that is stabilized by parallel jetties. After placement of approximately 4.8 million cubic meters of beach nourishment to the north and south of the inlet as part of an erosion-control project conducted in the late 1990s, inlet maintenance increased beyond that anticipated. Figure 2 illustrates a recent bathymetric survey from 2010. The Coastal Modeling System (CMS) was established to numerically simulate waves, current, sand transport, and morphology change. Figure 3 illustrates a 3-dimensional view of the modeling domain for Shark River inlet. Below describes the calibration and validation of water levels, current, and morphologic change. | |||
[[Image:Validation_SRI_-_Study_Area_Figure.jpg|thumb|right| | |||
Shark River Inlet, located on the north New Jersey coast, is served by a federal navigation channel that has until recently required little maintenance dredging. Although possessing a small estuary, the inlet is hydraulically efficient because of the small width to depth ratio of its entrance that is stabilized by parallel jetties. After placement of approximately 4.8 million cubic meters of beach nourishment to the north and south of the inlet as part of an erosion-control project conducted in the late 1990s, inlet maintenance increased beyond that anticipated. | |||
The Coastal Modeling System (CMS) was established to numerically simulate waves, current, sand transport, and morphology change. Below describes the calibration and validation of water levels, current, and morphologic change. | |||
[[Image:Validation_SRI_-_Jan09_Bathy.jpg|thumb|left|550px|Figure 2. January 2009 bathymetry survey of Shark River Inlet.]] | |||
[[Image:Validation_SRI_-_Full3d-grid.png|thumb|right|350px|Figure 3. CMS Grid Domain for Shark River Inlet.]] | |||
<br style="clear:both" /> | |||
== Model Setup and Calibration == | == Model Setup and Calibration == | ||
[[Image:Validation_SRI_-_Tele-full.png|thumb|left|300px|Figure 4. Telescoping flow grid for Shark River Inlet.]] | |||
[[Image:Validation_SRI_-_Tele-mid.png|thumb|right|250px|Figure 5. Zoom in of estuary and inlet.]] | |||
The Coastal Modeling System (CMS), a coupled numerical model of waves and finite-volume, depth-averaged circulation, sediment transport, and morphology change, was established for Shark River Inlet. Two CMS model grids were developed for representing Shark River Inlet, one refined, rectilinear grid for CMS-Wave and the other a telescoping, rectilinear grid for CMS-Flow and sand transport (Figures 4 through 6). The CMS was driven by tide and hindcast waves. The Lund-CIRP transport formula (Camenen and Larson 2007) was selected as the governing empirical equation to calculate bedload and suspended load within CMS-Flow for combined waves (breaking and non-breaking) and current. | |||
[[Image:Validation_SRI_-_Tele-close.png|thumb|right|250px|Figure 6. Zoom in of telescoping around inlet.]] | |||
A non-uniform sediment transport scheme was used in the CMS to represent the various grain sizes being transported and the significant impact of sediment hiding and exposure. Five different sediment grain sizes were defined based on the D50 (0.26 mm) in the grid. Including hiding and exposure of multiple grain size distributions reduced scour within the channel thalweg, and accurately represent the distribution of grains observed in this region. | |||
Bed change is calculated over the same sediment transport timestep, which was 900 seconds (15 minutes), and updated in both the wave and flow models. Bed change was updated in the wave model on the steering interval of 3 hours. | |||
An existing condition from a recent January 2009 bathymetry formed the basis to generate a grid for a contemporary representation of the inlet after dredging (Figure 6), and was used to calibrate the model. | |||
Calibration of the CMS for was completed in two parts: first, through comparison of measured and calculated hydrodynamics, and secondly through comparison of morphologic end-states through validating channel infilling rates and morphologic patterns. Observed water levels and measured current velocity in the Shark River estuary and inlet, collected on 20 August 2009, were used in the original hydrodynamic calibration (Beck and Kraus 2010). Beck and Kraus (2010) also compared measured and calculated current velocity at the centrally-located peak velocity in the three main channels (Figure 7). Measurements and calculations show close correspondence for the main channel (CS 1) and south channel (CS 3) with a Root Mean Absolute Error (RMAE) value of 3-5%, and an RMAE of 9 % for the north channel (CS2). | |||
<br style="clear:both" /> | |||
[[Image:Validation_SRI_-_Current.png|thumb|left|350px|Figure 7. Location of measured currents, 20 Aug 2009, Shark River Inlet. Comparison of calculated versus measured current magnitude are inset in the graph.]] | |||
Morphologic response was calibrated to the measured change from January 2009 to April 2009, a typical recent dredging interval, and served to verify channel cross-sections and infilling rates (Figure 8). Empirically derived coefficients for sediment transport were modified within the model to calibrate to sediment transport rates available for the region. The Lund-CIRP equations were calibrated to a specific equation, but allow for a range of coefficients between 0.5 and 2.0 for bedload and suspsended load transport. The model results for sediment transport are largely dependent on the wave forcing, and therefore the calculated morphology change will be driven by the quality of wave input. Because measured wave data is not available for the area, the WIS hindcast waves that were selected do not imitate the modeled time periods (January to April 2009), but they do represent an average January to April time period. Bedload and suspended load coefficients of 2.0 were found to better match estimated transport rates for Shark River Inlet. Table 1 lists the final sediment transport parameters determined for a calibrated model of Shark River Inlet. | |||
'''Table 1. Sediment transport and morphology parameters in the CMS''' | '''Table 1. Sediment transport and morphology parameters in the CMS''' | ||
| Line 38: | Line 36: | ||
| Sediment Transport Formula || Lund-CIRP | | Sediment Transport Formula || Lund-CIRP | ||
|- | |- | ||
| Bed Load Scaling Factor || | | Bed Load Scaling Factor || 2.0 | ||
|- | |- | ||
| Suspended Load Scaling Factor || | | Suspended Load Scaling Factor || 2.0 | ||
|- | |- | ||
| Sediment Porosity || 0.3 | | Sediment Porosity || 0.3 | ||
| Line 52: | Line 50: | ||
| Adaptation Length (m) || 100.0 | | Adaptation Length (m) || 100.0 | ||
|} | |} | ||
The Non-equilibrium Transport (NET) method also controls the capacity of sediment transport through scaling factors such as adaptation lengths or times, generally dependent upon length-scales of morphologic features such as bedforms or timescales of sediment movement. As a total load formulation is used with the NET, the Adaptation Length must be modified to calibrate to morphology. The Adaptation Length is a length scaling factor that is typically based on localized bedforms. The smaller the Adaptation Length, the closer the model is to Equilibrium Transport which results in greater rates of transport that is more localized. Adaptation Lengths tested included 1, 2, 3, 4, 5, 10, and 100 meters. An Adaptation Length of 100 m was selected for the entire domain of the final calculations because of the realistic patterns and volumetric changes observed in the calculations as compared to the measurements. Final parameter values were chosen to produce calibration of results to specific regions of interest, such as channel infilling in the dredged pit. | |||
= | <br style="clear:both" /> | ||
== Validation of Morphology Change == | |||
[[Image:Validation_SRI_-_Compare_Morph.png|thumb|right|450px|Figure 8. Location of measured currents, 20 Aug 2009, Shark River Inlet. Comparison of calculated versus measured current magnitude are inset in the graph.]] | |||
Morphologic response was calibrated to the measured change from January 2009 to April 2009, a typical recent dredging interval, and served to verify channel cross-sections and infilling rates (Figure 28). Based on the surveys, channel infilling volume expected for the 4-month simulation is 8,900 m<sup>3</sup> for the entrance channel alone. The 4-month simulation produced a similar channel infilling volume of 9,200 m<sup>3</sup> (RMAE of 3.4%) and morphologic patterns, as illustrated in Figure 8. A comparison of measured and calculated change along the transects in Figure 8 showed a high correlation with RMAE values of 7%, 11%, 2%, 4%, and 6% for Transects 1-5 (Figures 9 through 13) respectively. | |||
'''Table 2. Measured and calculated volume change for the dredged portion of Shark River Inlet''' | '''Table 2. Measured and calculated volume change for the dredged portion of Shark River Inlet''' | ||
| Line 67: | Line 64: | ||
! ''Dredged Channel'' | ! ''Dredged Channel'' | ||
|- | |- | ||
| Measured = 8,900 cy | | Measured = 8,900 cy | ||
|- | |- | ||
| Calculated = 9,200 cy | | Calculated = 9,200 cy | ||
|- | |- | ||
| 3.3 % Difference | | 3.3 % Difference | ||
|} | |} | ||
[[Image:Validation_SRI_-_Transect1.png|thumb|left|450px|Figure 9. Measured versus calculated bathymetric change arcoss Transect 1 (see Figure 8).]] | |||
[[Image:Validation_SRI_-_Transect2.png|thumb|left|450px|Figure 10. Measured versus calculated bathymetric change arcoss Transect 2 (see Figure 8).]] | |||
[[Image:Validation_SRI_-_Transect3.png|thumb|right|450px|Figure 11. Measured versus calculated bathymetric change arcoss Transect 3 (see Figure 8).]] | |||
<br style="clear:both" /> | |||
[[Image:Validation_SRI_-_Transect4.png|thumb|left|450px|Figure 12. Measured versus calculated bathymetric change arcoss Transect 4 (see Figure 8).]] | |||
[[Image:Validation_SRI_-_Transect5.png|thumb|right|450px|Figure 13. Measured versus calculated bathymetric change arcoss Transect 5 (see Figure 8).]] | |||
<br style="clear:both" /> | |||
[[Image:Validation_SRI_-_D50-2.png|thumb|right|400px|Figure 14. Calculated D50 from 4 month simulation.]] | |||
As a result of including nonuniform sediment transport, the grain size distributions are modified through the simulation. The model records the changing distribution through a D35, D50, and D90. D50 is given in Figure 14, and illustrates the modification of the median grain size from 4 months of simulated hiding and exposure and overall sediment transport. In areas that experienced the greatest velocities, the inlet throat and main channels, D50 values were highest at around 0.4-0.5 mm. This also included areas around structures, namely the groin fields and jetties. The smallest D50 values are found in areas of low energy or velocities, and tend to be at the distal end of channels. This distribution of sediment agrees with qualitative understanding that coarser sediment tends to remain in higher energy regions, whereas finer sediment is deposited in relatively quiescent areas. | |||
<br style="clear:both" /> | <br style="clear:both" /> | ||
| Line 86: | Line 91: | ||
<br style="clear:both" /> | <br style="clear:both" /> | ||
== References == | == References == | ||
* | |||
* Beck, T.B., and Kraus, N.C. (2010). Shark River Inlet, New Jersey, Entrance Shoaling: Report 2, Analysis with Coastal Modeling System. ''Tech. Report ERDC/CHL-TR-10-4'', US Army Engineer Research and Development Center, Coastal and Hydraulics Laboratory, Vicksburg, MS. | |||
* Kraus, N.C., and Allison, M. C. (2009). Shark River Inlet, New Jersey, Entrance Shoaling: Report 1, Desk Study. ''Tech. Report ERDC/CHL-TR-09-7'', US Army Engineer Research and Development Center, Coastal and Hydraulics Laboratory, Vicksburg, MS. | |||
---- | ---- | ||
[[Shark_River_Inlet | Guided Exercise for Shark River Inlet]] | |||
[[Test_Cases | Test Cases]] | [[Test_Cases | Test Cases]] | ||
[[CMS#Documentation_Portal | Documentation Portal]] | [[CMS#Documentation_Portal | Documentation Portal]] | ||
Latest revision as of 14:55, 11 June 2011
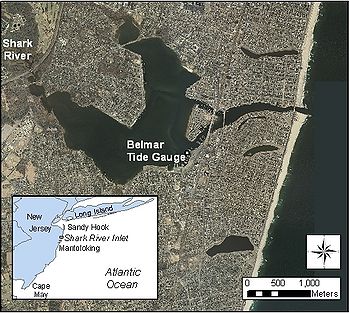
Shark River Inlet, located on the north New Jersey coast (Figure 1), is served by a federal navigation channel that has until recently required little maintenance dredging. Although possessing a small estuary, the inlet is hydraulically efficient because of the small width to depth ratio of its entrance that is stabilized by parallel jetties. After placement of approximately 4.8 million cubic meters of beach nourishment to the north and south of the inlet as part of an erosion-control project conducted in the late 1990s, inlet maintenance increased beyond that anticipated. Figure 2 illustrates a recent bathymetric survey from 2010. The Coastal Modeling System (CMS) was established to numerically simulate waves, current, sand transport, and morphology change. Figure 3 illustrates a 3-dimensional view of the modeling domain for Shark River inlet. Below describes the calibration and validation of water levels, current, and morphologic change.
Model Setup and Calibration
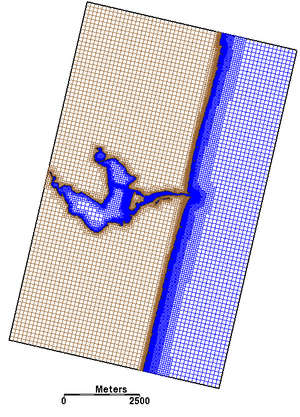
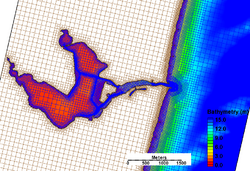
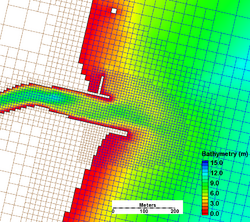
The Coastal Modeling System (CMS), a coupled numerical model of waves and finite-volume, depth-averaged circulation, sediment transport, and morphology change, was established for Shark River Inlet. Two CMS model grids were developed for representing Shark River Inlet, one refined, rectilinear grid for CMS-Wave and the other a telescoping, rectilinear grid for CMS-Flow and sand transport (Figures 4 through 6). The CMS was driven by tide and hindcast waves. The Lund-CIRP transport formula (Camenen and Larson 2007) was selected as the governing empirical equation to calculate bedload and suspended load within CMS-Flow for combined waves (breaking and non-breaking) and current.
A non-uniform sediment transport scheme was used in the CMS to represent the various grain sizes being transported and the significant impact of sediment hiding and exposure. Five different sediment grain sizes were defined based on the D50 (0.26 mm) in the grid. Including hiding and exposure of multiple grain size distributions reduced scour within the channel thalweg, and accurately represent the distribution of grains observed in this region.
Bed change is calculated over the same sediment transport timestep, which was 900 seconds (15 minutes), and updated in both the wave and flow models. Bed change was updated in the wave model on the steering interval of 3 hours. An existing condition from a recent January 2009 bathymetry formed the basis to generate a grid for a contemporary representation of the inlet after dredging (Figure 6), and was used to calibrate the model.
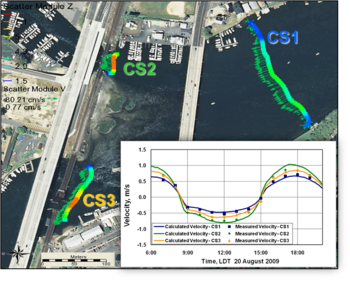
Calibration of the CMS for was completed in two parts: first, through comparison of measured and calculated hydrodynamics, and secondly through comparison of morphologic end-states through validating channel infilling rates and morphologic patterns. Observed water levels and measured current velocity in the Shark River estuary and inlet, collected on 20 August 2009, were used in the original hydrodynamic calibration (Beck and Kraus 2010). Beck and Kraus (2010) also compared measured and calculated current velocity at the centrally-located peak velocity in the three main channels (Figure 7). Measurements and calculations show close correspondence for the main channel (CS 1) and south channel (CS 3) with a Root Mean Absolute Error (RMAE) value of 3-5%, and an RMAE of 9 % for the north channel (CS2).
Morphologic response was calibrated to the measured change from January 2009 to April 2009, a typical recent dredging interval, and served to verify channel cross-sections and infilling rates (Figure 8). Empirically derived coefficients for sediment transport were modified within the model to calibrate to sediment transport rates available for the region. The Lund-CIRP equations were calibrated to a specific equation, but allow for a range of coefficients between 0.5 and 2.0 for bedload and suspsended load transport. The model results for sediment transport are largely dependent on the wave forcing, and therefore the calculated morphology change will be driven by the quality of wave input. Because measured wave data is not available for the area, the WIS hindcast waves that were selected do not imitate the modeled time periods (January to April 2009), but they do represent an average January to April time period. Bedload and suspended load coefficients of 2.0 were found to better match estimated transport rates for Shark River Inlet. Table 1 lists the final sediment transport parameters determined for a calibrated model of Shark River Inlet.
Table 1. Sediment transport and morphology parameters in the CMS
| Parameter | Value |
|---|---|
| Formulation | Advection-Diffusion |
| Sediment Transport Formula | Lund-CIRP |
| Bed Load Scaling Factor | 2.0 |
| Suspended Load Scaling Factor | 2.0 |
| Sediment Porosity | 0.3 |
| Bed Slope Coefficient | 0.1 |
| Morphologic Acceleration Factor | 1.0 |
| Total Load Adaptation Length Method | Constant |
| Adaptation Length (m) | 100.0 |
The Non-equilibrium Transport (NET) method also controls the capacity of sediment transport through scaling factors such as adaptation lengths or times, generally dependent upon length-scales of morphologic features such as bedforms or timescales of sediment movement. As a total load formulation is used with the NET, the Adaptation Length must be modified to calibrate to morphology. The Adaptation Length is a length scaling factor that is typically based on localized bedforms. The smaller the Adaptation Length, the closer the model is to Equilibrium Transport which results in greater rates of transport that is more localized. Adaptation Lengths tested included 1, 2, 3, 4, 5, 10, and 100 meters. An Adaptation Length of 100 m was selected for the entire domain of the final calculations because of the realistic patterns and volumetric changes observed in the calculations as compared to the measurements. Final parameter values were chosen to produce calibration of results to specific regions of interest, such as channel infilling in the dredged pit.
Validation of Morphology Change
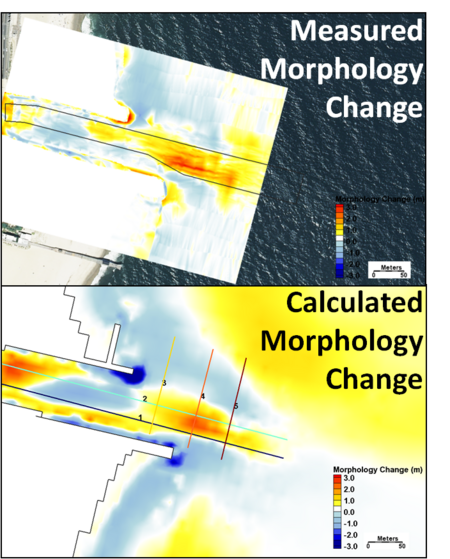
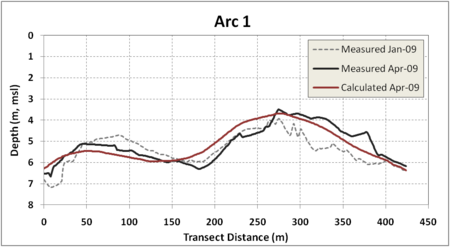
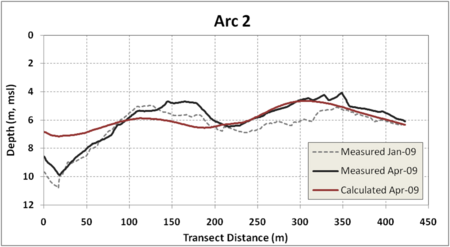
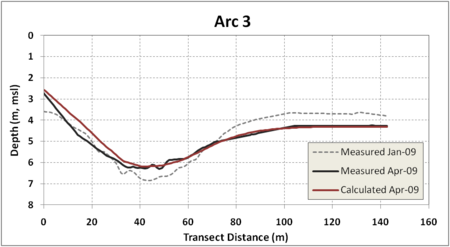
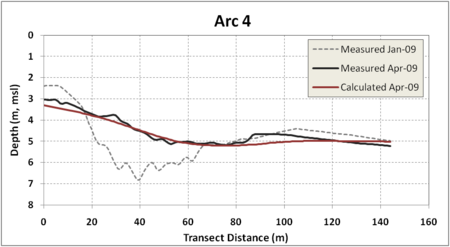
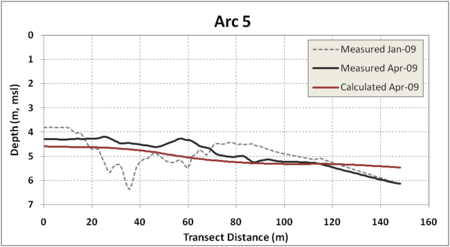
Morphologic response was calibrated to the measured change from January 2009 to April 2009, a typical recent dredging interval, and served to verify channel cross-sections and infilling rates (Figure 28). Based on the surveys, channel infilling volume expected for the 4-month simulation is 8,900 m3 for the entrance channel alone. The 4-month simulation produced a similar channel infilling volume of 9,200 m3 (RMAE of 3.4%) and morphologic patterns, as illustrated in Figure 8. A comparison of measured and calculated change along the transects in Figure 8 showed a high correlation with RMAE values of 7%, 11%, 2%, 4%, and 6% for Transects 1-5 (Figures 9 through 13) respectively.
Table 2. Measured and calculated volume change for the dredged portion of Shark River Inlet
| Dredged Channel |
|---|
| Measured = 8,900 cy |
| Calculated = 9,200 cy |
| 3.3 % Difference |
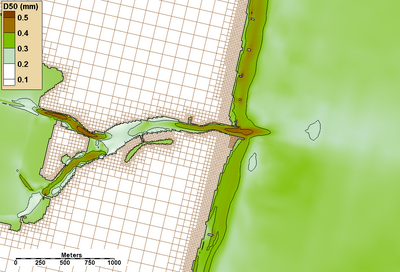
As a result of including nonuniform sediment transport, the grain size distributions are modified through the simulation. The model records the changing distribution through a D35, D50, and D90. D50 is given in Figure 14, and illustrates the modification of the median grain size from 4 months of simulated hiding and exposure and overall sediment transport. In areas that experienced the greatest velocities, the inlet throat and main channels, D50 values were highest at around 0.4-0.5 mm. This also included areas around structures, namely the groin fields and jetties. The smallest D50 values are found in areas of low energy or velocities, and tend to be at the distal end of channels. This distribution of sediment agrees with qualitative understanding that coarser sediment tends to remain in higher energy regions, whereas finer sediment is deposited in relatively quiescent areas.
- For a definition of the goodness of fit statistics see Goodness of fit statistics
References
- Beck, T.B., and Kraus, N.C. (2010). Shark River Inlet, New Jersey, Entrance Shoaling: Report 2, Analysis with Coastal Modeling System. Tech. Report ERDC/CHL-TR-10-4, US Army Engineer Research and Development Center, Coastal and Hydraulics Laboratory, Vicksburg, MS.
- Kraus, N.C., and Allison, M. C. (2009). Shark River Inlet, New Jersey, Entrance Shoaling: Report 1, Desk Study. Tech. Report ERDC/CHL-TR-09-7, US Army Engineer Research and Development Center, Coastal and Hydraulics Laboratory, Vicksburg, MS.