Culverts: Difference between revisions
| (59 intermediate revisions by 2 users not shown) | |||
| Line 1: | Line 1: | ||
__NOTOC__ | __NOTOC__ | ||
<font size = "4">'''Representation of Culverts in the CMS'''</font><br> | |||
<font color=red> '''''By Christopher Reed and Alejandro Sánchez''''' </font><br> | |||
<font size = " | <font color=red> '''''Last Modified: September 17, 2010''''' </font> | ||
'''''By Christopher Reed and Alejandro Sánchez''''' | |||
'''''Last Modified: September 17, 2010''''' | |||
==Introduction== | ==Introduction== | ||
Culverts are a common coastal structure used to increase flushing improve water quality and also provide passage for fish and other aquatic animals to coastal lagoons and bays. The implementation of culverts is based on equations developed by Bodhaine (1982). In coastal applications of culverts, the culverts often connect open water bodies of similar water surface elevation, for instance, to enhance flushing or provide controlled flow through levees or causeways. Therefore, the implementation of culverts assumes sub-critical flow conditions. The implementation of culverts in the CMS is validated in two applications on the lower Mississippi River. The culvert feature is validated with an application to optimize discharges in simulations of the White Ditch diversion in Plaquemines Parish, Louisiana. | Culverts are a common coastal structure used to increase flushing improve water quality and also provide passage for fish and other aquatic animals to coastal lagoons and bays. The implementation of culverts is based on equations developed by Bodhaine (1982). In coastal applications of culverts, the culverts often connect open water bodies of similar water surface elevation, for instance, to enhance flushing or provide controlled flow through levees or causeways. Therefore, the implementation of culverts assumes sub-critical flow conditions. The implementation of culverts in the CMS is validated in two applications on the lower Mississippi River. The culvert feature is validated with an application to optimize discharges in simulations of the White Ditch diversion in Plaquemines Parish, Louisiana. | ||
== Formulation == | == Formulation == | ||
[[File:Culverts_Figure_1.png|thumb|right| | [[File:Culverts_Figure_1.png|thumb|right|600px|Figure 1. Schematic showing culvert flow conditions.]] | ||
The representation of culvert flow in the CMS is based on the approach of Bodhaine (1982) and is applied for circular and rectangular culvert cross-sections. Bodhaine describes six types of flow conditions through a culvert that depends on the culvert slope and the upstream and downstream water levels. In most coastal applications of culverts, they are level and the water elevations on either side are similar. These conditions can be considered as ponded upstream and downstream conditions and are most similar to Bodhaine Type 4 flow conditions. A schematic of the typical flow conditions for the culvert is shown in Figure 1. Assuming that the entrance and exit losses are small compared to friction losses in the culvert, the flow equations can be derived from Manning<nowiki>’</nowiki>s equation (using the metric system): | The representation of culvert flow in the CMS is based on the approach of Bodhaine (1982) and is applied for circular and rectangular culvert cross-sections. Bodhaine describes six types of flow conditions through a culvert that depends on the culvert slope and the upstream and downstream water levels. In most coastal applications of culverts, they are level and the water elevations on either side are similar. These conditions can be considered as ponded upstream and downstream conditions and are most similar to Bodhaine Type 4 flow conditions. A schematic of the typical flow conditions for the culvert is shown in Figure 1. Assuming that the entrance and exit losses are small compared to friction losses in the culvert, the flow equations can be derived from Manning<nowiki>’</nowiki>s equation (using the metric system): | ||
{{Equation|<math>q = C \frac{A R^{2/3} S^{1/2} }{ n } </math>|1}} | |||
where $q$ is the flow through the culvert, $A$ is the flow cross-sectional area, $R$ is the hydraulic radius, $S$ is the hydraulic gradient, $n$ and is Manning<nowiki>’</nowiki>s. | |||
<br style="clear:both" /> | |||
Coefficient $C$ has been introduced to allow for calibration or representation of other losses. If calibration data is not available then the coefficient $C$ should be set to 1.0. | |||
Coefficient has been introduced to allow for calibration or representation of other losses. If calibration data is not available then the coefficient should be set to 1.0. | |||
The hydraulic gradient S is defined as: | The hydraulic gradient S is defined as: | ||
{{Equation|<math>S = \frac{h_1 - h_2 }{ L } </math>|2}} | |||
where the variables $h_1$, $h_2$, and $L$ are defined in Figure 1. | |||
<br style="clear:both" /> | |||
The hydraulic radius $R$ is defined as the flow area <math>A</math> divided by the wetted perimeter $P$. The values for these variables are dependent on the culvert cross-section and the water depth in the culvert. | |||
=== Circular Cross-section === | |||
[[File:Culverts_Figure_2.png|thumb|right|600px|Figure 2. Variable definition for circular cross-section.]] | |||
For circular culvert cross-sections, using the definitions in Figure 2, the wetted perimeter and flow area are: | |||
Figure 2. Variable definition for circular cross-section. | {{Equation|<math> | ||
P = \bigg\{ \begin{smallmatrix} 2 \theta r, h<r \\ 2(\pi-\alpha)r, 2r>h>r \\ 2 \pi r, h>2r \end{smallmatrix}\quad \text{and} \quad A = \bigg\{ \begin{smallmatrix} \theta r^2, h<r \\ (\pi-\alpha)r^2, 2r>h>r \\ \pi r^2, h>2r \end{smallmatrix} | |||
</math>|3}} | |||
and | |||
where <math>\theta=\cos^{-1}{ \bigg( \frac{r-h}{h} \bigg) } </math> and <math>\alpha=\cos^{-1}{ \bigg( \frac{2r-h}{r} \bigg) }</math> | |||
<br style="clear:both" /> | |||
=== Rectangular Cross-section === | |||
[[File:Culverts_Figure_3.png|thumb|right|500px|Figure 3. Variable definition for rectangular cross-section.]] | |||
For a rectangular cross-section the wetted perimeter and flow area are: | For a rectangular cross-section the wetted perimeter and flow area are: | ||
and | {{Equation|<math> P = \bigg\{ \begin{smallmatrix} w+2h, h<d \\ 2w+2h, h>d \end{smallmatrix} \quad \text{and} \quad A = \bigg\{ \begin{smallmatrix} wh, h<d \\ wd, h>d \end{smallmatrix} </math>|4}} | ||
where the variables defined as shown in Figure 3. | where the variables defined as shown in Figure 3. | ||
<br style="clear:both" /> | |||
=== Flap Gates === | |||
The option for including a flap gate at one end of the culvert is also included. For this implementation, flow is limited to the <nowiki>’</nowiki>downstream<nowiki>’</nowiki> direction only. If the hydraulic gradient opposes the designated downstream direction (i.e.<nowiki><</nowiki> 0), the flow is set to zero. | The option for including a flap gate at one end of the culvert is also included. For this implementation, flow is limited to the <nowiki>’</nowiki>downstream<nowiki>’</nowiki> direction only. If the hydraulic gradient opposes the designated downstream direction (i.e.<nowiki><</nowiki> 0), the flow is set to zero. | ||
== Numerical Implementation == | == Numerical Implementation == | ||
The CMS-Flow model uses a staggered grid for the basis of the numerical solution. Two examples of a culvert implementation on the CMS grid are shown in Figure 6. The beginning and end of the culvert are not restricted to adjacent cells and can cross multiple active or inactive cells. A culvert is specified by an upstream and downstream cell, the culvert invert elevation (relative to the model datum), the culvert coefficient | [[File:Culverts_Figure_4.png|thumb|right|600px|Figure 4. CMS grid and designation of culverts.]] | ||
The CMS-Flow explicit model uses a staggered grid for the basis of the numerical solution. Two examples of a culvert implementation on the CMS grid are shown in Figure 6. The beginning and end of the culvert are not restricted to adjacent cells and can cross multiple active or inactive cells. A culvert is specified by an upstream and downstream cell, the culvert invert elevation (relative to the model datum), the culvert coefficient | |||
and the culvert shape (circular or rectangular) and associated parameter values. For circular cross-sections, the culvert radius r is specified, and for rectangular cross-sections, the width w and height d are specified. If a flap gate is specified, the flow is limited to the downstream direction. Thus, the upstream and downstream cell designation are important when flap gates are included. The momentum flux of flows through the culverts are assumed to be small and not included in the momentum balance calculations in the CMS solvers. Thus, the culvert flows are only included in the mass balance calculations in the CMS solvers. | and the culvert shape (circular or rectangular) and associated parameter values. For circular cross-sections, the culvert radius r is specified, and for rectangular cross-sections, the width w and height d are specified. If a flap gate is specified, the flow is limited to the downstream direction. Thus, the upstream and downstream cell designation are important when flap gates are included. The momentum flux of flows through the culverts are assumed to be small and not included in the momentum balance calculations in the CMS solvers. Thus, the culvert flows are only included in the mass balance calculations in the CMS solvers. | ||
| Line 85: | Line 58: | ||
When salinity or sediment transport is included in simulations with weirs or culverts, the salinity and suspended sediment will be transported. The bedload components in sediment transport algorithms will not be transported over weirs and through culverts. | When salinity or sediment transport is included in simulations with weirs or culverts, the salinity and suspended sediment will be transported. The bedload components in sediment transport algorithms will not be transported over weirs and through culverts. | ||
<br style="clear:both" /> | |||
== Additional Information == | == Additional Information == | ||
| Line 173: | Line 69: | ||
*Militello, A., Reed, C.W., Zundel, A.K., and Kraus, N.C. 2004. Two-Dimensional Depth-Averaged Circulation Model M2D: Version 2.0, Report 1, Technical Documentation and User<nowiki>’</nowiki>s Guide, ERDC/CHL TR-04-2, U.S. Army Research and Development Center, Coastal and Hydraulics Laboratory, Vicksburg, MS. | *Militello, A., Reed, C.W., Zundel, A.K., and Kraus, N.C. 2004. Two-Dimensional Depth-Averaged Circulation Model M2D: Version 2.0, Report 1, Technical Documentation and User<nowiki>’</nowiki>s Guide, ERDC/CHL TR-04-2, U.S. Army Research and Development Center, Coastal and Hydraulics Laboratory, Vicksburg, MS. | ||
*URS. 2010. USACE White Ditch evaluation and design – hydrodynamic and salinity transport modeling. URS Corporation, Tallahassee, FL. | *URS. 2010. USACE White Ditch evaluation and design – hydrodynamic and salinity transport modeling. URS Corporation, Tallahassee, FL. | ||
---- | ---- | ||
Latest revision as of 15:39, 22 October 2012
Representation of Culverts in the CMS
By Christopher Reed and Alejandro Sánchez
Last Modified: September 17, 2010
Introduction
Culverts are a common coastal structure used to increase flushing improve water quality and also provide passage for fish and other aquatic animals to coastal lagoons and bays. The implementation of culverts is based on equations developed by Bodhaine (1982). In coastal applications of culverts, the culverts often connect open water bodies of similar water surface elevation, for instance, to enhance flushing or provide controlled flow through levees or causeways. Therefore, the implementation of culverts assumes sub-critical flow conditions. The implementation of culverts in the CMS is validated in two applications on the lower Mississippi River. The culvert feature is validated with an application to optimize discharges in simulations of the White Ditch diversion in Plaquemines Parish, Louisiana.
Formulation

The representation of culvert flow in the CMS is based on the approach of Bodhaine (1982) and is applied for circular and rectangular culvert cross-sections. Bodhaine describes six types of flow conditions through a culvert that depends on the culvert slope and the upstream and downstream water levels. In most coastal applications of culverts, they are level and the water elevations on either side are similar. These conditions can be considered as ponded upstream and downstream conditions and are most similar to Bodhaine Type 4 flow conditions. A schematic of the typical flow conditions for the culvert is shown in Figure 1. Assuming that the entrance and exit losses are small compared to friction losses in the culvert, the flow equations can be derived from Manning’s equation (using the metric system):
| (1) |
where $q$ is the flow through the culvert, $A$ is the flow cross-sectional area, $R$ is the hydraulic radius, $S$ is the hydraulic gradient, $n$ and is Manning’s.
Coefficient $C$ has been introduced to allow for calibration or representation of other losses. If calibration data is not available then the coefficient $C$ should be set to 1.0.
The hydraulic gradient S is defined as:
| (2) |
where the variables $h_1$, $h_2$, and $L$ are defined in Figure 1.
The hydraulic radius $R$ is defined as the flow area divided by the wetted perimeter $P$. The values for these variables are dependent on the culvert cross-section and the water depth in the culvert.
Circular Cross-section

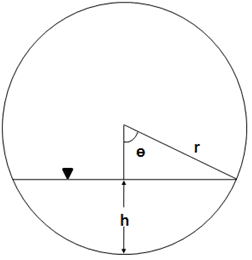
For circular culvert cross-sections, using the definitions in Figure 2, the wetted perimeter and flow area are:
| (3) |
where and
Rectangular Cross-section

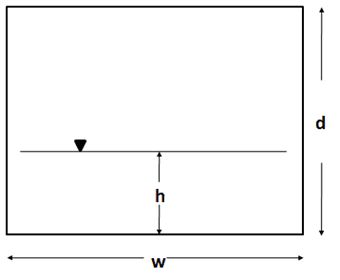
For a rectangular cross-section the wetted perimeter and flow area are:
| (4) |
where the variables defined as shown in Figure 3.
Flap Gates
The option for including a flap gate at one end of the culvert is also included. For this implementation, flow is limited to the ’downstream’ direction only. If the hydraulic gradient opposes the designated downstream direction (i.e.< 0), the flow is set to zero.
Numerical Implementation

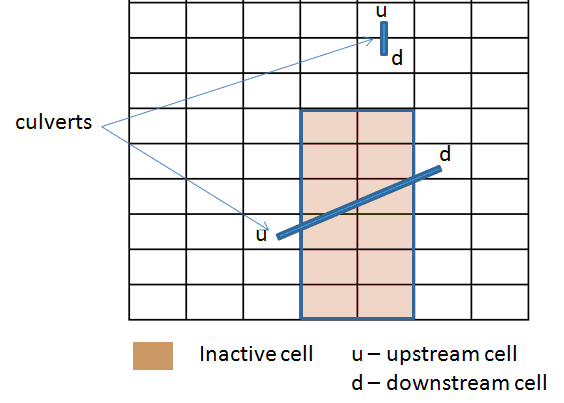
The CMS-Flow explicit model uses a staggered grid for the basis of the numerical solution. Two examples of a culvert implementation on the CMS grid are shown in Figure 6. The beginning and end of the culvert are not restricted to adjacent cells and can cross multiple active or inactive cells. A culvert is specified by an upstream and downstream cell, the culvert invert elevation (relative to the model datum), the culvert coefficient
and the culvert shape (circular or rectangular) and associated parameter values. For circular cross-sections, the culvert radius r is specified, and for rectangular cross-sections, the width w and height d are specified. If a flap gate is specified, the flow is limited to the downstream direction. Thus, the upstream and downstream cell designation are important when flap gates are included. The momentum flux of flows through the culverts are assumed to be small and not included in the momentum balance calculations in the CMS solvers. Thus, the culvert flows are only included in the mass balance calculations in the CMS solvers.
Culverts and weirs can be associated with the same CMS cell face and the total flux across the cell face will be the sum of all weirs and culverts specified for that cell face. However, only the fluxes associated with the weirs will be included in the momentum balance.
When salinity or sediment transport is included in simulations with weirs or culverts, the salinity and suspended sediment will be transported. The bedload components in sediment transport algorithms will not be transported over weirs and through culverts.
Additional Information
This CHETN was prepared and funded under the Coastal Inlets Research Program (CIRP) and was written by Dr. Christopher W. Reed (Chris_Reed@URSCorp.com) of URS Corporation. The CIRP Program Manager, Dr. Julie D. Rosati (Julie.D.Rosati@usace.army.mil), the assistant Program Manager, Dr. Nicholas C. Kraus, the Chief of the Coastal Engineering Branch at CHL and Alejandro Sanchez reviewed this CHETN. Files for the example may be obtained by contacting the author.
References
- Buttolph, A. M., C. W. Reed, N. C. Kraus, N. Ono, M. Larson, B. Camenen, H. Hanson, T. Wamsley, and A. K. Zundel, A. K. 2006. Two-dimensional depth-averaged circulation model CMS-M2D: Version 3.0, Report 2, sediment transport and morphology change. Coastal and Hydraulics Laboratory Technical Report ERDC/CHL-TR-06-7. Vicksburg, MS: U.S. Army Engineer Research and Development Center.
- Bodhaine, G.L., 1982, "Measurement of Peak Discharge at Culverts by Indirect Methods," Techniques of Water Resources Investigations of the United States Geological Survey, Book 3, Chapter A3, U.S. Geological Survey, WA.
- Militello, A., Reed, C.W., Zundel, A.K., and Kraus, N.C. 2004. Two-Dimensional Depth-Averaged Circulation Model M2D: Version 2.0, Report 1, Technical Documentation and User’s Guide, ERDC/CHL TR-04-2, U.S. Army Research and Development Center, Coastal and Hydraulics Laboratory, Vicksburg, MS.
- URS. 2010. USACE White Ditch evaluation and design – hydrodynamic and salinity transport modeling. URS Corporation, Tallahassee, FL.