CMS/DredgeModule/Phase2: Difference between revisions
mNo edit summary |
m →Summary |
||
| (31 intermediate revisions by the same user not shown) | |||
| Line 1: | Line 1: | ||
< | {{DISPLAYTITLE:CMS Dredge Module - Phase 2}} | ||
{{TOC right}} | |||
This page is taken primarily from the USACE Coastal and Hydraulics Technical Note entitled "Coastal Modeling System: Dredging Module Simulation with Multiple Grain Sizes" which can be found at:<br> | |||
https://erdc-library.erdc.dren.mil/jspui/bitstream/11681/33664/3/ERDC-CHL%20CHETN-I-98.pdf. | |||
= Background = | = Background = | ||
The dredging and placement of multiple sediment grain-sizes are an extension of the single-grain | The dredging and placement of multiple sediment grain-sizes are an extension of the single-grain size transport approach. In the updated Dredge Module (DM), the sediment can be represented by discrete grain size classes, and each size class is eroded, transported, and deposited independently. The grain size classes interact solely in the bed layers. The bed is represented by sediment layers of a specific thickness below the bed surface. The top or surficial upper bed layer is referred to as the mixing | ||
size transport approach. In the updated Dredge Module, the sediment can be represented by discrete grain size | layer (often referred to as the active layer), which exchanges the surficial sediments with deposition from the water column. The mixing layer thickness may be set to a constant value (e.g., 0.05 meter [m]) or calculated based on the median grain size and bed form size at each cell. The critical shear stress for erosion for each grain size class in the mixing layer is determined using the | ||
classes, and each size class is eroded, transported, and deposited independently. The grain size | |||
classes interact solely in the bed layers. The bed is represented by sediment layers of a specific | |||
thickness below the bed surface. The top or surficial upper bed layer is referred to as the mixing | |||
layer (often referred to as the active layer), which exchanges the surficial sediments with | |||
deposition from the water column. The mixing layer thickness may be set to a constant value (e.g., | |||
0.05 meter [m]) or calculated based on the median grain size and bed form size at each cell. The | |||
critical shear stress for erosion for each grain size class in the mixing layer is determined using the | |||
hiding and exposure approach of Wu. | hiding and exposure approach of Wu. | ||
Below the mixing layer, additional bed layers are defined and are used to track the fraction of each | Below the mixing layer, additional bed layers are defined and are used to track the fraction of each grain size class in the bed, referred to as the bed composition. All of the bed layers exchange sediment with each other by splitting and merging adjacent layers as their thickness evolves during a simulation due to erosion and deposition. Guidance on the implementation in SMS is available at [[CMS-Flow_Multiple-sized_Sediment_Transport | CMS-Flow_Multiple-sized_Sediment_Transport]]. | ||
grain size class in the bed, referred to as the bed composition. All of the bed layers exchange | |||
sediment with each other by splitting and merging adjacent layers as their thickness evolves during | |||
a simulation due to erosion and deposition. Guidance on the implementation in SMS is available at [[CMS-Flow_Multiple-sized_Sediment_Transport | CMS-Flow_Multiple-sized_Sediment_Transport]]. | |||
The CMS is a depth-averaged numerical model. Because the effects of three-dimensional | The CMS is a depth-averaged numerical model. Because the effects of three-dimensional processes are not included in the dredging and placement module, dredged cut and placement features are not reflective of realistic morphology around designated operation sites. Therefore, this module is suggested to be applied in cases with non-cohesive sand sized sediment where the morphological characteristics of dredging/placement need not be resolved. | ||
processes are not included in the dredging and placement module, dredged cut and placement | |||
features are not reflective of realistic morphology around designated operation sites. Therefore, | |||
this module is suggested to be applied in cases with non-cohesive sand sized sediment where the | |||
morphological characteristics of dredging/placement need not be resolved. | |||
= Setup = | = Setup = | ||
[[File:DM_P2_Fig1.png|thumb|300px|Figure 1. CMS grid, bathymetry and Dredge Module information.]] | [[File:DM_P2_Fig1.png|thumb|300px|Figure 1. CMS grid, bathymetry and Dredge Module information.]] | ||
[[File:DM_P2_Fig2.png|thumb|300px|Figure 2. Initial distribution of the d50 values of the bed.]] | [[File:DM_P2_Fig2.png|thumb|300px|Figure 2. Initial distribution of the d50 values of the bed.]] | ||
The grid, bathymetry, and dredging and placement areas for the example simulation are shown in | The grid, bathymetry, and dredging and placement areas for the example simulation are shown in Figure 1, which represents a typical offshore region extending 6 kilometers (km) along shore and 3 km offshore, with water depths on the order of 1.5 m in the nearshore and 9 m at the offshore extent. The bed composition is shown in Figure 2. The median grain size (d50) is 0.2 millimeters (mm) in the nearshore and increases linearly offshore, to a value of 3.0 mm. | ||
Figure 1, which represents a typical offshore region extending 6 kilometers (km) along shore and | |||
3 km offshore, with water depths on the order of 1.5 m in the nearshore and 9 m at the offshore | |||
extent. The bed composition is shown in Figure 2. The median grain size (d50) is 0.2 millimeters | |||
(mm) in the nearshore and increases linearly offshore, to a value of 3.0 mm. | |||
The dredging and placement areas simulated in Examples 1, 2, and 3 are illustrated in Figure 1. The dredging area is 60 m wide by 1,880 m long (area = 112,800 m<sup>2</sup>) extending from the nearshore to a depth of approximately 6.0 m. The dredged depth is specified as 6.0 m. This yields a total dredged volume of 220,465 m<sup>3</sup> of bulk material. The dredging rate is specified as 10,000 m<sup>3</sup> per day corresponding to a 22-day dredging event. The dredging is specified to start at the nearshore and proceed in the offshore direction by specifying the starting cell locations (as indicated in Figure 1). The placement area is located offshore of the dredging area and is 400 m by 520 m (area =208,000 m<sup>2</sup>). Two dredging methods were tested in Examples 1 and 2, and Example 3 applied a variation of bed layer thickness for comparison to Example 2. | The dredging and placement areas simulated in Examples 1, 2, and 3 are illustrated in Figure 1. The dredging area is 60 m wide by 1,880 m long (area = 112,800 m<sup>2</sup>) extending from the nearshore to a depth of approximately 6.0 m. The dredged depth is specified as 6.0 m. This yields a total dredged volume of 220,465 m<sup>3</sup> of bulk material. The dredging rate is specified as 10,000 m<sup>3</sup> per day corresponding to a 22-day dredging event. The dredging is specified to start at the nearshore and proceed in the offshore direction by specifying the starting cell locations (as indicated in Figure 1). The placement area is located offshore of the dredging area and is 400 m by 520 m (area =208,000 m<sup>2</sup>). Two dredging methods were tested in Examples 1 and 2, and Example 3 applied a variation of bed layer thickness for comparison to Example 2. | ||
{{clear}} | |||
= | = Examples = | ||
[[File:DM_P2_Fig3.png|thumb| | [[File:DM_P2_Fig3.png|thumb|200px|Figure 3. Dredge definition page of the DM interface in SMS 13.0+.]] | ||
[[File:DM_P2_Fig4.png|thumb| | [[File:DM_P2_Fig4.png|thumb|200px|Figure 4. Placement definition page of the DM interface in SMS 13.0+.]] | ||
[[File:DM_P2_Fig5.png|thumb| | [[File:DM_P2_Fig5.png|thumb|200px|Figure 5. Bed surface d50 distribution after 22 days of simulation for the START_METHOD "SPECIFIED CELL" placement option.]] | ||
{| cellspacing=0 align=center cellpadding=5px width=70% style="border: 1px solid gray;" | |||
|+ Table 1. Summary of Examples | |||
|- | |||
! style="background:lightblue;color:black;border-bottom:1.5px solid black;border-right:1px solid gray" |Example | |||
! style="background:lightblue;color:black;border-bottom:1.5px solid black" |Description | |||
|- | |||
! style="border-bottom:1px solid gray; border-right:1px solid gray" |1 | |||
| style="border-bottom:1px solid gray" |SPECIFIED CELL method for dredging and placement. Starting cell must be identified for both. Dredge rate set to 10000 m<sup>3</sup>/day. Trigger method set to DEPTH of 6 meters with a Distribution method set to PERCENT. Thickness limit set to 1.1 meters. | |||
|- | |||
! style="border-bottom:1px solid gray; border-right:1px solid gray" |2 | |||
| style="border-bottom:1px solid gray" |Dredging setup is the same as example 1, however the Placement method is set to UNIFORM and instead of a Thickness limit, this example uses a Depth limit of 3. | |||
|- | |||
! style="border-bottom:1px solid gray; border-right:1px solid gray" |3 | |||
| style="border-bottom:1px solid gray" |Example 3 is identical to example 2 in the dredge module setup, the changes occur in the sediment transport mixing layer and bed layer thicknesses. | |||
|} | |||
== Example 1 == | |||
For the first example simulation, the dredged material was removed and placed using the “SPECIFIED CELL” method in which the starting cell for each operation is specified. In this method, dredging or placement begins at the specified cell and then progresses outward. A dredging rate of 10,000 m<sup>3</sup>/day is specified. Removal continues until the trigger depth is reached, and placement continues until the fill reaches a defined upper limit thickness. The dredging and placement then moves to the next closest cell and so on. The trigger depth for dredging is set to 6.0 m, and the upper limit for placement is specified as 1.1 m. One hundred percent of the placement is assigned to the one defined placement zone. Datasets for the dredge and placement areas should be created according to the guidelines given in the initial DM technical note - [https://erdc-library.erdc.dren.mil/jspui/bitstream/11681/20266/1/ERDC-CHL%20CHETN-I-90.pdf Coastal Modeling System: Dredging Module]. | For the first example simulation, the dredged material was removed and placed using the “SPECIFIED CELL” method in which the starting cell for each operation is specified. In this method, dredging or placement begins at the specified cell and then progresses outward. A dredging rate of 10,000 m<sup>3</sup>/day is specified. Removal continues until the trigger depth is reached, and placement continues until the fill reaches a defined upper limit thickness. The dredging and placement then moves to the next closest cell and so on. The trigger depth for dredging is set to 6.0 m, and the upper limit for placement is specified as 1.1 m. One hundred percent of the placement is assigned to the one defined placement zone. Datasets for the dredge and placement areas should be created according to the guidelines given in the initial DM technical note - [https://erdc-library.erdc.dren.mil/jspui/bitstream/11681/20266/1/ERDC-CHL%20CHETN-I-90.pdf Coastal Modeling System: Dredging Module]. | ||
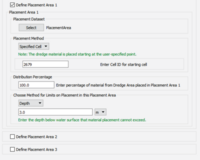
An interface has been added to SMS 13.0 that allows for user specification of dredge module parameters without the need to edit the CMS-Flow parameter file. Figures 3 and 4 show the Dredge Definition and Placement Definition pages for this example, respectively. | An interface has been added to SMS 13.0 that allows for user specification of dredge module parameters without the need to edit the CMS-Flow parameter file. Figures 3 and 4 show the Dredge Definition and Placement Definition pages for this example, respectively. Other examples require small changes to the options on these pages. | ||
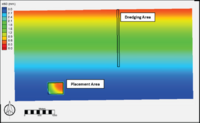
The bed surface (mixing layer) sediment grain-size distribution at the end of the 22-day simulation is shown in Figure 5. In the dredging area, the sediment d50 is the same as in the initial distribution since the dredging only removes material and the lower bed layers retain their initial sediment distribution. | The bed surface (mixing layer) sediment grain-size distribution at the end of the 22-day simulation is shown in Figure 5. In the dredging area, the sediment d50 is the same as in the initial distribution since the dredging only removes material and the lower bed layers retain their initial sediment distribution. | ||
However, there is a variation in the bed surface sediment grain-size distribution in the placement area. The median grain size is coarser with distance from the starting cell. These variations in the placement area reflect the changes in the sediment source (i.e., dredging area) as the dredging proceeds from the near shore (finer d50) to the offshore (coarser d50). | However, there is a variation in the bed surface sediment grain-size distribution in the placement area. The median grain size is coarser with distance from the starting cell. These variations in the placement area reflect the changes in the sediment source (i.e., dredging area) as the dredging proceeds from the near shore (finer d50) to the offshore (coarser d50). | ||
{{clear}} | |||
== Example 2 == | |||
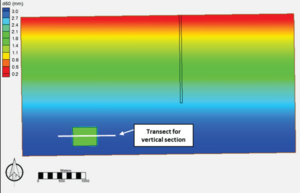
[[File:DM_P2_Fig6.png|thumb|300px|Figure 6. Bed surface d50 distribution after 22 days of simulation for the START_METHOD "UNIFORM" placement option. The white line shows a transect used for analysis.]] | |||
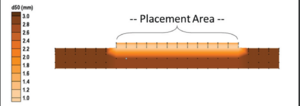
[[File:DM_P2_Fig7.png|thumb|300px|Figure 7. Bed surface vertical d50 distribution after 22 days of simulation for transect shown in Figure 6.]] | |||
In the second simulation, the placement method was changed to UNIFORM with a limit of 3.0 m for depth in the placement area. The uniform method places material uniformly over every cell in the placement area until the indicated placement limit is reached. | |||
The bed surface (mixing layer) sediment grain-size distribution at the end of the 22-day simulation is shown in Figure 6. As before, the sediment d50 in the dredging area at the end of the simulation is the same as in the initial distribution. | |||
However, the d50 of the bed surface sediment grain-size distribution in the placement area has decreased and is approximately uniform (~ 1.5 mm) and reflects the distribution of sediment near the offshore extent of the dredged area. The vertical distribution of the sediment distribution is shown in Figure 7 for the transect shown in Figure 6. The bottom layers have a d50 indicative of the initial sediment composition of the bed. The d50 decreases upward and finally increases again within the top mixing layer. These vertical variations reflect the changing distribution in the source area as the dredging proceeds from the nearshore (finer d50) to the offshore (coarser d50). The discrete points (black dots) represent the top and bottom of each bed layer in each grid cell. | |||
{{clear}} | |||
== Example 3 == | |||
[[File:DM_P2_Fig8.png|thumb|300px|Figure 8. Bed surface vertical d50 distribution after 22 days of simulation for transect shown in Figure 7 using refined bed layer thicknesses.]] | |||
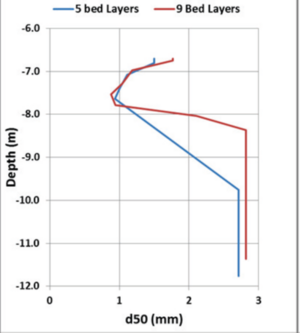
[[File:DM_P2_Fig9.png|thumb|300px|Figure 9. Vertical d50 distribution after 22 days of simulation for point in center of the placement area.]] | |||
A third simulation was conducted to investigate the impact of bed layer thickness on the DM results. This simulation was identical to the second (Figure 7), except that the number of bed layers was increased from the default of 5 to 9. The mixing layer thickness was set to a constant thickness of 0.1 m, and the remaining bed layer thicknesses were set to 0.2 m. | |||
The vertical distribution of the sediment grain size in the placement area is shown in Figure 8 for the same transect in Figure 6. A plot of the vertical profile of d50 through the center of the placement area is shown in Figure 9 and demonstrates the impact of the bed layer parameters. The d50 is similar through most of the placement area deposit, which extends approximately from 6.8 to 8.1 m water depth. At the surface, the results with nine bed layers show a higher d50 than that of the five bed-layer simulation (1.7 mm vs. 1.5 mm). More notable is the difference near the base of the placement area deposit. There is a gradual increase in sediment grain size with depth for the results with five bed layers reaching the maximum d50 near a depth of 10 m. Increasing the number of bed layers to nine resulted in a highly resolved decrease in the d50 at the base of the placement area deposit with the maximum d50 reached just below a depth of 8.25 m. | |||
The “smoothing” of the d50 for the case with five bed layers is an artifact of the merging and splitting process bed layer algorithm in the CMS. These results indicate the need to test the bed layering parameter selections to assure that the desired resolution is obtained in the bed. | |||
{{clear}} | |||
= Summary = | |||
The DM was coupled with multiple grain-size non-cohesive sediment transport and implemented in the CMS. The module significantly enhances the capability of the model to support USACE dredging operations at navigation channels by directly simulating dredging and placements of poorly sorted or nonuniform sediment within a CMS simulation. The implementation of the coupled system does not require any additional input from the user other than the standard inputs that would be required for specifying a multiple grain size or dredging simulation independently. The bed layer algorithms were modified to allow for large changes in bed elevation that may occur during dredging simulations. These modifications prevent sediment mass balance violations that might otherwise occur if the bed layer thickness is too small. The implementation procedure for dredging operation and multiple grain sizes was described, and an example simulation for conditions representing an idealized offshore region has been provided to demonstrate the application of two different dredging and placement methods and their results. | |||
[[CMS/DredgeModule | Return to the previous page]] | |||
[[Category:CMS-Flow]] | |||
Latest revision as of 14:30, 30 April 2025
This page is taken primarily from the USACE Coastal and Hydraulics Technical Note entitled "Coastal Modeling System: Dredging Module Simulation with Multiple Grain Sizes" which can be found at:
https://erdc-library.erdc.dren.mil/jspui/bitstream/11681/33664/3/ERDC-CHL%20CHETN-I-98.pdf.
Background
The dredging and placement of multiple sediment grain-sizes are an extension of the single-grain size transport approach. In the updated Dredge Module (DM), the sediment can be represented by discrete grain size classes, and each size class is eroded, transported, and deposited independently. The grain size classes interact solely in the bed layers. The bed is represented by sediment layers of a specific thickness below the bed surface. The top or surficial upper bed layer is referred to as the mixing layer (often referred to as the active layer), which exchanges the surficial sediments with deposition from the water column. The mixing layer thickness may be set to a constant value (e.g., 0.05 meter [m]) or calculated based on the median grain size and bed form size at each cell. The critical shear stress for erosion for each grain size class in the mixing layer is determined using the hiding and exposure approach of Wu.
Below the mixing layer, additional bed layers are defined and are used to track the fraction of each grain size class in the bed, referred to as the bed composition. All of the bed layers exchange sediment with each other by splitting and merging adjacent layers as their thickness evolves during a simulation due to erosion and deposition. Guidance on the implementation in SMS is available at CMS-Flow_Multiple-sized_Sediment_Transport.
The CMS is a depth-averaged numerical model. Because the effects of three-dimensional processes are not included in the dredging and placement module, dredged cut and placement features are not reflective of realistic morphology around designated operation sites. Therefore, this module is suggested to be applied in cases with non-cohesive sand sized sediment where the morphological characteristics of dredging/placement need not be resolved.
Setup
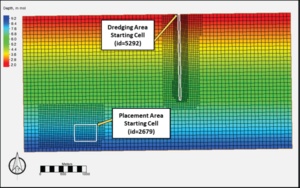
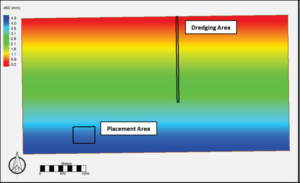
The grid, bathymetry, and dredging and placement areas for the example simulation are shown in Figure 1, which represents a typical offshore region extending 6 kilometers (km) along shore and 3 km offshore, with water depths on the order of 1.5 m in the nearshore and 9 m at the offshore extent. The bed composition is shown in Figure 2. The median grain size (d50) is 0.2 millimeters (mm) in the nearshore and increases linearly offshore, to a value of 3.0 mm.
The dredging and placement areas simulated in Examples 1, 2, and 3 are illustrated in Figure 1. The dredging area is 60 m wide by 1,880 m long (area = 112,800 m2) extending from the nearshore to a depth of approximately 6.0 m. The dredged depth is specified as 6.0 m. This yields a total dredged volume of 220,465 m3 of bulk material. The dredging rate is specified as 10,000 m3 per day corresponding to a 22-day dredging event. The dredging is specified to start at the nearshore and proceed in the offshore direction by specifying the starting cell locations (as indicated in Figure 1). The placement area is located offshore of the dredging area and is 400 m by 520 m (area =208,000 m2). Two dredging methods were tested in Examples 1 and 2, and Example 3 applied a variation of bed layer thickness for comparison to Example 2.
Examples

| Example | Description |
|---|---|
| 1 | SPECIFIED CELL method for dredging and placement. Starting cell must be identified for both. Dredge rate set to 10000 m3/day. Trigger method set to DEPTH of 6 meters with a Distribution method set to PERCENT. Thickness limit set to 1.1 meters. |
| 2 | Dredging setup is the same as example 1, however the Placement method is set to UNIFORM and instead of a Thickness limit, this example uses a Depth limit of 3. |
| 3 | Example 3 is identical to example 2 in the dredge module setup, the changes occur in the sediment transport mixing layer and bed layer thicknesses. |
Example 1
For the first example simulation, the dredged material was removed and placed using the “SPECIFIED CELL” method in which the starting cell for each operation is specified. In this method, dredging or placement begins at the specified cell and then progresses outward. A dredging rate of 10,000 m3/day is specified. Removal continues until the trigger depth is reached, and placement continues until the fill reaches a defined upper limit thickness. The dredging and placement then moves to the next closest cell and so on. The trigger depth for dredging is set to 6.0 m, and the upper limit for placement is specified as 1.1 m. One hundred percent of the placement is assigned to the one defined placement zone. Datasets for the dredge and placement areas should be created according to the guidelines given in the initial DM technical note - Coastal Modeling System: Dredging Module.
An interface has been added to SMS 13.0 that allows for user specification of dredge module parameters without the need to edit the CMS-Flow parameter file. Figures 3 and 4 show the Dredge Definition and Placement Definition pages for this example, respectively. Other examples require small changes to the options on these pages.
The bed surface (mixing layer) sediment grain-size distribution at the end of the 22-day simulation is shown in Figure 5. In the dredging area, the sediment d50 is the same as in the initial distribution since the dredging only removes material and the lower bed layers retain their initial sediment distribution.
However, there is a variation in the bed surface sediment grain-size distribution in the placement area. The median grain size is coarser with distance from the starting cell. These variations in the placement area reflect the changes in the sediment source (i.e., dredging area) as the dredging proceeds from the near shore (finer d50) to the offshore (coarser d50).
Example 2
In the second simulation, the placement method was changed to UNIFORM with a limit of 3.0 m for depth in the placement area. The uniform method places material uniformly over every cell in the placement area until the indicated placement limit is reached.
The bed surface (mixing layer) sediment grain-size distribution at the end of the 22-day simulation is shown in Figure 6. As before, the sediment d50 in the dredging area at the end of the simulation is the same as in the initial distribution.
However, the d50 of the bed surface sediment grain-size distribution in the placement area has decreased and is approximately uniform (~ 1.5 mm) and reflects the distribution of sediment near the offshore extent of the dredged area. The vertical distribution of the sediment distribution is shown in Figure 7 for the transect shown in Figure 6. The bottom layers have a d50 indicative of the initial sediment composition of the bed. The d50 decreases upward and finally increases again within the top mixing layer. These vertical variations reflect the changing distribution in the source area as the dredging proceeds from the nearshore (finer d50) to the offshore (coarser d50). The discrete points (black dots) represent the top and bottom of each bed layer in each grid cell.
Example 3
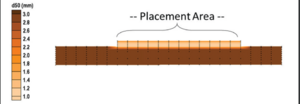
A third simulation was conducted to investigate the impact of bed layer thickness on the DM results. This simulation was identical to the second (Figure 7), except that the number of bed layers was increased from the default of 5 to 9. The mixing layer thickness was set to a constant thickness of 0.1 m, and the remaining bed layer thicknesses were set to 0.2 m.
The vertical distribution of the sediment grain size in the placement area is shown in Figure 8 for the same transect in Figure 6. A plot of the vertical profile of d50 through the center of the placement area is shown in Figure 9 and demonstrates the impact of the bed layer parameters. The d50 is similar through most of the placement area deposit, which extends approximately from 6.8 to 8.1 m water depth. At the surface, the results with nine bed layers show a higher d50 than that of the five bed-layer simulation (1.7 mm vs. 1.5 mm). More notable is the difference near the base of the placement area deposit. There is a gradual increase in sediment grain size with depth for the results with five bed layers reaching the maximum d50 near a depth of 10 m. Increasing the number of bed layers to nine resulted in a highly resolved decrease in the d50 at the base of the placement area deposit with the maximum d50 reached just below a depth of 8.25 m.
The “smoothing” of the d50 for the case with five bed layers is an artifact of the merging and splitting process bed layer algorithm in the CMS. These results indicate the need to test the bed layering parameter selections to assure that the desired resolution is obtained in the bed.
Summary
The DM was coupled with multiple grain-size non-cohesive sediment transport and implemented in the CMS. The module significantly enhances the capability of the model to support USACE dredging operations at navigation channels by directly simulating dredging and placements of poorly sorted or nonuniform sediment within a CMS simulation. The implementation of the coupled system does not require any additional input from the user other than the standard inputs that would be required for specifying a multiple grain size or dredging simulation independently. The bed layer algorithms were modified to allow for large changes in bed elevation that may occur during dredging simulations. These modifications prevent sediment mass balance violations that might otherwise occur if the bed layer thickness is too small. The implementation procedure for dredging operation and multiple grain sizes was described, and an example simulation for conditions representing an idealized offshore region has been provided to demonstrate the application of two different dredging and placement methods and their results.