Clear water jet: Difference between revisions
Jump to navigation
Jump to search
Created page with '== '''Setup''' == Normal 0 false false false MicrosoftInternetExplorer4 The rectangular flume has a narrow 0.2 m-wide inlet and a 3 m-wide outlet.…' |
|||
| (10 intermediate revisions by the same user not shown) | |||
| Line 1: | Line 1: | ||
== '''Setup''' == | == '''Setup''' == | ||
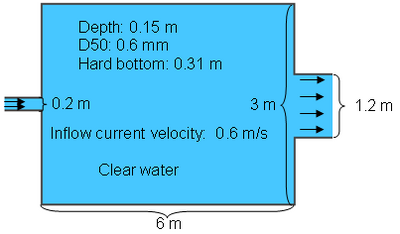
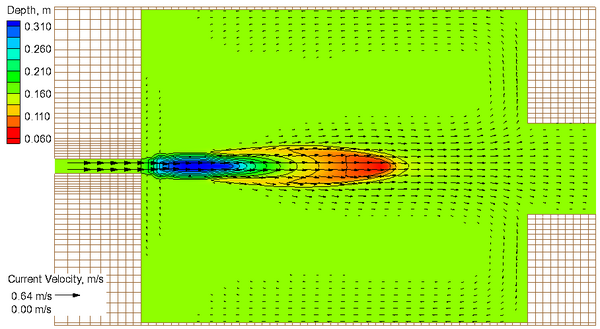
The rectangular flume has a narrow 0.2 m-wide inlet and a 3 m-wide outlet. The initial water depth was 0.15 m with a 0.16 m layer of 0.6 mm sand over a concrete bottom. The flume was 5 m long and 4 m wide. The measured sand settling velocity of 0.013 m/s was used. The computational mesh consisted of 62 rows and 69 columns (Figure 2). The computational time was 30 seconds. The transport equation which best fit the measurements was the Soulsby-van Rijn (1997). | |||
The rectangular flume has a narrow 0.2 m-wide inlet and a 3 m-wide outlet. The initial water depth was 0.15 m with a 0.16 m layer of 0.6 mm sand over a concrete bottom. The flume was 5 m long and 4 m wide. The measured sand settling velocity of 0.013 m/s was used. | |||
The | |||
[[Image:Thuc_Exp_Setup.png|thumb|left|400px| Figure 1. Experimental setup for Thuc (1991) experiment. ]] | |||
<br style="clear:both" /> | <br style="clear:both" /> | ||
== '''Results''' == | == '''Results''' == | ||
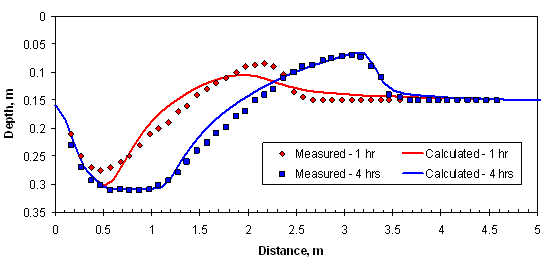
The figures below show a comparison between measured and computed bed elevations. | The figures below show a comparison between measured and computed bed elevations. | ||
[[Image: | [[Image:Thuc_Depth4hrs.png|thumb|left|600px| Figure 2. Computed bed elevations and current velocities at t=4 hrs.]] | ||
<br style="clear:both" /> | <br style="clear:both" /> | ||
[[Image:Thuc_Bed_Elevation.png|thumb|left|600px| Figure 3. Computed and measured bed elevations at t=1,4 hrs.]] | |||
[[Image:Thuc_Bed_Elevation.png|thumb|left| | |||
<br style="clear:both" /> | <br style="clear:both" /> | ||
== '''References''' == | == '''References''' == | ||
* Soulsby, R. (1997) "Dynamics of marine sands" Thomas Telford Publications, London. | |||
* Thuc, T. (1991) "Two-dimensional morphological computations near hydraulic structures", Doctoral Dissertation, Asian Institute of Technology, Bangkok, Thailand. | |||
---- | ---- | ||
[[Test_Cases]] | [[Test_Cases]] | ||
Latest revision as of 22:29, 22 October 2010
Setup
The rectangular flume has a narrow 0.2 m-wide inlet and a 3 m-wide outlet. The initial water depth was 0.15 m with a 0.16 m layer of 0.6 mm sand over a concrete bottom. The flume was 5 m long and 4 m wide. The measured sand settling velocity of 0.013 m/s was used. The computational mesh consisted of 62 rows and 69 columns (Figure 2). The computational time was 30 seconds. The transport equation which best fit the measurements was the Soulsby-van Rijn (1997).

Results
The figures below show a comparison between measured and computed bed elevations.


References
- Soulsby, R. (1997) "Dynamics of marine sands" Thomas Telford Publications, London.
- Thuc, T. (1991) "Two-dimensional morphological computations near hydraulic structures", Doctoral Dissertation, Asian Institute of Technology, Bangkok, Thailand.