CHETN-IV-69: Difference between revisions
m Unprotected "CHETN-IV-69" |
m 2 revisions: Import from Fault |
| (One intermediate revision by the same user not shown) | |
(No difference)
| |
Latest revision as of 21:56, 8 September 2011

Tips for Developing Bathymetry Grids for Coastal Modeling System Applications
PURPOSE: This Coastal and Hydraulics Engineering Technical Note (CHETN) contains practical advice and guidance on development of numerical model bathymetry grids for Coastal Modeling System (CMS) application. These tips can improve accuracy of simulations, make modeling more efficient, and help avoid common pitfalls that degrade simulation results. Most tips are applicable to other types of numerical models of nearshore hydrodynamics. Emphasis is given to the complex hydrodynamic and morphologic environment of coastal inlets.
CITATION:
 Brown, M. E., and N. C. Kraus. 2007. Tips for developing bathymetry grids for Coastal Modeling
 System Applications. Coastal and Hydraulics Laboratory Engineering Technical Note ERDC/CHL
 CHETN-IV-69. Vicksburg, MS: U.S. Army Engineer Research and Development Center.
INTRODUCTION: The governing equations of engineering numerical models of coastal process represent the leading physical phenomena associated with wave transformation, circulation produced by various forcing mechanisms, sediment transport, and morphology change. Processes such as wetting and drying, non-erodable bottom, and avalanching of steep slopes can also be described (Buttolph et al. 2006). Typically, the reliability of a simulation depends more on the quality of the input forcing data and the bathymetry data, and less on representation of the physics or on the numerical solution approach. Common forcing conditions are tide, wind, offshore waves, river discharges, and their combination. This CHETN concerns development of grids that represent the bathymetry (water depth), topography (land elevations above typical water level datum), structures such as jetties and breakwaters, and the land-sea boundary (shoreline on ocean and bay perimeters) for two-dimensional (2-D) depth-averaged circulation models and wave models. The accuracy and resolution to which such features should be represented depends on study goals and desired efficiency of the modeling. The reliability of a coastal modeling application depends directly on the accuracy and consistency of the bathymetry data entered on the grid.
Long waves are waves with length much greater than the water depth. Such waves include the tsunami, tide, and seiches in lakes. Long waves travel at the speed (gh)1/2, where g = acceleration due to gravity, the value of which depends slightly on latitude, and h = water depth. If the bathymetry of a modeling grid suffers a systematic translation up or down (typically caused by a vertical datum shift), then the calculated long waves and associated water level and current will be compromised over the entire grid. Similarly, if channels are not correctly represented, speed of the wave will be altered. Misrepresentation of channel depth is a typical source of phase error between calculated water level and measured water level in the more distant reaches of bays. Ocean waves break at a certain depth in shallow water, typically generating a significant current and sediment transport. Calculation of both the location and pattern of wave breaking and the wave-induced current depend on the bathymetry grid. All these processes are represented and can interact in the CMS.
Once a bathymetry grid is created and tested, it is rarely inspected during production simulation runs. The proverb “A good beginning makes a good ending” is therefore appropriate to the task of grid development.
BEGINNING OF MODELING STUDY: If the modelers and key personnel involved are not familiar with the study area, then a site visit should be made. At that time, the study sponsors can point out concerns and various features of interest. Condition of the jetties and shoreline, the general circulation pattern, type of sediment, and recent changes and distinguishing features can be noted. Historic and recent aerial photographs, preferably vertical photographs that can be rectified, should be assembled, from which locations of structures and shorelines can be read from geo-referenced images. Those with local knowledge can be interviewed to learn about the presence of sand shoals and strong or weak currents. At this point, a meeting of the modeling team and Project Delivery Team is beneficial to review modeling objectives and essential features governing the waves, circulation, and sediment transport at the site. It is possible that several bathymetry grids may need to be developed that represent a past condition, existing condition, and the engineering alternatives under consideration.
INFORMATION AND DATA GATHERING: In the following, the phrase “bathymetry grid” unless otherwise noted refers collectively to marine and land elevation, shoreline position, and location and configuration of coastal structures. Coastal inlet applications are emphasized, for which all such data are required in CMS applications as performed in the Coastal Inlets Research Program (Hughes and Kraus 2006).
Sources of Bathymetry Data: Bathymetry data can be obtained from a variety of sources, and a full bathymetry grid typically consists of information from several surveys and databases. The accuracy and limitations of the surveys (and databases) should be understood, and the coverage documented through metadata. Occasionally, these surveys may contain random vertical errors that may adversely influence the simulations and should be identified and addressed (Byrnes et al. 2002; Johnston 2002).
At a minimum, the metadata set describing background of bathymetry data sources contains horizontal and vertical coordinate system information and units, and the date of the survey. A simulation conducted for a time interval close to the surveys is best for comparison with measurements, such as with National Oceanic and Atmospheric Administration (NOAA) water level measurements. If a non-tidal vertical reference datum was used in a survey, the metadata should provide a relationship of this datum to known tidal datums (particularly to mean sea level (msl) or to mean tide level (mtl)) for the site. For example, mean low tide is a non-tidal datum defined by the U.S. Army Engineer District, Galveston, because of the strong influence of wind tide along the coast and coastal inland waters of Texas (Kraus et al. 1997). Similarly, the International Great Lakes Datum is a survey datum in the Great Lakes. Tidal and nearshore circulation modeling is done with reference to msl, mtl, or mean water level (Great Lakes), so that the average amount of water is represented on the modeling grid through time. Often, bathymetric and land surveys are performed by reference to a geodetic datum such as National Geodetic Vertical Datum 1929 (NGVD 29), North America Vertical Datum 1988 (NAVD 88), to mean lower low water, or to a local survey datum, and a transfer must be made to the mean level of the water body being considered. Benchmark information for Federal water level stations can be found at: http://tidesandcurrents.noaa.gov
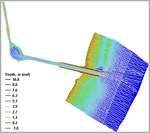
An example of boat survey track lines is shown in Figure 1 for Packery Channel Inlet, Corpus Christi, TX. To this local survey would be added available navigation channel survey data (channel cross sections), location of jetties as through rectified aerial photographs, and offshore and alongshore bathymetry data obtained through other surveys or databases. Specialized surveys of the bayside wetland and marshes might also be required, depending on application.
In assembling bathymetry data, the team should consider including topographic elevation information on the grid. Typically, in modeling a beach or other gently sloping shore, it is desirable to include a certain distance above msl to account for flooding and drying during typical storms. Depending on local tidal range, 1 to 3 m of topographic elevation is usually sufficient, but in some modeling efforts (such as in conducting surge modeling or in representing rivers with great change in water level), 4 m or more of elevation may be needed for improved accuracy of the modeling.
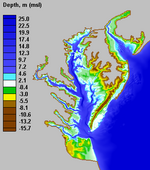
As an example of the necessity of including substantial topographic features, the U.S. Army Engineer Research and Development Center (ERDC) Coastal and Hydraulics Laboratory (CHL) applied this technique in developing a numerical model grid for Chesapeake Bay, MD, surge study (Lin et al. 2004). The U.S. Geological Survey (USGS) Digital EEM database, GTOPO30 – 30-sec arc resolution (http://edcdaac.usgs.gov/gtopo30/gtopo30.asp) was consulted to include low-land topography on the grid to an elevation of 10 m above mtl. Representation of inland basins and valleys allowed simulation of water storage capacity for the surge caused by numerous tropical and extra-tropical storms. An image showing the final grid for this study is given in Figure 2.
Resources for obtaining elevation data include LIght Detection And Ranging (LIDAR) surveys such as from the U.S. Army Corps of Engineers (USACE) National Coastal Mapping Program (http://shoals.sam.usace.army.mil/Data/Data_Home.asp), NOAA’s 2-min resolution topographic datasets, ETOPO2 (http://www.ngdc.noaa.gov/mgg/image/2minrelief.html), and USGS sites such as the Seamless Data Distribution System (http://seamless.usgs.gov/).
Datum Conversion: Surveys are converted to a common horizontal and vertical datum to serve as the geometric basis for a study grid. For example, the CMS requires that all calculations be made on a Cartesian system and with metric units. If the survey or bathymetry source is in curvilinear horizontal coordinates (Geographic coordinates) with the vertical units of feet, then each point in the file is converted before implementation. Datum conversions are documented before initiating numerical modeling. The benchmark nearest the study area should be chosen as the reference coordinate frame. Then each survey should be transformed from its native frame to the reference frame and the converted data and associated metadata saved to disk for future applications and for documentation of study development.
In addition to local surveys at a study site, bathymetry information can be obtained from various sources. Some resources are NOAA’s geophysical data system (GEODAS) for nearshore areas and coastal relief model grids for all United States and Puerto Rico for deeper water areas.
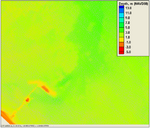
Most hydrodynamic and some wave models allow shallow cells or nodes to wet and dry as the tidal signal propagates from the forcing boundary. If the models applied in your study have this feature, then additional land information may be needed. Another resource that may be available depending of location is the scanning hydrographic operational airborne LIDAR surveys, called SHOALS or CHARTS survey (http://shoals.sam.usace.army.mil/). These types of datasets are densely populated, having a minimum distance between data points of 0.3 m, with approximately 1 m being the average. A USACE utility that is helpful for working with all types of survey data is the Surface-water Modeling System (SMS). In loading this type of survey file into the SMS (Zundel 2000), a filtering tool is available to automatically reduce the total number of points, either by reading every nth point or by setting a minimum allowable distance between points. For the latter case, the SMS ignores all points within the specified tolerance. A 625 sq m sample displaying every third point is shown in Figure 3. The SMS interface can save a scatter set in a binary format called the eXtensible Model Data Format (XMDF). The XMDF format (Butler et al. 2007) stores data in a much smaller file and decreases the time to load large data files, such as SHOALS or LIDAR surveys. Operation in XMDF format rather than ASCII format greatly reduces time of input and output operations.
Some numerical models represent depths with positive values, whereas others require negative values. The modeling team will be aware of the sign convention required and create multiple bathymetry sets files specifically for each type. The CMS, which integrates several models, operates with the positive depth convention, meaning that topography (values above msl) are negative.
Merging Bathymetry Data Sets: After all survey sets and sources of depth and elevation information have been converted to a common horizontal and vertical reference datum, then they may be combined and serve as the source for numerical modeling grid(s). Each source of information is loaded into the SMS and is represented by sets of points (scatterpoint sets) and can be given a descriptive name for referencing. Once all sets are loaded, the SMS can merge them into a single geometric surface.
The recommended method for combining bathymetry sets is to merge in some order of priority. A priority must be considered because, in many applications, there are data overlaps in the information obtained. Within the SMS, the user can specify which sets are assigned higher priority if overlap occurs. Points in a set with lower priority are covered by points of higher priority and are not carried forward into the final merged set. If there is no overlap, then all points are merged.
Inspection of Data: Once an apparent final set containing all relevant data is generated, visual inspection of the combined dataset is recommended to anticipate potential problems. The modeling team should pay attention to various key features to ensure they are represented appropriately. Such features include jetties, breakwaters, channels, ebb shoals, flood shoals, islands, bridge piers, weirs, and the shoreline. If needed, additional points with a depth or elevation value can be entered by hand to improve the representation. Care must be given to slopes of navigation channels and structures. For example, specifying an unrealistically steep slope for a channel (steeper than the angle of bottom material repose) may trigger avalanching in the CMS if the sediment transport capability is activated. Because scatter points are unstructured, they are triangulated prior to interpolation to the CMS grid. This ensures all cells which lie between scatter points receive correctly weighted bathymetry values. Occasionally, artificial dams are inadvertently introduced during triangulation, and manual editing is necessary to remove the dams.

Three images in Figure 4 show how improper triangulation can lead to blocked channel representation. For this case, scatter points defining the edge of the channel triangulated across the channel (center image), essentially blocking all flow (left image). After a few scatter triangles in the affected area were manipulated, the problem is resolved (right image).
Back-up Data: It is recommended to create a backup file of the merged and checked scatterpoint set, especially if a significant amount of work was required in representing features appropriately. The backup will save time required to redo this work later if necessary. The SMS presently has no “undo” feature, which means if the dataset is inadvertently mishandled, all fine tuning and pre-processing work done to this point would have to be repeated. This is also a good time to check with the full team and sponsor to assure the grid represents all features of interest in the time period of the alternative being described.
NUMERICAL FRAMEWORK (GRID) CONSIDERATIONS: In addition to bathymetry, topography, representation of structures and channels, and slopes, other model- and application-specific decisions should be considered in constructing a grid.
Grid Resolution and Domain: Greater resolution is typically needed close to key features such as coastal inlet channels and jetties, and lower resolution is likely allowable and desirable elsewhere. Ensure that sufficient distance is given between the more resolved areas and the lateral and seaward edges of the domain. The project area typically consists of the inlet, ebb shoal, attachment bar, bypassing bar, and jetty on the ocean side. As a rule of thumb, this area should be centered horizontally on the grid and take up at most one-third of the horizontal distance between the two lateral edges of the domain. For example, if the area of interest is 500 m across, then horizontal distance to both lateral edges of the domain should be at least 750 m from the study area, but may possibly be at greater distance dependent of the forcing required for the project, uniformity of bathymetry at the lateral boundaries, shoreline configuration, and other site-specific considerations. The grid should have minimal bathymetric variability for several cells inward from the lateral domain edge for proper forcing. Manual editing of depth values is sometimes needed to ensure consistency.
The grid must adequately represent the distance from shore to the seaward boundary as well as bay features, as needed. As an example, the full extent of the ebb jet of a coastal inlet must be represented without distortion by impinging on the boundary. Consideration must be given to the ebb current offshore and laterally, and to ebb shoal morphology. A similar requirement holds for the flood current and flood shoal. If possible, it is best to place the offshore edge of the grid on a relatively constant bathymetry contour, where the grid will receive boundary condition forcing.
It is recommended to anticipate the requirements of all alternatives to be simulated and place adequate resolution in the appropriate locations. For example, adequate planning will ensure a one-to-one correspondence of comparison points for post-processing comparisons of simulations. Otherwise, interpolation or extrapolation errors could be introduced into the comparisons.

Grid Creation Tips: The CMS operates with a finite-difference solution method for solving the governing equations, and it allows variable-sized rectangular cells. Representing certain features with rectangular cells can be challenging, especially with curving structures. Straight jetties may have to be represented with a line of staggered cells, appearing to have a stair-stepped edge. Sometimes, staggered cells can be avoided or minimized through planning in the early stage of grid preparation. One technique is to determine the angle of the main jetty or jetty pair that is to be considered and, in building the grid, using this angle as the grid orientation. After the grid has been created, this jetty can be represented with a straight line arrangement of the cells. A comparison of how orientation can be represented in a CMS grid is shown in Figure 5.

A significant amount of time may have to be invested into adding necessary definition of slopes and structures into the base bathymetry. Sufficient resolution must be created within the CMS grid to accurately relay this information properly. Typically, a coastal inlet simulation will contain a minimum of five to ten cells between jetties and island edges to accurately represent the current and sediment transport, which may have strong horizontal variations in the vicinity of jetty ends. Adequate representation of channel and structure bottom slope should also be considered. For a jetty, a minimum of three cells is required to identify the crest and toe. However, increasing the number of cells to describe the jetty gives additional definition of the structure. An illustration of using three versus five cells to define a jetty is shown in Figure 6. Similarly, for channels not narrowly bounded by island walls, at least five cells are needed – two cells defining the top of each channel bank, two cells defining the mid-point of each bank, and at least one cell defining the bottom.

A facilitating technique is to obtain geo-referenced images of the study area. A high-quality image not only helps in proper alignment of structures and quality checking of the widths of channels and jetties, but it is also valuable for reports to the sponsor. A readily understood image allows the sponsor to see how closely the numerical grid and identifiable features compare with their true sizes and locations. Individuals viewing the study results may not be familiar with numerical simulations; adding a background photograph will orient the reader to study procedure and findings. An example of a grid overlaying an image is shown in Figure 7. If vertical aerial photographs are not available, one resource for topographic charts and aerial photographs for most of the United States can be found at the Terraserver Imagery database (http://terraserver.microsoft.com). This image server is also available within the SMS via the “Get Data Tool” in the Map Module.
Final Resolution Determination: There is a tradeoff in amount of detail placed in a grid and model execution time. Although it might seem ideal to have fine grid spacing everywhere in the domain, needless calculations would be made for areas of limited interest and locations that could be accurately calculated with coarse resolution, unnecessarily increasing model runtime.

Beyond the study area, bays may not need the amount of resolution as the corresponding features near to and at a coastal inlet, for example, where the current can be strong and change direction in a complex way. Regardless of the resolution, the volume storage in peripheral water bodies should not be compromised, as misrepresentation can degrade model accuracy. Similarly, inlets and channels should be taken into account. The example shown in Figure 8 depicts two wave grid representations for Rudee Inlet, VA. A preliminary CMS grid with constant 3-m cell spacing resulted in a total of 356,000 active cells (shown on the left section of Figure 8). After several iterations of modifying resolution, a production run grid was developed with variable cell spacing of 6 to 50 m with the greatest resolution in the inlet channel (shown on the right section of Figure 8). This final grid contained only 15,000 computational cells for a 96 percent reduction in size.
If variable spacing is employed, the modeler must also be aware of possible aspect ratio constraint issues for cell side dimensions (Δx and Δy). It is recommended that the ratio between Δx and Δy for active cells be no greater than 1:5 to avoid potential for introducing error or instability in the calculations.
USING THE SMS TO BUILD GRIDS FOR CMS SIMULATIONS: Stages of creating CMS grids outlined in this section refer to SMS Version 10.1. The SMS is a powerful interface that facilitates grid creation, visualization, and pre- and post- processing of information related to a CMS application, and the interface supports many other USACE numerical models. The user must load all of the data covered in this note into the SMS interface. These data may consist of geo-referenced aerial photographs, ArcGIS/ArcInfo shape files, Autocad DXF files, multiple survey datasets, and even other numerical model grids.
Conceptual Model: Once all desired data sets are loaded, a conceptual model can be built that defines the domain, bathymetry source(s), refinement method and zones, and grid orientation. This conceptualization is the first step in the process and promotes detection of the effect of small changes before the production-run CMS grids are developed. In the event that changes are required after the final grid has been created, then the saved conceptual model can be edited and a modified grid can be created. The processes of creating CMS flow and wave grids are similar because both model types use the finite-difference solution method. The wave grid should be created with a slightly larger domain than the hydrodynamic and sediment transport grid (at least one cell larger on all sides) because information for each cell is stored differently for each model. This procedure will avoid error accumulation that might accompany extrapolation of wave information to the lateral boundaries.
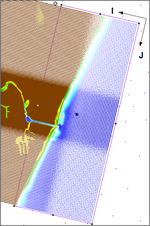
The process of building conceptual models is started within the Map module of the SMS. The user must select which model SMS will be creating by changing the coverage type to either “CMS-Flow” or “CMS-Wave.” To do this, create a new coverage by right clicking on "Map Data" located in the data tree. Then click "Type", "Models", and finally either "CMS-Flow" or "CMS-Wave". A grid frame should then be created to define the orientation (rotation), position and size of the grid. If a CMS-Wave coverage was selected, ‘I’ corresponds with the direction that the wave will propagate and should always be directed onshore. An IJ Triad specifies the direction of grid orientation and is located at the point of origin. Typically, a triad contains three direction components (I, J, and K); however, for 2-D grids, the K direction is the same as vertical coordinate z and is not referenced. An example is shown in Figure 9. For a non-rotated grid, I corresponds to the x axis (to the right), and J corresponds with the y axis (to the top).
For the CMS-Flow coverage, the point of origin will be automatically placed in the lower left corner of the grid after the grid has been created in the next steps. After the grid frame has been sized and rotated as needed, the user then instructs the SMS to convert the Map objects to a 2-D Grid. A new interface screen will appear and give the user the opportunity to define the cell spacing.
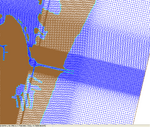
Grid Resolution. The model user has two options. The first is to select a constant cell size for the x and y horizontal directions separately. The second option is to define “refine points” to create variable cell spacing. Once the refine points are created, the user should select each refine point and alter its attributes to give the desired X and Y spacing surrounding that point. This option allows for larger cell sizes where high resolution is not required and smaller cell sizes needed to resolve channels and structures. Once all refine points have been created and assigned values, the user would convert the grid frame to a cartesian grid by selecting "Feature Objects" | "Map -> 2D Grid" from the pulldown menus, then select the "Refine Point" option and give the bias and maximum cell size for the domain. The user would then specify which scatterpoint dataset will define depth and elevation values. Once the bathymetry dataset is selected, cell spacing has been specified, and fine tuning of domain size and rotation completed, SMS generates a computational grid with a single command. By evaluating the resulting grid, and modifying the input parameters for that grid in the conceptual model, a final CMS grid can be generated. An example of a CMS grid with variable spacing (greater resolution in the inlet, coarser resolution elsewhere) is shown in Figure 10.
CARTESIAN GRID MODULE: Once the 2-D computation grid has been generated from the conceptual model, the user switches to the Cartesian grid module within the SMS to specify model parameters, boundary conditions and make final adjustments to the grid itself. The SMS examines each cell’s interpolated bathymetry value to determine whether that cell should be defined as inactive or active. An inactive cell does not enter into numerical computations and is always considered as land. An active cell is initially defined to be wet if the depth value is positive and dry if the depth value is negative. Active cells can change from wet to dry and vice versa depending on water level in that cell at a particular time step. Within the CMS, inactive cells are treated as vertical walls if adjacent to active, wet cells.
Presently, the SMS changes any cell with a depth value of 0 or less (negative) to an inactive cell, and all others are created as active cells. If the user desires to model areas above msl to any extent, the appropriate areas must be selected and the status of those cells changed to “Active” so they may enter into computations if they become wet.
The Cartesian grid module is also used to increase or decrease row and column spacing, edit bathymetry on a cell-by-cell basis, define model run-time parameters, generate wave spectra for the CMS wave grid, and to assign cell-specific parameters for the CMS.
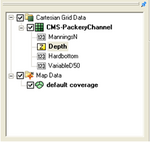
CELL-SPECIFIC PARAMETERS: Various parameters may be represented on a cell-by-cell basis for CMS circulation and sediment transport calculations. Three such parameters are the Manning friction parameter, n, variable median grain size (D50), and maximum erodible depth if running with sediment transport activated. It is recommended to discuss these parameters with the study team and decide on the locations and values to be assigned. The SMS interface screen for these parameters is shown in Figure 11.
The default Manning value for n is 0.025; however, the user can alter this value in specific areas. Possible justification for increasing friction in certain areas might be the presence of mud flats or areas with submerged vegetation. In modeling sediment transport and if the grid contains regions underwater that will not erode such as weirs, jetty tips or flanks, or patches of hard bottom, nonerodable cells must be defined in the grid. The values for maximum erodible depth can be entered into the appropriate dialog within the SMS interface and saved together with the grid. The CMS will not allow these cells to erode beyond the specified value. Sediment will still be allowed to accumulate at each cell and then erode to the maximum level. Likewise, the grain size for each cell can be set by the model developer. The CMS default value for grain size is 0.2 mm, but this can be set to a different value as needed.
It is emphasized that the greatest source of error or uncertainty in CMS and other modern coastal processes models arises from limitations in bathymetry data and forcing data. Adjustment of bottom friction and D50 values is usually not necessary if the bathymetry and forcing data are reliable and accurately entered.
ADDITIONAL INFORMATION: This CHETN is a product of the Program Management Work Unit of the Coastal Inlets Research Program (CIRP) being conducted at the U.S. Army Engineer Research and Development Center, Coastal and Hydraulics Laboratory. Questions about this technical note can be addressed to Mitchell E. Brown (Voice: 601-634-4036, Fax: 601-634-2055, e-mail: Mitchell.E.Brown@usace.army.mil). For information about the Coastal Inlets Research Program (CIRP), please contact the CIRP Program Manager, Dr. Nicholas C. Kraus at 601-634-2016 or at Nicholas.C.Kraus@usace.army.mil. The CHETN benefited from technical reviews by Dr. Adele M. Buttolph, Dr. Jack E. Davis, and Dr. Alan K. Zundel. This document should be cited as:
Brown, M. E., and N. C. Kraus. 2007. Tips for developing bathymetry grids for Coastal Modeling System Applications. Coastal and Hydraulics Laboratory Engineering Technical Note ERDC/CHL CHETN-IV-69. Vicksburg, MS: U.S. Army Engineer Research and Development Center.
REFERENCES
Butler, C. D., D. R. Richards, R. M. Wallace, N. L. Jones, and R. Jones. 2007. eXtensible Model Data Format (XMDF). Coastal and Hydraulics Laboratory Special Report ERDC SR-07-1. Vicksburg, MS: U.S. Army Engineer Research and Development Center.
Buttolph, A. M., C. W. Reed, N. C. Kraus, N. Ono, M. Larson, B. Camenen, H. Hanson, T. Wamsley, and A. K. Zundel. (2006). Two-dimensional depth-averaged circulation model CMS-M2D: Version 3.0, Report 2: Sediment transport and morphology change. Coastal and Hydraulics Laboratory Technical Report ERDC/CHL-TR-06-7. Vicksburg, MS: US Army Engineer Research and Development Center.
Byrnes, M. R., J. L. Baker, and F. Li. (2002). Quantifying potential measurement errors associated with bathymetric change analysis. Coastal and Hydraulics Laboratory Engineering Technical Note ERDC/CHL CHETN-IV-50. Vicksburg, MS: U.S. Army Engineer Research and Development Center, Coastal and Hydraulics Laboratory, http://cirp.usace.army.mil/pubs/chetns/chetn-iv-50.pdf.
Hughes, S. A., and N.C. Kraus. 2006. Frequently-Asked Questions (FAQs) about coastal inlets and the U.S. Army Corps of Engineers’ Coastal Inlets Research Program (CIRP). Coastal and Hydraulics Laboratory Technical Note ERDC/CHL CHETN-IV-67. Vicksburg, MS: U.S. Army Engineer Research and Development Center, http://cirp.usace.army.mil/pubs/chetns/chetn-iv-67.pdf.
Johnston, S. 2002. Uncertainties in bathymetric surveys. Coastal and Hydraulics Laboratory Engineering Technical Note CHETN-IV-59. Vicksburg, MS: U.S. Army Engineer Research and Development Center, http://chl.erdc.usace.army.mil/library/publications/chetn/pdf/chetn-iv-59.pdf.
Kraus, N. C., C. I. Thurlow, D. J. Heilman, A. Lindquist, and M. W. Earle. 1997. Needs assessment for water level gauging along the Texas coast for the U.S. Army Corps of Engineers, Galveston District. Coastal and Hydraulics Laboratory Technical Report CHL-97-29. Vicksburg, MS: U.S. Army Engineer Waterways Experiment Station.
Lin, L., M. A. Cialone, and G. P. Bass. 2004. Hurricane Isabel storm surge model simulation for Chesapeake Bay. Hurricane Isabel in Perspective Conference, 15-17 November 2004, ASCE. Virginia Beach, VA.
Zundel, A.K. 2000. Surface-water modeling system reference manual. Provo, UT: Brigham Young University, Environmental Modeling Research Laboratory.