Publications:CIRP-WN-11-2: Difference between revisions
No edit summary |
mNo edit summary |
||
| (68 intermediate revisions by 3 users not shown) | |||
| Line 1: | Line 1: | ||
{{DISPLAYTITLE:Salinity Calculations in the Coastal Modeling System}} | |||
<p style="margin:0; background:#2580a2; font-size:20px; font-weight:bold; border:1px solid #a3bfb1; text-align:left; color:#FFF; padding:0.2em 0.4em;">CIRP-WN-11-2</p> | |||
'''''by Honghai Li, Christopher W. Reed, and Mitchell E. Brown''''' | <div style="text-align:left">'''''by Honghai Li, Christopher W. Reed, and Mitchell E. Brown'''''</div><br/> | ||
__TOC__ | |||
==PURPOSE== | |||
This Coastal and Hydraulics Engineering Technical Note (CHETN) describes procedures to calculate salinity change within the Coastal Modeling System (CMS) operated in the Surface-water Modeling System (SMS), version 11. The CMS is a hydrodynamic and transport model designed for coastal and inlet applications and the SMS is a graphical user interface utility for PCs as developed by the U.S. Army Corps of Engineers (USACE). The procedure and the CMS verification are illustrated by the salinity modeling in a coastal inlet system at Humboldt Bay, CA, and in a wetland area of Breton Sound estuary, LA. | |||
==CITATION== | |||
H. Li, C. W. Reed, and M. E. Brown. 2010. Salinity Calculations in the Coastal Modeling System. <br> Coastal and Hydraulics Engineering Technical Note ERDC/CHL CHETN-IV-XX. Vicksburg, MS: <br> U.S. Army Engineer Research and Development Center. | |||
In | ==INTRODUCTION== | ||
Salinity refers to the salt content of water, with values ranging from 0 for fresh water to 31-35 ppt (parts per thousand) for ocean water. In water bodies with poor mixing and limited water exchange, or those experiencing high evaporation, salinity can be greater and lead to formation of brine. Table 1 presents typical values and nomenclature for describing the degree of water salinity: | |||
{| class="wikitable" border="2" style="text-align: center; width: 350px;" | |||
|+ Table 1. Water salinity. | |||
! Fresh Water !! Brackish Water !! Saline Water !! Brine | |||
|- | |||
|< 0.05 % || 0.05 - 3 % || 3 - 5 % || >5 % | |||
|- | |||
| < 0.5 ppt || 0.5 - 30 ppt || 30 - 50 ppt || > 50 ppt | |||
|} | |||
In coastal zones and estuaries, both temporal and spatial variations in salinity are controlled by changes in circulation, waves, tides, precipitation, evaporation, and freshwater inflows. These changes in salinity can have major effects on water density and water stratification, changing circulation patterns. Dynamic behavior of suspended sediment can be controlled by the salinity-driven flow and mixing. Any sustained changes to salinity can directly change the aggregation and consolidation of cohesive sediment as well (Nicholson and O’Connor 1986). Salinity can also alter the water chemistry that is closely related to marine organisms. Distribution and abundance of marine life will change water turbidity and define water quality in coastal and estuarine systems. Modifications of coastal inlets, such as channel deepening and widening and rehabilitation or extension of jetties may alter the salinity distribution within the estuary. | |||
CMS Flow is forced by water surface elevation (e.g., from tide), wind and river discharge at the model boundaries, and wave radiation stress and wind field over the model computational domain. Physical processes pertinent to the present study calculated by CMS Flow include wave-current interaction, sediment transport, morphology change, and representation of non-erodible bottom (reef). Additional capabilities include wetting and drying, space-varying bottom-friction, salinity transport, efficient grid storage in memory, and hot-start options. | ==COASTAL MODELING SYSTEM== | ||
The CMS calculates water levels, currents and waves through the coupling between a hydrodynamic model, CMS-Flow and a wave spectral model, CMS-Wave. These two models can also interact dynamically to simulate sediment and salinity transport, and morphology change (Buttolph et al. 2006; Lin et al. 2008). *CMS is available in an explicit version, discussed herein, and an implicit version which is being tested.* | |||
CMS Flow is a finite-volume model that solves the mass conservation and shallow-water momentum equations of water motion. The model can run in a two-dimensional (2D) mode based on the depth-integrated Navier-Stokes equations, *or a three-dimensional (3D) mode presently in developmental testing*. CMS Flow is forced by water surface elevation (e.g., from tide), wind and river discharge at the model boundaries, and wave radiation stress and wind field over the model computational domain. Physical processes pertinent to the present study calculated by CMS Flow include wave-current interaction, sediment transport, morphology change, and representation of non-erodible bottom (reef). Additional capabilities include wetting and drying, space-varying bottom-friction, salinity transport, efficient grid storage in memory, and hot-start options. | |||
CMS Wave is a 2D steady-state (time-independent) spectral wave transformation model. The model contains theoretically derived approximations of wave diffraction, reflection, and wave-current interaction for wave simulations at coastal inlets with jetties and breakwaters. It employs a forward-marching and finite-difference method to solve the wave action conservation equation. CMS-Wave operates mainly on a coastal half-plane, so primary waves can propagate only from the seaward boundary toward shore. In the full-plane mode, CMS Wave performs the backward-marching for seaward spectral transformation after the forward-marching is completed. | CMS Wave is a 2D steady-state (time-independent) spectral wave transformation model. The model contains theoretically derived approximations of wave diffraction, reflection, and wave-current interaction for wave simulations at coastal inlets with jetties and breakwaters. It employs a forward-marching and finite-difference method to solve the wave action conservation equation. CMS-Wave operates mainly on a coastal half-plane, so primary waves can propagate only from the seaward boundary toward shore. In the full-plane mode, CMS Wave performs the backward-marching for seaward spectral transformation after the forward-marching is completed. | ||
===SALINITY CALCULATIONS IN CMS=== | |||
The CMS calculates the salinity field based on the following 2D salinity conservation equation: | |||
<math>{\partial (Sd)}{\partial t}+\frac{\partial (S{{q}_{x}})}{\partial x}+\frac{\partial (S{{q}_{y}})}{\partial y}=\frac{\partial }{\partial x}\left[ {{K}_{x}}d\frac{\partial S}{\partial x} \right]+\frac{\partial }{\partial y}\left[ {{K}_{y}}d\frac{\partial S}{\partial y} \right]+(P-E)S | |||
<math> | \qquad\qquad\text{(1)}</math> | ||
where S is depth-averaged salinity; d is total water depth, qx and qy are flow per unit width in the x- and y-axis direction, respectively; Kx and Ky are diffusion | where S is depth-averaged salinity; d is total water depth, qx and qy are flow per unit width in the x- and y-axis direction, respectively; Kx and Ky are the salt diffusion coefficients in the corresponding x- and y-axis directions, and P and E are precipitation and evaporation in m/year, respectively. Equation (1) represents the horizontal fluxes of salt in water bodies and is balanced by exchanges of salt via diffusive fluxes. Major processes contributing to the salinity are freshwater inflows from rivers, vertical fluxes of freshwater by precipitation and evaporation at the water surface, and groundwater fluxes, which can be specified as the surface and bottom boundary conditions in the equation. | ||
{{Image|Figure1.png|150px|'''Figure 1. Humboldt Bay, CA.'''}} | |||
{{Image|Figure2.png|150px|'''Figure 2. CMS domain, quadtree grid, and bathymetry.'''}} | |||
{{Image|Figure3.png|150px|'''Figure 3. Files for the CMS-Flow salinity simulation.'''}} | |||
{{Image|Figure4.png|150px|'''Figure 4. Setting up the salinity calculation.'''}} | |||
{{Image|Figure5.png|150px|'''Figure 5. Specifying spatially varied initial salinity.'''}} | |||
{{Image|Figure6.png|150px|'''Figure 6. CMS-Flow data tree.'''}} | |||
{{Image|Figure7.png|150px|'''Figure 7. Salinity boundary types in the CMS.'''}} | |||
{{Image|Figure8.png|150px|'''Figure 8. Salinity specifications along the WSE-forcing boundary.'''}} | |||
{{Image|Figure9.png|150px|'''Figure 9. Salinity boundary input from a xys file.'''}} | |||
''' | {{Image|Figure10.png|150px|'''Figure 10. Salinity and current distributions during (a) the flood current and (b) the ebb current.'''}} | ||
{{Image|Figure11.png|150px|'''Figure 11. CMS computational domain and data collection locations.'''}} | |||
{{Image|Figure12.png|150px|'''Figure 12. Salinity and velocity sampling stations (URS 2010).'''}} | |||
Figure | |||
{{Image|Figure13.png|150px|'''Figure 13. Salinity comparisons between measurements and CMS calculations (URS 2010).'''}} | |||
===MODEL ASSUMPTIONS=== | |||
CMS-Flow is presently capable of 2D salinity computations in both the explicit and implicit solvers. 3D representation of salinity in the CMS, discussed herein, is being tested. The simulation of salinity can often require a 3D solution due to the presence of vertical salinity gradients that can significantly influence flow. It is therefore important to understand the limitations of 2D salinity simulations, and apply them only when the assumptions inherent in 2D simulations are valid. Typically, 2D salinity calculations are valid when the salinity is well mixed over the water column. These conditions are usually met for shallow bays with open exchanges to the ocean or gulf, dominant tidal signals, and sufficient wind energy to provide the vertical mixing. Also, the assumption of sufficient energy to mix over the water column is valid under storm conditions, even for deeper water bodies. Finally, when the exchange with the open sea is restricted by an inlet, the tidal range is an important indicator of vertical mixing conditions. For low tide ranges, significant vertical stratification can occur, even in shallow bays and estuaries, especially when the winds are calm. Pritchard (1955) and Cameron and Pritchard (1963) have classified estuaries using stratification and salinity distribution as the governing criteria, and these classifications can be used for guidance in applying the 2D simulations. | |||
The lateral mixing for salinity in the CMS Flow model is the same as the lateral mixing in the momentum equations. | |||
==SALINITY MODELING AT HUMBOLDT BAY, CA== | |||
In this section, the salinity modeling is described to demonstrate the CMS capability at Humboldt Bay, CA. | |||
Humboldt Bay is a natural multi-basin, bar-built, coastal lagoon located along the rugged North Coast of California. The bay entrance is protected by dual rubble-mound jetties from the high-energy waves at the Northeast Pacific coast (Figure 1). Wave-induced long-shore current, nearshore wave breaking, and wave-dependent mixing have a significant contribution to momentum transfer in the water column, diffusive process and spatial distributions of salinity (Moon 2005). Tides and wind are the primary forcing to drive hydrodynamics and salinity transport inside the bay. | |||
Figure | |||
In application of the CMS to Humboldt Bay, a quadtree grid system was developed to discretize the bay and the offshore. The computational domain extends approximately 25 km alongshore and 20 km offshore, and the seaward boundary of the domain reaches to the 300 m isobath. Figure 2 shows the quadtree grid with 43,000 ocean cells and bathymetric features of Humboldt Bay, and adjoining nearshore and continental shelf. The CMS grid permits fine resolution in areas of high interest such as jetties, channels, and the bay. The implicit solver of the CMS with a large time step of 10 minutes was employed for the simulation. The implicit version of CMS typically reduces the computation time by more than 50% as compared ot the explicit version. | |||
CMS-Flow is driven by time-dependent water surface elevation at the offshore open boundaries, wind forcing over the surface boundary, and freshwater inflows from rivers and tributaries. Time varying salinity values are specified along the open boundaries and with the freshwater inflows. The initial salinity field needs to be specified to the entire CMS domain as well. | |||
'''1. CMS-Flow setup:''' The CMS hydrodynamic input files for Humboldt Bay, CA are required to be generated and prepared by the SMS shown in Figure 3: | |||
After opening “HB_Flow.cmcards” in the SMS, choose CMS-Flow | Model Control, click on the Salinity, and select the Calculate salinity (Figure 4). A time step of greater than (integer multiplier) or equal to the hydrodynamic time step should be specified. In this case, the Transport rate under the Time steps is set to 600 sec (equal to the hydrodynamic time step) for the salinity calculation. | |||
'''2. Salinity initial condition:''' Because of the large salinity range in a coastal system, it usually requires long spin-up periods for a salinity simulation to reach to the present salinity distribution, which could range from a few days to weeks. To shorten the spin-up time, an accurate initial condition for the salinity field should be specified. There are two options to assign the initial salinity condition in CMS-Flow: | |||
:'''i) A global initial salinity:''' Specify a constant initial value for the entire model domain. Figure 4 shows the example of using a constant 33.5 ppt as the global initial salinity value for the Humboldt Bay model. | |||
Figure 5 | |||
:'''ii) Spatially varying initial salinity:''' Generate a spatially varying initial salinity field by choosing the Spatially varied toggle under the Initial condition (Figure 5). Clicking the Create Dataset and assigning a value under the Default concentration (ppt) in the pop-up window will generate a new dataset with a constant initial salinity value. Clicking OK to close this window and then clicking OK to close the CMS-FLOW Model Control window, the dataset, Salinity Initial Concentration, will appear in the CMS-Flow data tree as shown in Figure 6a. Highlight the dataset to specify different salinity values in the CMS domain in the same way to modify other datasets such as D50 or Hard Bottom. | |||
(a | |||
The dataset for a spatially varying initial salinity can also be generated by using Data Calculator tool in the Data menu (Demirbilek et al. 2008). For an existing dataset, click the Select Dataset under the Spatially varied and then select the dataset for the initial salinity that already exists (Figure 6b). | |||
'''3. Salinity boundary conditions:''' Salinity conditions need to be specified at CMS-Flow boundaries. Two salinity boundary types are available in the CMS: water surface elevation (WSE) boundary (WSE-forcing boundary) and freshwater inflow boundary (Flow rate-forcing boundary) (Figure 7). | |||
i) WSE-forcing boundary: Using the Select Cellstring tool and clicking/highlighting, the cellstring of water surface elevation boundary can be specified as shown in Figure 7a. Selecting CMS-Flow | Assign BC will open the CMS-Flow Boundary Conditions window (Figure 8). A time series of salinity can be assigned along the WSE-Forcing boundary by clicking the Curve undefined under Salinity on the left hand side of the dialog. | :'''i) WSE-forcing boundary:''' Using the Select Cellstring tool and clicking/highlighting, the cellstring of water surface elevation boundary can be specified as shown in Figure 7a. Selecting CMS-Flow | Assign BC will open the CMS-Flow Boundary Conditions window (Figure 8). A time series of salinity can be assigned along the WSE-Forcing boundary by clicking the Curve undefined under Salinity on the left hand side of the dialog. | ||
The time series is specified either by clicking the Import button to read a salinity boundary input file in xys format (Figure 9) (Aquaveo 2010) or by manually entering time and salinity values in two separate data columns or by importing salinity data from an opened Excel file by Copy/Paste. | The time series is specified either by clicking the Import button to read a salinity boundary input file in xys format (Figure 9) (Aquaveo 2010) or by manually entering time and salinity values in two separate data columns or by importing salinity data from an opened Excel file by Copy/Paste. | ||
Because the WSE-forcing boundary of the Humboldt Bay grid is located outside the bay in open coast, salinity measurements at Trinidad Bay, approximately 18 km north of the CMS domain by CeNCOOS at Humboldt State University (2010), were assigned to the CMS-Flow open boundary. A 30-day time series of the salinity data is shown for the WSE-forcing boundary in Figure 8. Salinity at this location varies between 30.5 and 33.5 ppt that show apparent influence of the ocean on salinity variations during the period | Because the WSE-forcing boundary of the Humboldt Bay grid is located outside the bay in open coast, salinity measurements at Trinidad Bay, approximately 18 km north of the CMS domain by CeNCOOS at Humboldt State University (2010), were assigned to the CMS-Flow open boundary. A 30-day time series of the salinity data is shown for the WSE-forcing boundary in Figure 8. Salinity at this location varies between 30.5 and 33.5 ppt that show apparent influence of the ocean on salinity variations during the period. | ||
'''4. Flow rate-forcing boundary:''' Following the same steps as specifying WSE-forcing boundary, salinity values at freshwater inflow boundaries can be assigned together with flow specifications. | |||
Only a few rivers and creeks flow into Humboldt Bay and no stream measurements are available. Although small, there are seasonal variations in freshwater inflows to the bay. Relatively large amount of land runoffs flows into the bay during the rainy season in northern California from October to April. For demonstration purpose in this CMS application, 10 ppt was assigned for a constant river flow in the Elk River (Figure 7). A non-zero salinity value is given here considering that the location of the Flow rate-forcing cellstring is within the intertidal zone. | Only a few rivers and creeks flow into Humboldt Bay and no stream measurements are available. Although small, there are seasonal variations in freshwater inflows to the bay. Relatively large amount of land runoffs flows into the bay during the rainy season in northern California from October to April. For demonstration purpose in this CMS application, 10 ppt was assigned for a constant river flow in the Elk River (Figure 7). A non-zero salinity value is given here considering that the location of the Flow rate-forcing cellstring is within the intertidal zone. | ||
SIMULATION RESULTS | ===SIMULATION RESULTS=== | ||
For the Humboldt Bay demonstration, the CMS-Flow simulation was conducted for a 30 day winter period (December 2007). Depth-averaged current and salinity fields near the bay entrance channel were retrieved from two snapshots of the CMS results at Day 19 of the simulation, corresponding to the flood and ebb currents, respectively (Figure 10). | |||
The current speed is between 1 and 2 m/sec at the Humboldt Bay entrance during the flood and ebb tides. The bay is dominated by relatively high salinity water and low salinity water fills the downstream reach of the Elk River, consistent with the salinity specifications along the WSE-forcing and the Flow rate-forcing boundaries. Figure 10 shows that high salinity ocean water is brought into the bay by the flood current. A salt front near the mouth of the Elk River indicates that intrusion of freshwater plume into the bay. The plume is pushed upstream of the river by strong flood current passing by to the Arcata Bay and extends further into Humboldt Bay during the ebb tidal cycle. | The current speed is between 1 and 2 m/sec at the Humboldt Bay entrance during the flood and ebb tides. The bay is dominated by relatively high salinity water and low salinity water fills the downstream reach of the Elk River, consistent with the salinity specifications along the WSE-forcing and the Flow rate-forcing boundaries. Figure 10 shows that high salinity ocean water is brought into the bay by the flood current. A salt front near the mouth of the Elk River indicates that intrusion of freshwater plume into the bay. The plume is pushed upstream of the river by strong flood current passing by to the Arcata Bay and extends further into Humboldt Bay during the ebb tidal cycle. | ||
==SALINITY TRANSPORT MODELING AT WHITE DITCH AREA, LA== | |||
Located southeast of New Orleans on the coast of Louisiana, the White Ditch area has been experiencing the shortage of fresh water, sediments and nutrients from the Mississippi River, and saltwater intrusion due to sea level rise and storms. As a result, extensive wetland loss and degradation of tidal marshes have occurred in the area through the years. A hydrodynamic and salinity modeling analysis was conducted by URS (2010) to evaluate alternative designs for a fresh water diversion from the Mississippi River to the project area. | |||
SALINITY TRANSPORT MODELING AT WHITE DITCH AREA, LA | |||
CMS-Flow was developed for the White Ditch project. The model domain extends about 60 km along the NW-SE directions and about 30 km along the SW-NE direction, and includes the Mississippi River levees, the Mississippi River-Gulf Outlet (MRGO) channel, and other features (Figure 11). The size of the CMS grid cells ranges from 24 to 600 m with the fine grid along the White Ditch (Mississippi River) and the coarse grid in the Gulf of Mexico. | CMS-Flow was developed for the White Ditch project. The model domain extends about 60 km along the NW-SE directions and about 30 km along the SW-NE direction, and includes the Mississippi River levees, the Mississippi River-Gulf Outlet (MRGO) channel, and other features (Figure 11). The size of the CMS grid cells ranges from 24 to 600 m with the fine grid along the White Ditch (Mississippi River) and the coarse grid in the Gulf of Mexico. | ||
The CMS was driven by the tide data downloaded from U.S. Geological Survey (USGS) station (7374527) (Figure 11), Northeast Bay Gardene near Point- | The CMS was driven by the tide data downloaded from U.S. Geological Survey (USGS) station (7374527) (Figure 11), Northeast Bay Gardene near Point-a-La-Hache, LA (http://waterdata.usgs.gov/nwis). Rainfall data were obtained from the NOAA Port Sulfur Station (167471) and from the Belle Chasse station. Daily evaporation data were not available at the project area. Evaporation rates specified in the CMS were based on a study conducted by Cooke et al. (2008). Freshwater flows were measured from the Caernarvon Diversion and the Mississippi River. The New Orleans District, USACE, manages the Caernarvon Freshwater Diversion Project and provided daily flow information for the study. | ||
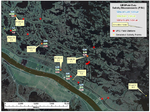
The salinity data for the CMS were collected on a field survey conducted from 20 July through 23 July, 2009 by URS. The sampling stations are shown in Figure 12. Flow velocity, temperature, salinity and turbidity were collected periodically between 21 and 23 July, 2009 at the primary stations (N1, N2, N3, S1, S2, and S3). Less frequent flow velocity, temperature and salinity measurements were collected at the secondary locations (Oak River Channel, N4, N5, N6, S4, S5, S6, S7, S8, S9, S10, and S11). | The salinity data for the CMS were collected on a field survey conducted from 20 July through 23 July, 2009 by URS. The sampling stations are shown in Figure 12. Flow velocity, temperature, salinity and turbidity were collected periodically between 21 and 23 July, 2009 at the primary stations (N1, N2, N3, S1, S2, and S3). Less frequent flow velocity, temperature and salinity measurements were collected at the secondary locations (Oak River Channel, N4, N5, N6, S4, S5, S6, S7, S8, S9, S10, and S11). | ||
| Line 115: | Line 121: | ||
The time- and depth-averaged salinity in this wetland area ranges from about 3 to 10 ppt. The variability of salinity is less than 1 ppt at the landward stations (Points 33-35) and can reach as high as more than 3 ppt at the seaward stations (Point 36) over the 4-day survey period. The salinity data show a general trend in the survey area. Salinity is relatively high at the southeast corner of the CMS domain in nearshore waters of the Gulf of Mexico, and decreases towards the northwest. High salinity also occurs along the east bank of the Mississippi River and decreases to the northeast of the CMS domain. The general trend indicates that significant sources of freshwater in the White Ditch area are from the Caernarvon Diversion. CMS-Flow tends to underestimate the salinity at some stations, but overall the CMS results show good agreement between measurements and calculated salinity, and well represent the spatial pattern and temporally averaged salinity levels. | The time- and depth-averaged salinity in this wetland area ranges from about 3 to 10 ppt. The variability of salinity is less than 1 ppt at the landward stations (Points 33-35) and can reach as high as more than 3 ppt at the seaward stations (Point 36) over the 4-day survey period. The salinity data show a general trend in the survey area. Salinity is relatively high at the southeast corner of the CMS domain in nearshore waters of the Gulf of Mexico, and decreases towards the northwest. High salinity also occurs along the east bank of the Mississippi River and decreases to the northeast of the CMS domain. The general trend indicates that significant sources of freshwater in the White Ditch area are from the Caernarvon Diversion. CMS-Flow tends to underestimate the salinity at some stations, but overall the CMS results show good agreement between measurements and calculated salinity, and well represent the spatial pattern and temporally averaged salinity levels. | ||
CONCLUSIONS | ==CONCLUSIONS== | ||
The depth-averaged salinity calculation procedure by the CMS was demonstrated in this technical note. The Humboldt Bay example shows that the procedures to set up the CMS for salinity calculation are straightforward and user-friendly. The White Ditch example provides an estuarine application of salinity calculations and verification for the CMS results, which well reproduce the spatial salinity distributions in the wetland area. Due to lack of measurements such as rainfall and evaporation, detailed bathymetry and salinity data, some assumptions were made for the study. Further improvement can be made as more data are collected in the future. | |||
==ADDITIONAL INFORMATION== | |||
This CHETN was prepared and funded under the Coastal Inlet Research Program (CIRP) and was written by Dr. Honghai Li (Honghai.Li@usace.army.mil, voice: 601-634-2840, fax: 601-634-3080) of the U.S. Army Engineer Research and Development Center (ERDC), Coastal and Hydraulics Laboratory (CHL), Dr. Christopher W. Reed (Chris_Reed@URSCorp.com) of URS Corporation, and Mitchell E. Brown (Mitchell.E.Brown@usace.army.mil) of ERDC, CHL. Alejandro Sanchez of CIRP provided hydrodynamic model information for the Humboldt Bay example. The CIRP Program Manager, Dr. Julie D. Rosati (Julie.D.Rosati@usace.army.mil), the assistant Program Manager, Dr. Nicholas C. Kraus, the Chief of the Coastal Engineering Branch at CHL, Dr. Jeffrey P. Waters, and Dr. Lihwa Lin, the Coastal Engineering Branch, reviewed this CHETN. Files for the example may be obtained by contacting the author. This CHETN should be cited as follows: | |||
H. Li, C. W. Reed, G. A. Zarillo, and M. E. Brown. 2010. Salinity Calculations in the Coastal Modeling System. Coastal and Hydraulics Engineering Technical Note ERDC/CHL CHETN-IV-XX. Vicksburg, MS: U.S. Army Engineer Research and Development Center. | |||
An electronic copy of this CHETN is available from http://chl.erdc.usace.army.mil/chetn or http://cirp.usace.army.mil/pubs/chetns.html. | |||
==REFERENCES== | |||
*Aquaveo. 2010. SMS: XY Series Files (*.xys). http://www.xmswiki.com/xms/SMS:XY_Series_Files_(*.xys). | |||
*Buttolph, A. M., C. W. Reed, N. C. Kraus, N. Ono, M. Larson, B. Camenen, H. Hanson, T. Wamsley, and A. K. Zundel, A. K. 2006. Two-dimensional depth-averaged circulation model CMS-M2D: Version 3.0, Report 2, sediment transport and morphology change. Coastal and Hydraulics Laboratory Technical Report ERDC/CHL-TR-06-7. Vicksburg, MS: U.S. Army Engineer Research and Development Center. | |||
*Cameron, W. M. and D. W. Pritchard. 1963. Estuaries. In M. N. Hill (editor): The Sea vol. 2, John Wiley and Sons, New York, 306 - 324. | |||
*CeNCOOS. 2010. Central & Northern California Ocean Observing System. http://www.cencoos.org/. | |||
*Cooke, W. H. III, K. Grala, and C. L. Wax. 2008. A Method for estimating pan evaporation for inland and coastal regions of the southeastern U. S. Southeastern Geographer, 48(2): 149–171. | |||
*Demirbilek, Z., K. J. Connell, N. J. MacDonald, and A. K. Zundel. 2008. Particle Tracking Model in the SMS10: IV. Link to Coastal Modeling System. Coastal and Hydraulics Engineering Technical Note ERDC/CHL CHETN-IV-71. Vicksburg, MS: U.S. Army Engineer Research and Development Center. http://chl.erdc.usace.army.mil/chetn. | |||
*Lin, L., Z. Demirbilek, H. Mase, J. Zheng, and F. Yamada. 2008. CMS-Wave: A nearshore spectral wave processes model for coastal inlets and navigation projects. Coastal and Hydraulics Laboratory Technical Report ERDC/CHL-TR-08-13. Vicksburg, MS: U.S. Army Engineer Research and Development Center. | |||
*Moon, I. 2005. Impact of a coupled ocean wave-tide-circulation system on coastal modeling. Ocean Modeling, 8: 203-236. | |||
*Nicholson, J., and B. A. O’Connor. 1986. Cohesive sediment transport model. Journal of Hydraulic Engineering, 112(7): 621-640. | |||
Pritchard, D. W. 1955. Estuarine circulation patterns. Proceedings of the American Society of Civil Engineers 81, no 717, 1 – 11. | *Pritchard, D. W. 1955. Estuarine circulation patterns. Proceedings of the American Society of Civil Engineers 81, no 717, 1 – 11. | ||
URS. 2010. USACE White Ditch evaluation and design – hydrodynamic and salinity transport modeling. Tallahassee, FL. | *URS. 2010. USACE White Ditch evaluation and design – hydrodynamic and salinity transport modeling. Tallahassee, FL. | ||
Latest revision as of 20:50, 25 August 2020
CIRP-WN-11-2
PURPOSE
This Coastal and Hydraulics Engineering Technical Note (CHETN) describes procedures to calculate salinity change within the Coastal Modeling System (CMS) operated in the Surface-water Modeling System (SMS), version 11. The CMS is a hydrodynamic and transport model designed for coastal and inlet applications and the SMS is a graphical user interface utility for PCs as developed by the U.S. Army Corps of Engineers (USACE). The procedure and the CMS verification are illustrated by the salinity modeling in a coastal inlet system at Humboldt Bay, CA, and in a wetland area of Breton Sound estuary, LA.
CITATION
 H. Li, C. W. Reed, and M. E. Brown. 2010. Salinity Calculations in the Coastal Modeling System.
 Coastal and Hydraulics Engineering Technical Note ERDC/CHL CHETN-IV-XX. Vicksburg, MS:
 U.S. Army Engineer Research and Development Center.
INTRODUCTION
Salinity refers to the salt content of water, with values ranging from 0 for fresh water to 31-35 ppt (parts per thousand) for ocean water. In water bodies with poor mixing and limited water exchange, or those experiencing high evaporation, salinity can be greater and lead to formation of brine. Table 1 presents typical values and nomenclature for describing the degree of water salinity:
| Fresh Water | Brackish Water | Saline Water | Brine |
|---|---|---|---|
| < 0.05 % | 0.05 - 3 % | 3 - 5 % | >5 % |
| < 0.5 ppt | 0.5 - 30 ppt | 30 - 50 ppt | > 50 ppt |
In coastal zones and estuaries, both temporal and spatial variations in salinity are controlled by changes in circulation, waves, tides, precipitation, evaporation, and freshwater inflows. These changes in salinity can have major effects on water density and water stratification, changing circulation patterns. Dynamic behavior of suspended sediment can be controlled by the salinity-driven flow and mixing. Any sustained changes to salinity can directly change the aggregation and consolidation of cohesive sediment as well (Nicholson and O’Connor 1986). Salinity can also alter the water chemistry that is closely related to marine organisms. Distribution and abundance of marine life will change water turbidity and define water quality in coastal and estuarine systems. Modifications of coastal inlets, such as channel deepening and widening and rehabilitation or extension of jetties may alter the salinity distribution within the estuary.
COASTAL MODELING SYSTEM
The CMS calculates water levels, currents and waves through the coupling between a hydrodynamic model, CMS-Flow and a wave spectral model, CMS-Wave. These two models can also interact dynamically to simulate sediment and salinity transport, and morphology change (Buttolph et al. 2006; Lin et al. 2008). *CMS is available in an explicit version, discussed herein, and an implicit version which is being tested.*
CMS Flow is a finite-volume model that solves the mass conservation and shallow-water momentum equations of water motion. The model can run in a two-dimensional (2D) mode based on the depth-integrated Navier-Stokes equations, *or a three-dimensional (3D) mode presently in developmental testing*. CMS Flow is forced by water surface elevation (e.g., from tide), wind and river discharge at the model boundaries, and wave radiation stress and wind field over the model computational domain. Physical processes pertinent to the present study calculated by CMS Flow include wave-current interaction, sediment transport, morphology change, and representation of non-erodible bottom (reef). Additional capabilities include wetting and drying, space-varying bottom-friction, salinity transport, efficient grid storage in memory, and hot-start options.
CMS Wave is a 2D steady-state (time-independent) spectral wave transformation model. The model contains theoretically derived approximations of wave diffraction, reflection, and wave-current interaction for wave simulations at coastal inlets with jetties and breakwaters. It employs a forward-marching and finite-difference method to solve the wave action conservation equation. CMS-Wave operates mainly on a coastal half-plane, so primary waves can propagate only from the seaward boundary toward shore. In the full-plane mode, CMS Wave performs the backward-marching for seaward spectral transformation after the forward-marching is completed.
SALINITY CALCULATIONS IN CMS
The CMS calculates the salinity field based on the following 2D salinity conservation equation:
where S is depth-averaged salinity; d is total water depth, qx and qy are flow per unit width in the x- and y-axis direction, respectively; Kx and Ky are the salt diffusion coefficients in the corresponding x- and y-axis directions, and P and E are precipitation and evaporation in m/year, respectively. Equation (1) represents the horizontal fluxes of salt in water bodies and is balanced by exchanges of salt via diffusive fluxes. Major processes contributing to the salinity are freshwater inflows from rivers, vertical fluxes of freshwater by precipitation and evaporation at the water surface, and groundwater fluxes, which can be specified as the surface and bottom boundary conditions in the equation.




MODEL ASSUMPTIONS
CMS-Flow is presently capable of 2D salinity computations in both the explicit and implicit solvers. 3D representation of salinity in the CMS, discussed herein, is being tested. The simulation of salinity can often require a 3D solution due to the presence of vertical salinity gradients that can significantly influence flow. It is therefore important to understand the limitations of 2D salinity simulations, and apply them only when the assumptions inherent in 2D simulations are valid. Typically, 2D salinity calculations are valid when the salinity is well mixed over the water column. These conditions are usually met for shallow bays with open exchanges to the ocean or gulf, dominant tidal signals, and sufficient wind energy to provide the vertical mixing. Also, the assumption of sufficient energy to mix over the water column is valid under storm conditions, even for deeper water bodies. Finally, when the exchange with the open sea is restricted by an inlet, the tidal range is an important indicator of vertical mixing conditions. For low tide ranges, significant vertical stratification can occur, even in shallow bays and estuaries, especially when the winds are calm. Pritchard (1955) and Cameron and Pritchard (1963) have classified estuaries using stratification and salinity distribution as the governing criteria, and these classifications can be used for guidance in applying the 2D simulations.
The lateral mixing for salinity in the CMS Flow model is the same as the lateral mixing in the momentum equations.
SALINITY MODELING AT HUMBOLDT BAY, CA
In this section, the salinity modeling is described to demonstrate the CMS capability at Humboldt Bay, CA.
Humboldt Bay is a natural multi-basin, bar-built, coastal lagoon located along the rugged North Coast of California. The bay entrance is protected by dual rubble-mound jetties from the high-energy waves at the Northeast Pacific coast (Figure 1). Wave-induced long-shore current, nearshore wave breaking, and wave-dependent mixing have a significant contribution to momentum transfer in the water column, diffusive process and spatial distributions of salinity (Moon 2005). Tides and wind are the primary forcing to drive hydrodynamics and salinity transport inside the bay.
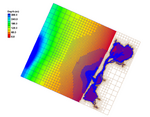
In application of the CMS to Humboldt Bay, a quadtree grid system was developed to discretize the bay and the offshore. The computational domain extends approximately 25 km alongshore and 20 km offshore, and the seaward boundary of the domain reaches to the 300 m isobath. Figure 2 shows the quadtree grid with 43,000 ocean cells and bathymetric features of Humboldt Bay, and adjoining nearshore and continental shelf. The CMS grid permits fine resolution in areas of high interest such as jetties, channels, and the bay. The implicit solver of the CMS with a large time step of 10 minutes was employed for the simulation. The implicit version of CMS typically reduces the computation time by more than 50% as compared ot the explicit version.
CMS-Flow is driven by time-dependent water surface elevation at the offshore open boundaries, wind forcing over the surface boundary, and freshwater inflows from rivers and tributaries. Time varying salinity values are specified along the open boundaries and with the freshwater inflows. The initial salinity field needs to be specified to the entire CMS domain as well.
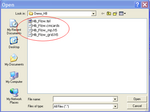
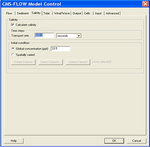
1. CMS-Flow setup: The CMS hydrodynamic input files for Humboldt Bay, CA are required to be generated and prepared by the SMS shown in Figure 3: After opening “HB_Flow.cmcards” in the SMS, choose CMS-Flow | Model Control, click on the Salinity, and select the Calculate salinity (Figure 4). A time step of greater than (integer multiplier) or equal to the hydrodynamic time step should be specified. In this case, the Transport rate under the Time steps is set to 600 sec (equal to the hydrodynamic time step) for the salinity calculation.
2. Salinity initial condition: Because of the large salinity range in a coastal system, it usually requires long spin-up periods for a salinity simulation to reach to the present salinity distribution, which could range from a few days to weeks. To shorten the spin-up time, an accurate initial condition for the salinity field should be specified. There are two options to assign the initial salinity condition in CMS-Flow:
- i) A global initial salinity: Specify a constant initial value for the entire model domain. Figure 4 shows the example of using a constant 33.5 ppt as the global initial salinity value for the Humboldt Bay model.
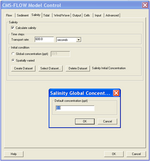
- ii) Spatially varying initial salinity: Generate a spatially varying initial salinity field by choosing the Spatially varied toggle under the Initial condition (Figure 5). Clicking the Create Dataset and assigning a value under the Default concentration (ppt) in the pop-up window will generate a new dataset with a constant initial salinity value. Clicking OK to close this window and then clicking OK to close the CMS-FLOW Model Control window, the dataset, Salinity Initial Concentration, will appear in the CMS-Flow data tree as shown in Figure 6a. Highlight the dataset to specify different salinity values in the CMS domain in the same way to modify other datasets such as D50 or Hard Bottom.
The dataset for a spatially varying initial salinity can also be generated by using Data Calculator tool in the Data menu (Demirbilek et al. 2008). For an existing dataset, click the Select Dataset under the Spatially varied and then select the dataset for the initial salinity that already exists (Figure 6b).
3. Salinity boundary conditions: Salinity conditions need to be specified at CMS-Flow boundaries. Two salinity boundary types are available in the CMS: water surface elevation (WSE) boundary (WSE-forcing boundary) and freshwater inflow boundary (Flow rate-forcing boundary) (Figure 7).
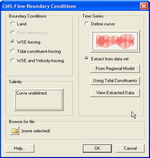
- i) WSE-forcing boundary: Using the Select Cellstring tool and clicking/highlighting, the cellstring of water surface elevation boundary can be specified as shown in Figure 7a. Selecting CMS-Flow | Assign BC will open the CMS-Flow Boundary Conditions window (Figure 8). A time series of salinity can be assigned along the WSE-Forcing boundary by clicking the Curve undefined under Salinity on the left hand side of the dialog.
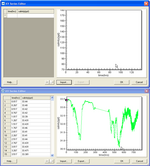
The time series is specified either by clicking the Import button to read a salinity boundary input file in xys format (Figure 9) (Aquaveo 2010) or by manually entering time and salinity values in two separate data columns or by importing salinity data from an opened Excel file by Copy/Paste.
Because the WSE-forcing boundary of the Humboldt Bay grid is located outside the bay in open coast, salinity measurements at Trinidad Bay, approximately 18 km north of the CMS domain by CeNCOOS at Humboldt State University (2010), were assigned to the CMS-Flow open boundary. A 30-day time series of the salinity data is shown for the WSE-forcing boundary in Figure 8. Salinity at this location varies between 30.5 and 33.5 ppt that show apparent influence of the ocean on salinity variations during the period.
4. Flow rate-forcing boundary: Following the same steps as specifying WSE-forcing boundary, salinity values at freshwater inflow boundaries can be assigned together with flow specifications.
Only a few rivers and creeks flow into Humboldt Bay and no stream measurements are available. Although small, there are seasonal variations in freshwater inflows to the bay. Relatively large amount of land runoffs flows into the bay during the rainy season in northern California from October to April. For demonstration purpose in this CMS application, 10 ppt was assigned for a constant river flow in the Elk River (Figure 7). A non-zero salinity value is given here considering that the location of the Flow rate-forcing cellstring is within the intertidal zone.
SIMULATION RESULTS
For the Humboldt Bay demonstration, the CMS-Flow simulation was conducted for a 30 day winter period (December 2007). Depth-averaged current and salinity fields near the bay entrance channel were retrieved from two snapshots of the CMS results at Day 19 of the simulation, corresponding to the flood and ebb currents, respectively (Figure 10).
The current speed is between 1 and 2 m/sec at the Humboldt Bay entrance during the flood and ebb tides. The bay is dominated by relatively high salinity water and low salinity water fills the downstream reach of the Elk River, consistent with the salinity specifications along the WSE-forcing and the Flow rate-forcing boundaries. Figure 10 shows that high salinity ocean water is brought into the bay by the flood current. A salt front near the mouth of the Elk River indicates that intrusion of freshwater plume into the bay. The plume is pushed upstream of the river by strong flood current passing by to the Arcata Bay and extends further into Humboldt Bay during the ebb tidal cycle.
SALINITY TRANSPORT MODELING AT WHITE DITCH AREA, LA
Located southeast of New Orleans on the coast of Louisiana, the White Ditch area has been experiencing the shortage of fresh water, sediments and nutrients from the Mississippi River, and saltwater intrusion due to sea level rise and storms. As a result, extensive wetland loss and degradation of tidal marshes have occurred in the area through the years. A hydrodynamic and salinity modeling analysis was conducted by URS (2010) to evaluate alternative designs for a fresh water diversion from the Mississippi River to the project area.
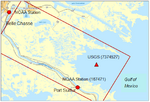
CMS-Flow was developed for the White Ditch project. The model domain extends about 60 km along the NW-SE directions and about 30 km along the SW-NE direction, and includes the Mississippi River levees, the Mississippi River-Gulf Outlet (MRGO) channel, and other features (Figure 11). The size of the CMS grid cells ranges from 24 to 600 m with the fine grid along the White Ditch (Mississippi River) and the coarse grid in the Gulf of Mexico.
The CMS was driven by the tide data downloaded from U.S. Geological Survey (USGS) station (7374527) (Figure 11), Northeast Bay Gardene near Point-a-La-Hache, LA (http://waterdata.usgs.gov/nwis). Rainfall data were obtained from the NOAA Port Sulfur Station (167471) and from the Belle Chasse station. Daily evaporation data were not available at the project area. Evaporation rates specified in the CMS were based on a study conducted by Cooke et al. (2008). Freshwater flows were measured from the Caernarvon Diversion and the Mississippi River. The New Orleans District, USACE, manages the Caernarvon Freshwater Diversion Project and provided daily flow information for the study.
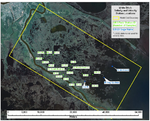
The salinity data for the CMS were collected on a field survey conducted from 20 July through 23 July, 2009 by URS. The sampling stations are shown in Figure 12. Flow velocity, temperature, salinity and turbidity were collected periodically between 21 and 23 July, 2009 at the primary stations (N1, N2, N3, S1, S2, and S3). Less frequent flow velocity, temperature and salinity measurements were collected at the secondary locations (Oak River Channel, N4, N5, N6, S4, S5, S6, S7, S8, S9, S10, and S11).
Statistical analysis of the salinity data was performed to compute the median, maximum and minimum salinity at each station. The time-averaged salinity values over the last four days of the CMS simulation corresponding to the time period of the measurements by URS (2010), were compared with the measurements (Figure 13).
The time- and depth-averaged salinity in this wetland area ranges from about 3 to 10 ppt. The variability of salinity is less than 1 ppt at the landward stations (Points 33-35) and can reach as high as more than 3 ppt at the seaward stations (Point 36) over the 4-day survey period. The salinity data show a general trend in the survey area. Salinity is relatively high at the southeast corner of the CMS domain in nearshore waters of the Gulf of Mexico, and decreases towards the northwest. High salinity also occurs along the east bank of the Mississippi River and decreases to the northeast of the CMS domain. The general trend indicates that significant sources of freshwater in the White Ditch area are from the Caernarvon Diversion. CMS-Flow tends to underestimate the salinity at some stations, but overall the CMS results show good agreement between measurements and calculated salinity, and well represent the spatial pattern and temporally averaged salinity levels.
CONCLUSIONS
The depth-averaged salinity calculation procedure by the CMS was demonstrated in this technical note. The Humboldt Bay example shows that the procedures to set up the CMS for salinity calculation are straightforward and user-friendly. The White Ditch example provides an estuarine application of salinity calculations and verification for the CMS results, which well reproduce the spatial salinity distributions in the wetland area. Due to lack of measurements such as rainfall and evaporation, detailed bathymetry and salinity data, some assumptions were made for the study. Further improvement can be made as more data are collected in the future.
ADDITIONAL INFORMATION
This CHETN was prepared and funded under the Coastal Inlet Research Program (CIRP) and was written by Dr. Honghai Li (Honghai.Li@usace.army.mil, voice: 601-634-2840, fax: 601-634-3080) of the U.S. Army Engineer Research and Development Center (ERDC), Coastal and Hydraulics Laboratory (CHL), Dr. Christopher W. Reed (Chris_Reed@URSCorp.com) of URS Corporation, and Mitchell E. Brown (Mitchell.E.Brown@usace.army.mil) of ERDC, CHL. Alejandro Sanchez of CIRP provided hydrodynamic model information for the Humboldt Bay example. The CIRP Program Manager, Dr. Julie D. Rosati (Julie.D.Rosati@usace.army.mil), the assistant Program Manager, Dr. Nicholas C. Kraus, the Chief of the Coastal Engineering Branch at CHL, Dr. Jeffrey P. Waters, and Dr. Lihwa Lin, the Coastal Engineering Branch, reviewed this CHETN. Files for the example may be obtained by contacting the author. This CHETN should be cited as follows:
H. Li, C. W. Reed, G. A. Zarillo, and M. E. Brown. 2010. Salinity Calculations in the Coastal Modeling System. Coastal and Hydraulics Engineering Technical Note ERDC/CHL CHETN-IV-XX. Vicksburg, MS: U.S. Army Engineer Research and Development Center.
An electronic copy of this CHETN is available from http://chl.erdc.usace.army.mil/chetn or http://cirp.usace.army.mil/pubs/chetns.html.
REFERENCES
- Aquaveo. 2010. SMS: XY Series Files (*.xys). http://www.xmswiki.com/xms/SMS:XY_Series_Files_(*.xys).
- Buttolph, A. M., C. W. Reed, N. C. Kraus, N. Ono, M. Larson, B. Camenen, H. Hanson, T. Wamsley, and A. K. Zundel, A. K. 2006. Two-dimensional depth-averaged circulation model CMS-M2D: Version 3.0, Report 2, sediment transport and morphology change. Coastal and Hydraulics Laboratory Technical Report ERDC/CHL-TR-06-7. Vicksburg, MS: U.S. Army Engineer Research and Development Center.
- Cameron, W. M. and D. W. Pritchard. 1963. Estuaries. In M. N. Hill (editor): The Sea vol. 2, John Wiley and Sons, New York, 306 - 324.
- CeNCOOS. 2010. Central & Northern California Ocean Observing System. http://www.cencoos.org/.
- Cooke, W. H. III, K. Grala, and C. L. Wax. 2008. A Method for estimating pan evaporation for inland and coastal regions of the southeastern U. S. Southeastern Geographer, 48(2): 149–171.
- Demirbilek, Z., K. J. Connell, N. J. MacDonald, and A. K. Zundel. 2008. Particle Tracking Model in the SMS10: IV. Link to Coastal Modeling System. Coastal and Hydraulics Engineering Technical Note ERDC/CHL CHETN-IV-71. Vicksburg, MS: U.S. Army Engineer Research and Development Center. http://chl.erdc.usace.army.mil/chetn.
- Lin, L., Z. Demirbilek, H. Mase, J. Zheng, and F. Yamada. 2008. CMS-Wave: A nearshore spectral wave processes model for coastal inlets and navigation projects. Coastal and Hydraulics Laboratory Technical Report ERDC/CHL-TR-08-13. Vicksburg, MS: U.S. Army Engineer Research and Development Center.
- Moon, I. 2005. Impact of a coupled ocean wave-tide-circulation system on coastal modeling. Ocean Modeling, 8: 203-236.
- Nicholson, J., and B. A. O’Connor. 1986. Cohesive sediment transport model. Journal of Hydraulic Engineering, 112(7): 621-640.
- Pritchard, D. W. 1955. Estuarine circulation patterns. Proceedings of the American Society of Civil Engineers 81, no 717, 1 – 11.
- URS. 2010. USACE White Ditch evaluation and design – hydrodynamic and salinity transport modeling. Tallahassee, FL.