Kuriyama Ozaki: Difference between revisions
| (4 intermediate revisions by the same user not shown) | |||
| Line 1: | Line 1: | ||
<big> | <big> | ||
__NOTOC__ | __NOTOC__ | ||
<font color=red>'''UNDER CONSTRUCTION'''</font> | |||
==Field Data== | ==Field Data== | ||
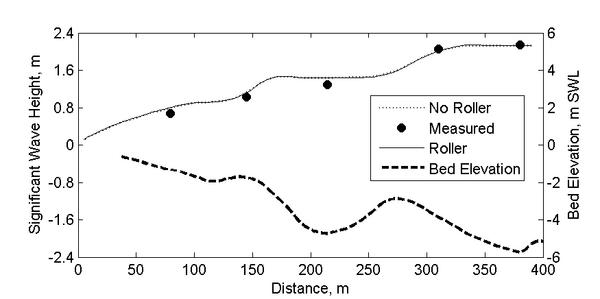
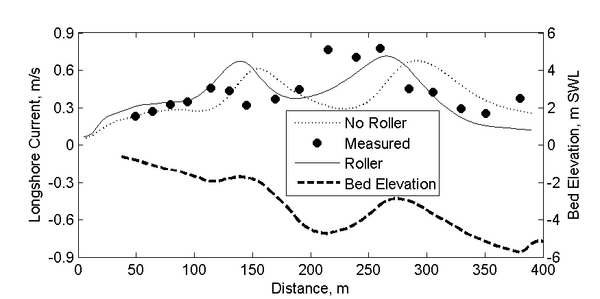
Kuriyama and Ozaki (1993) measured the cross-shore distribution of longshore current and wave height at the Hazaki Oceanographical Research Facility (HORF) located on the Japan Pacific coast. Longshore current measurements were made from a 427 m long pier using a float. The wave heights were calculated with ultrasonic wave gauges. The data presented here was taken on March 28, 1989. | Kuriyama and Ozaki (1993) measured the cross-shore distribution of longshore current and wave height at the Hazaki Oceanographical Research Facility (HORF) located on the Japan Pacific coast. Longshore current measurements were made from a 427 m long pier using a float. The wave heights were calculated with ultrasonic wave gauges. The data presented here was taken on March 28, 1989. | ||
| Line 53: | Line 54: | ||
The computed longshore current and significant wave heights are compared to field measurements in Figures 1 and 2. In general, a good comparison is obtained with measurements as illustrated by the goodness of fit statistics shown in Table 4. | The computed longshore current and significant wave heights are compared to field measurements in Figures 1 and 2. In general, a good comparison is obtained with measurements as illustrated by the goodness of fit statistics shown in Table 4. | ||
[[Image: | [[Image:Kuriyama_Ozaki_WavePro_V2.png|thumb|left|600px|Figure 1. Comparison of measured and calculated significant wave heights for the Kuriyama and Ozaki (1993) field experiment. The beach profile is also shown for reference.]] | ||
<br style="clear:both" /> | <br style="clear:both" /> | ||
[[Image: | [[Image:Kuriyama_Ozaki_CurrentPro_V2.png|thumb|left|600px|Figure 2. Comparison of measured and calculated longshore current for the Kuriyama and Ozaki (1993) field experiment. The beach profile is also shown for reference.]] | ||
<br style="clear:both" /> | <br style="clear:both" /> | ||
'''Table 4. Goodness of fit statistics for the Kuriyama abd Ozaki (1993) field case''' | '''Table 4. Goodness of fit statistics for the Kuriyama abd Ozaki (1993) field case''' | ||
{|border="1" | {|border="1" | ||
| | |||
|align = "center" colspan = "2" |No Roller | |||
|align = "center" colspan = "2" |Roller | |||
|- | |||
| ||Hs, m ||V, m/s ||Hs, m ||V, m/s | |||
|- | |- | ||
|RMSE ||0.0976 ||0.1539 | |RMSE ||0.1020 ||0.2098 ||0.0976 ||0.1539 | ||
|- | |- | ||
|RMAE ||0. | |RMAE ||0.0457 ||0.0666 ||0.0434 ||0.0142 | ||
|- | |- | ||
|R<sup>2</sup> ||0.995 ||0. | |R<sup>2</sup> ||0.994 ||0.0015 ||0.995||0.3236 | ||
|- | |- | ||
|Bias || -0.062 ||0.006 | |Bias ||-0.066||0.0284 ||-0.062 ||0.006 | ||
|} | |} | ||
* For a definition of the goodness of fit statistics see [[Statistics | Goodness of fit statistics]] | * For a definition of the goodness of fit statistics see [[Statistics | Goodness of fit statistics]] | ||
Latest revision as of 15:45, 27 October 2010
UNDER CONSTRUCTION
Field Data
Kuriyama and Ozaki (1993) measured the cross-shore distribution of longshore current and wave height at the Hazaki Oceanographical Research Facility (HORF) located on the Japan Pacific coast. Longshore current measurements were made from a 427 m long pier using a float. The wave heights were calculated with ultrasonic wave gauges. The data presented here was taken on March 28, 1989.
Model Setup
A nonuniform Cartesian grid is used with a variable resolution in the cross-shore direction of 3-10 m and a constant resolution of 4 m in the longshore direction. Table 1 shows the offshore wave conditions used in the model simulation. Specific settings for CMS-Flow and CMS-Wave including time steps and steering interval are provided in Tables 2 and 3.
Table 1. Offshore wave conditions
| Variable | Value |
|---|---|
| Incident wave angle | 27º |
| Offshore significant wave height | 2.14 m |
| Wave period | 8.86 sec |
Table 2. CMS-Flow setup
| Setting | Value |
|---|---|
| Solver | Implicit |
| Time step | 60 sec |
| Simulation duration | 3 hr |
| Ramp duration | 3 hr |
| Clock time | 2.8 min |
Table 3. CMS-Wave setup
| Setting | Value |
|---|---|
| Wave breaking | Battjes and Jansen |
| Spectrum | TMA |
| Directional spreading distribution | Cosine Power |
| Directional spreading parameter γ | 3.3 |
| Bottom friction | Off |
| Steering interval | 0.25 hr |
Results
The computed longshore current and significant wave heights are compared to field measurements in Figures 1 and 2. In general, a good comparison is obtained with measurements as illustrated by the goodness of fit statistics shown in Table 4.


Table 4. Goodness of fit statistics for the Kuriyama abd Ozaki (1993) field case
| No Roller | Roller | |||
| Hs, m | V, m/s | Hs, m | V, m/s | |
| RMSE | 0.1020 | 0.2098 | 0.0976 | 0.1539 |
| RMAE | 0.0457 | 0.0666 | 0.0434 | 0.0142 |
| R2 | 0.994 | 0.0015 | 0.995 | 0.3236 |
| Bias | -0.066 | 0.0284 | -0.062 | 0.006 |
- For a definition of the goodness of fit statistics see Goodness of fit statistics
References
- Kuriyama, Y., and Ozaki, Y. (1993). "Longshore current distribution on a bar-trough beach, Field measurements at HORF and numerical model," Report of Port and Harbour Research Institute 32(3), Ministry of Transport, Japan, 3-37.