Model Application to St. Augustine Inlet: Difference between revisions
No edit summary |
No edit summary |
||
| (21 intermediate revisions by the same user not shown) | |||
| Line 1: | Line 1: | ||
<big> | <big> | ||
__NOTOC__ | __NOTOC__ | ||
[[Image:Validation St.A Morphology Change3.png|thumb|right|500px|Figure 1. Study Area for St. Augustine Inlet.]] | |||
Additional excavation of the ebb shoal at St. Augustine Inlet required further analysis to determine the subsequent effect of this activity on the littoral sediment transport and equilibrated beach-offshore profile, as well as the planform and elevations of the ebb shoal. Because significant changes in the depth and planform extent of the ebb shoal could lead to a realignment of the shoreline to such a degree that beach erosion would threaten upland infrastructure, and large scale changes of the ebb shoal bathymetry could interfere with gross transport to adjacent beaches or change wave refraction patterns, the CMS (Coastal Modeling System, version 4) was selected to examine changes in morphology of the ebb shoal at St. Augustine Inlet. | Additional excavation of the ebb shoal at St. Augustine Inlet required further analysis to determine the subsequent effect of this activity on the littoral sediment transport and equilibrated beach-offshore profile, as well as the planform and elevations of the ebb shoal. Because significant changes in the depth and planform extent of the ebb shoal could lead to a realignment of the shoreline to such a degree that beach erosion would threaten upland infrastructure, and large scale changes of the ebb shoal bathymetry could interfere with gross transport to adjacent beaches or change wave refraction patterns, the CMS (Coastal Modeling System, version 4) was selected to examine changes in morphology of the ebb shoal at St. Augustine Inlet. | ||
CMS was used to seek the answer to the following scientific/engineering questions for the future condition: | CMS was used to seek the answer to the following scientific/engineering questions for the future condition: | ||
* How many cubic yards of sediment can be additionally mined from the ebb shoal in its present condition which does not cause large scale morphological change to the ebb shoal, inlet complex? | |||
* What is the volumetric limit for the removal of sediments which does not cause a significant change to the elevation and planform extent of the ebb shoal either from the engineering activity itself at the borrow site, or due to ebb shoal deflation or collapse after the engineering activity? | |||
* How would a significant change to the elevation and planform extent of the ebb shoal affect shoreline position? | |||
<br style="clear:both" /> | |||
The CMS was also used to seek the answer to the following scientific/engineering question to address the effect of previous dredging activities: | The CMS was also used to seek the answer to the following scientific/engineering question to address the effect of previous dredging activities: | ||
* What was the role of previous mining activities on the morphological trajectory of the ebb shoal in the context of a dynamic system? | |||
* Has the evolution of the ebb shoal been diverted from its natural (non-engineered) trajectory? | |||
<br style="clear:both" /> | |||
== Model Setup == | == Model Setup == | ||
[[Image:Validation St.A Morphology Change4.png|thumb|right|400px|Figure 3. Telescoping Grid.]] | |||
Model calibration, as discussed here as the comparison of measured and calculated sediment transport and morphology change, covers the time period extending from the June 2003 post-dredging condition to the pre-dredging condition in November 2004 referred herein as 2005. The Van Rijn unified sediment transport formula was used. The bed slope coefficient was set to 0.1 for closer representation to the morphology of channel slopes at St. Augustine. The default CMS suspended load and bed load sediment transport scaling factors were not modified. | Model calibration, as discussed here as the comparison of measured and calculated sediment transport and morphology change, covers the time period extending from the June 2003 post-dredging condition to the pre-dredging condition in November 2004 referred herein as 2005. Table 1 lists the parameters used in the model runs. The Van Rijn unified sediment transport formula was used. The bed slope coefficient was set to 0.1 for closer representation to the morphology of channel slopes at St. Augustine. The default CMS suspended load and bed load sediment transport scaling factors were not modified. | ||
A non-uniform sediment transport scheme was used in the CMS to represent the various grain sizes being transported and the significant impact of sediment hiding and exposure. Five different sediment grain sizes were defined based on the D50 grain sizes in the grid. Including hiding and exposure of multiple grain size distributions reduced scour within the channel thalweg, accurately representing the shell hash observed in this region. Also, sediments that are transported over the nearshore and ebb shoal are of the movable grain size and are more realistically represented with the varying grain size distributions. | A non-uniform sediment transport scheme was used in the CMS to represent the various grain sizes being transported and the significant impact of sediment hiding and exposure. Five different sediment grain sizes were defined based on the D50 grain sizes in the grid. Including hiding and exposure of multiple grain size distributions reduced scour within the channel thalweg, accurately representing the shell hash observed in this region. Also, sediments that are transported over the nearshore and ebb shoal are of the movable grain size and are more realistically represented with the varying grain size distributions. | ||
[[Image:Validation St.A Morphology Change5.png|thumb|left|200px|Figure 4. Zoom in of telescoping grid over the backbay (note the detail of tidal creeks).]] | |||
[[Image:Validation St.A Morphology Change6.png|thumb|left|200px|Figure 5. Zoom in of telescoping grid over the inlet.]] | |||
The Non-equilibrium Transport (NET) method also controls the capacity of sediment transport through scaling factors such as adaptation lengths or times, generally dependent upon length-scales of morphologic features such as bedforms or timescales of sediment movement. As a total load formulation is used with the NET, the Adaptation Length must be modified to calibrate to morphology. The Adaptation Length is a length scaling factor that is typically based on localized bedforms. The smaller the Adaptation Length, the closer the model is to Equilibrium Transport which results in greater rates of transport that is more localized. Adaptation Lengths tested included 1, 2, 3, 4, 5, 10, and 100 meters. An Adaptation Length of 3 meters was selected for the entire domain of the final calculations because of the realistic patterns and trends observed in the calculations as compared to the measurements. Final parameter values were chosen to produce calibration of results to specific regions of interest, such as channel infilling in the dredged pit. | The Non-equilibrium Transport (NET) method also controls the capacity of sediment transport through scaling factors such as adaptation lengths or times, generally dependent upon length-scales of morphologic features such as bedforms or timescales of sediment movement. As a total load formulation is used with the NET, the Adaptation Length must be modified to calibrate to morphology. The Adaptation Length is a length scaling factor that is typically based on localized bedforms. The smaller the Adaptation Length, the closer the model is to Equilibrium Transport which results in greater rates of transport that is more localized. Adaptation Lengths tested included 1, 2, 3, 4, 5, 10, and 100 meters. An Adaptation Length of 3 meters was selected for the entire domain of the final calculations because of the realistic patterns and trends observed in the calculations as compared to the measurements. Final parameter values were chosen to produce calibration of results to specific regions of interest, such as channel infilling in the dredged pit. | ||
| Line 49: | Line 47: | ||
|} | |} | ||
== Validation == | |||
[[Image:Validation St.A Morphology Change1.png|thumb|right|700px|Figure 5. Comparison of Measured 2005 Pre-Dredging Bathymetry with Calculated 2005 Pre-Dredging Bathymetry.]] | |||
Model skill was tested through a comparison of the calculated morphology change and measured morphology change for the 1.4 simulation extending from 2003 to 2005. Figure | Model skill was tested through a comparison of the calculated morphology change and measured morphology change for the 1.4 simulation extending from 2003 to 2005. Figure 5 is a comparison of the measured bathymetry for the Pre-dredging condition of 2005 to the calculated. Morphology change, illustrated in Figure 6 as red for deposition and blue for erosion, is close in comparison with the volume of channel infilling and also captures the overall trends of erosion and deposition. Modeled results were filtered for morphology change within a range of + 1 m which is considered well within the error of morphologic modeling. Therefore, the delineated polygons in Figure 6 are areas with a significant trend of erosion or deposition associated with major morphologic features. The polygons for the measured change calculation were different for the calculated change because the area of change must be calculated based on a morphological scale over the features that are represented by the processes in the model. | ||
In the present formulation of CMS, cross-shore processes and swash processes are only qualitatively represented. The northern and southern parts of the shoal closest to the nearshore beaches show a reduction in offshore platform elevation, which follows the measured trend (Figure | <br style="clear:both" /> | ||
[[Image:Validation St.A Morphology Change2.png|thumb|right|700px|Figure 6. Comparison of A) Measured 2005 Bathymetry with B) Calculated 2005 Bathymetry.]] | |||
In the present formulation of CMS, cross-shore processes and swash processes are only qualitatively represented. The northern and southern parts of the shoal closest to the nearshore beaches show a reduction in offshore platform elevation, which follows the measured trend (Figure 6a). Figure 6b shows some erosion in the offshore portion of the updrift ebb shoal, however there is a poor correlation closer to the shoreline. These eroded sediments in the vicinity of Vilano Beach are not modeled properly due to lack of onshore sediment transport processes. Because the objective of the calibration of sediment transport and morphology change was to capture the channel infilling and overall ebb shoal morphologic patterns, the nearshore areas were not considered in the final analysis (polygons 3, 4, and 5). The main polygon (areas 1 and 2) representing the ebb tidal shoal was used to compute correlation coefficients for determining model skill in reproducing morphology change. The comparisons of volume change for the polygons are given in Table 2. Total volume changes for the measured and calculated ebb shoal volumes are compared and coefficients are given in Table 3, which show a resultant morphologic error of 2 – 16 %. | |||
| Line 66: | Line 67: | ||
| 3.6 % Difference || -50 % Difference | | 3.6 % Difference || -50 % Difference | ||
|} | |} | ||
<br style="clear:both" /> | |||
'''Table 3. Measured and calculated volume change of the ebb shoal to the 30 ft contour''' | '''Table 3. Measured and calculated volume change of the ebb shoal to the 30 ft contour''' | ||
{| border="1" | {| border="1" | ||
| Line 80: | Line 81: | ||
== Discussion == | == Discussion == | ||
Though analysis of these volume changes can provide insight in to the morphologic behavior, a qualitative analysis of the results bears substantial information about the inlet processes. Some oversight of the initial internal model calibration of morphology to the ambient model conditions and forcing is considered. Overall, there are five areas with significant morphologic change occurring in the modeled results, three of which are the result of a lack of representative processes as described above. | Though analysis of these volume changes can provide insight in to the morphologic behavior, a qualitative analysis of the results bears substantial information about the inlet processes. Some oversight of the initial internal model calibration of morphology to the ambient model conditions and forcing is considered. Overall, there are five areas with significant morphologic change occurring in the modeled results, three of which are the result of a lack of representative processes as described above. | ||
As the non-uniform sediment transport sorts sediments over the domain, the main channel thalweg increases in average grain sizes, and finer sediments are redistributed. There is little erosion in the deep part of inlet channel, which scours 1 to 2 meters, as the hydraulic radius goes to equilibrium with the tidal currents and bottom grain size for the modeled 1.4 time period. Sediments fill in the channel along the northern spit, also called Porpoise Point, which is an active tidal process of recurved spits in the ebb and flood direction. The representation of sedimentation in this area supports the ability of CMS to reproduce tidally-driven sedimentation and erosion patterns associated with inlet throat processes. | As the non-uniform sediment transport sorts sediments over the domain, the main channel thalweg increases in average grain sizes, and finer sediments are redistributed. There is little erosion in the deep part of inlet channel, which scours 1 to 2 meters, as the hydraulic radius goes to equilibrium with the tidal currents and bottom grain size for the modeled 1.4 time period. Sediments fill in the channel along the northern spit, also called Porpoise Point, which is an active tidal process of recurved spits in the ebb and flood direction. The representation of sedimentation in this area supports the ability of CMS to reproduce tidally-driven sedimentation and erosion patterns associated with inlet throat processes. | ||
Changes to the updrift shoal platform are a result of initial redistribution of sediments in addition to the model error induced by a lack of appropriate processes in the nearshore. A similar effect is seen along the nearshore portion of the downdrift platform adjacent to St. Augustine Beach. All other offshore ebb shoal attributes, including the main ebb channel and offshore shoals, were well represented in the model. The processes that control erosion and deposition over much of the ebb shoal were the focus of the calibration. The CMS successfully reproduced sedimentation patterns and quantities within the area of focus. | Changes to the updrift shoal platform are a result of initial redistribution of sediments in addition to the model error induced by a lack of appropriate processes in the nearshore. A similar effect is seen along the nearshore portion of the downdrift platform adjacent to St. Augustine Beach. All other offshore ebb shoal attributes, including the main ebb channel and offshore shoals, were well represented in the model. The processes that control erosion and deposition over much of the ebb shoal were the focus of the calibration. The CMS successfully reproduced sedimentation patterns and quantities within the area of focus. | ||
| Line 86: | Line 89: | ||
<br style="clear:both" /> | <br style="clear:both" /> | ||
* For a definition of the goodness of fit statistics see [[Statistics | Goodness of fit statistics]] | * For a definition of the goodness of fit statistics see [[Statistics | Goodness of fit statistics]] | ||
Latest revision as of 13:27, 18 November 2010
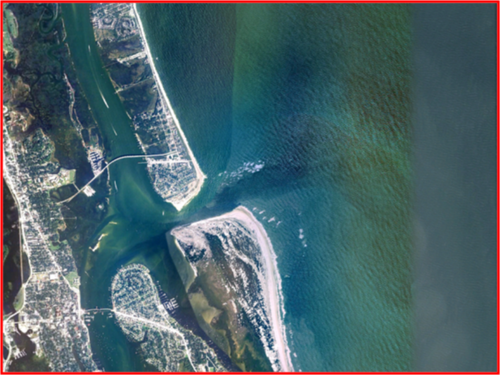
Additional excavation of the ebb shoal at St. Augustine Inlet required further analysis to determine the subsequent effect of this activity on the littoral sediment transport and equilibrated beach-offshore profile, as well as the planform and elevations of the ebb shoal. Because significant changes in the depth and planform extent of the ebb shoal could lead to a realignment of the shoreline to such a degree that beach erosion would threaten upland infrastructure, and large scale changes of the ebb shoal bathymetry could interfere with gross transport to adjacent beaches or change wave refraction patterns, the CMS (Coastal Modeling System, version 4) was selected to examine changes in morphology of the ebb shoal at St. Augustine Inlet.
CMS was used to seek the answer to the following scientific/engineering questions for the future condition:
- How many cubic yards of sediment can be additionally mined from the ebb shoal in its present condition which does not cause large scale morphological change to the ebb shoal, inlet complex?
- What is the volumetric limit for the removal of sediments which does not cause a significant change to the elevation and planform extent of the ebb shoal either from the engineering activity itself at the borrow site, or due to ebb shoal deflation or collapse after the engineering activity?
- How would a significant change to the elevation and planform extent of the ebb shoal affect shoreline position?
The CMS was also used to seek the answer to the following scientific/engineering question to address the effect of previous dredging activities:
- What was the role of previous mining activities on the morphological trajectory of the ebb shoal in the context of a dynamic system?
- Has the evolution of the ebb shoal been diverted from its natural (non-engineered) trajectory?
Model Setup
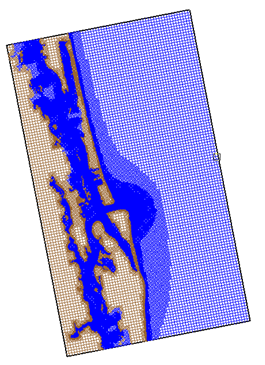
Model calibration, as discussed here as the comparison of measured and calculated sediment transport and morphology change, covers the time period extending from the June 2003 post-dredging condition to the pre-dredging condition in November 2004 referred herein as 2005. Table 1 lists the parameters used in the model runs. The Van Rijn unified sediment transport formula was used. The bed slope coefficient was set to 0.1 for closer representation to the morphology of channel slopes at St. Augustine. The default CMS suspended load and bed load sediment transport scaling factors were not modified. A non-uniform sediment transport scheme was used in the CMS to represent the various grain sizes being transported and the significant impact of sediment hiding and exposure. Five different sediment grain sizes were defined based on the D50 grain sizes in the grid. Including hiding and exposure of multiple grain size distributions reduced scour within the channel thalweg, accurately representing the shell hash observed in this region. Also, sediments that are transported over the nearshore and ebb shoal are of the movable grain size and are more realistically represented with the varying grain size distributions.
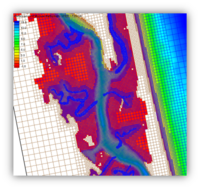
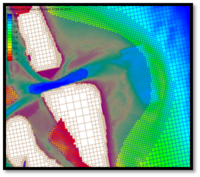
The Non-equilibrium Transport (NET) method also controls the capacity of sediment transport through scaling factors such as adaptation lengths or times, generally dependent upon length-scales of morphologic features such as bedforms or timescales of sediment movement. As a total load formulation is used with the NET, the Adaptation Length must be modified to calibrate to morphology. The Adaptation Length is a length scaling factor that is typically based on localized bedforms. The smaller the Adaptation Length, the closer the model is to Equilibrium Transport which results in greater rates of transport that is more localized. Adaptation Lengths tested included 1, 2, 3, 4, 5, 10, and 100 meters. An Adaptation Length of 3 meters was selected for the entire domain of the final calculations because of the realistic patterns and trends observed in the calculations as compared to the measurements. Final parameter values were chosen to produce calibration of results to specific regions of interest, such as channel infilling in the dredged pit.
Table 1. Sediment transport and morphology parameters in the CMS
| Parameter | Value |
|---|---|
| Formulation | Advection-Diffusion |
| Sediment Transport Formula | Van Rijn |
| Bed Load Scaling Factor | 1.0 |
| Suspended Load Scaling Factor | 1.0 |
| Sediment Porosity | 0.4 |
| Bed Slope Coefficient | 0.1 |
| Morphologic Acceleration Factor | 1.0 |
| Total Load Adaptation Length Method | Constant |
| Adaptation Length | 1.0 |
Validation
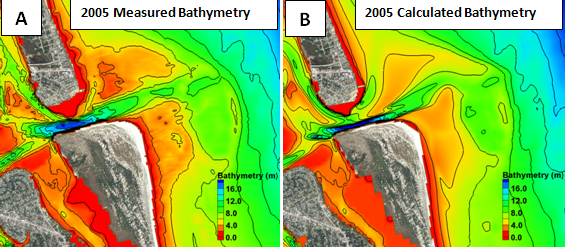
Model skill was tested through a comparison of the calculated morphology change and measured morphology change for the 1.4 simulation extending from 2003 to 2005. Figure 5 is a comparison of the measured bathymetry for the Pre-dredging condition of 2005 to the calculated. Morphology change, illustrated in Figure 6 as red for deposition and blue for erosion, is close in comparison with the volume of channel infilling and also captures the overall trends of erosion and deposition. Modeled results were filtered for morphology change within a range of + 1 m which is considered well within the error of morphologic modeling. Therefore, the delineated polygons in Figure 6 are areas with a significant trend of erosion or deposition associated with major morphologic features. The polygons for the measured change calculation were different for the calculated change because the area of change must be calculated based on a morphological scale over the features that are represented by the processes in the model.
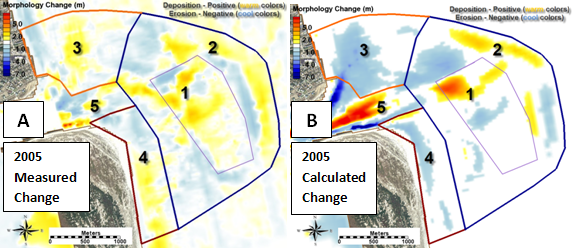
In the present formulation of CMS, cross-shore processes and swash processes are only qualitatively represented. The northern and southern parts of the shoal closest to the nearshore beaches show a reduction in offshore platform elevation, which follows the measured trend (Figure 6a). Figure 6b shows some erosion in the offshore portion of the updrift ebb shoal, however there is a poor correlation closer to the shoreline. These eroded sediments in the vicinity of Vilano Beach are not modeled properly due to lack of onshore sediment transport processes. Because the objective of the calibration of sediment transport and morphology change was to capture the channel infilling and overall ebb shoal morphologic patterns, the nearshore areas were not considered in the final analysis (polygons 3, 4, and 5). The main polygon (areas 1 and 2) representing the ebb tidal shoal was used to compute correlation coefficients for determining model skill in reproducing morphology change. The comparisons of volume change for the polygons are given in Table 2. Total volume changes for the measured and calculated ebb shoal volumes are compared and coefficients are given in Table 3, which show a resultant morphologic error of 2 – 16 %.
Table 2. Measured and calculated volume change of parts of the ebb shoal
| Dredged Pit/Channel (1) | Remainder of Ebb Shoal (2) |
|---|---|
| 2005 Measured = 369,000 cy | 2005 Measured = 240,000 cy |
| 2005 Calculated = 383,000 cy | 2005 Calculated = 127,500 cy |
| 3.6 % Difference | -50 % Difference |
Table 3. Measured and calculated volume change of the ebb shoal to the 30 ft contour
| Dredged Pit/Channel (1) |
|---|
| 2005 Measured = 32,655,700 cy |
| 2005 Calculated = 32,576,000 cy |
| -1.0 % Difference |
Discussion
Though analysis of these volume changes can provide insight in to the morphologic behavior, a qualitative analysis of the results bears substantial information about the inlet processes. Some oversight of the initial internal model calibration of morphology to the ambient model conditions and forcing is considered. Overall, there are five areas with significant morphologic change occurring in the modeled results, three of which are the result of a lack of representative processes as described above.
As the non-uniform sediment transport sorts sediments over the domain, the main channel thalweg increases in average grain sizes, and finer sediments are redistributed. There is little erosion in the deep part of inlet channel, which scours 1 to 2 meters, as the hydraulic radius goes to equilibrium with the tidal currents and bottom grain size for the modeled 1.4 time period. Sediments fill in the channel along the northern spit, also called Porpoise Point, which is an active tidal process of recurved spits in the ebb and flood direction. The representation of sedimentation in this area supports the ability of CMS to reproduce tidally-driven sedimentation and erosion patterns associated with inlet throat processes.
Changes to the updrift shoal platform are a result of initial redistribution of sediments in addition to the model error induced by a lack of appropriate processes in the nearshore. A similar effect is seen along the nearshore portion of the downdrift platform adjacent to St. Augustine Beach. All other offshore ebb shoal attributes, including the main ebb channel and offshore shoals, were well represented in the model. The processes that control erosion and deposition over much of the ebb shoal were the focus of the calibration. The CMS successfully reproduced sedimentation patterns and quantities within the area of focus.
- For a definition of the goodness of fit statistics see Goodness of fit statistics