SAJ-Sarasota County: Difference between revisions
No edit summary |
No edit summary |
||
| (One intermediate revision by the same user not shown) | |||
| Line 3: | Line 3: | ||
<font color=red>'''UNDER CONSTRUCTION'''</font> | <font color=red>'''UNDER CONSTRUCTION'''</font> | ||
'''INTRODUCTION''' | |||
[[Image:SAJ_BSPNP5.png|thumb|right|300px|Figure 1. Lidar bathymetry, May 2006, for New Pass and Big Sarasota Pass, Sarasota County, Florida.]] | |||
The Jacksonville District (SAJ) was directed to conduct a regional sediment study of a section of the Sarasota County, Florida Gulf Coast shoreline that encompasses New Pass and Big Sarasota Pass and the adjacent beaches (Figure 1) to develop an in-depth understanding of wave-forced and tidally-forced sediment transport processes and to configure an analytical model of the two-inlet system that includes regional sediment sources, sinks, and pathways that could be used for evaluating engineering and management alternatives. This effort was funded by the RSM program and focuses on the CMS-M2D morphological modeling of the Big Sarasota Pass and New Pass inlet system. Qualitative and Quantitative comparisons of CMS-M2D and LIDAR derived bathymetric changes were conducted, for the period of May to November 2004, to demonstrate the ability of CMS-M2D to simulate the morphology of the area. | The Jacksonville District (SAJ) was directed to conduct a regional sediment study of a section of the Sarasota County, Florida Gulf Coast shoreline that encompasses New Pass and Big Sarasota Pass and the adjacent beaches (Figure 1) to develop an in-depth understanding of wave-forced and tidally-forced sediment transport processes and to configure an analytical model of the two-inlet system that includes regional sediment sources, sinks, and pathways that could be used for evaluating engineering and management alternatives. This effort was funded by the RSM program and focuses on the CMS-M2D morphological modeling of the Big Sarasota Pass and New Pass inlet system. Qualitative and Quantitative comparisons of CMS-M2D and LIDAR derived bathymetric changes were conducted, for the period of May to November 2004, to demonstrate the ability of CMS-M2D to simulate the morphology of the area. | ||
'''BATHYMETRY''' | |||
LIDAR bathymetry from May 2004 and May 2006 illustrate very similar morphological features. Observed bathymetric changes, for the period May to November 2004, show evidence of alongshore shore transport along Lido Key, and erosion at the distal portion of the ebb shoal primarily to the wave induced transport during the three hurricanes in September 2004. One bar attached to the Siesta Key shoreline. Many of the same morphological patterns of Big Sarasota Pass are evident during May 2004 to May 2006, but with more erosion at the distal portion of the ebb shoal, increased accretion on the ebb shoal platform and the linear bar, and increased erosion and accretion downdrift of the ebb shoal attachment. One noteworthy difference between patterns during the two periods is the predominate accretion at the mouth of the main channel. | |||
[[Image:SAJ_BSPNP4.png|thumb|right|300px|Figure 1. New Pass and Big Sarasota Pass, Sarasota County, Florida.]] | [[Image:SAJ_BSPNP4.png|thumb|right|300px|Figure 1. New Pass and Big Sarasota Pass, Sarasota County, Florida.]] | ||
'''MODEL SETUP''' | |||
The M2D model grid was developed with a variable grid cell size ranging from 200 m on the offshore boundary to 30 m in the New Pass area and 40 m in the Big Sarasota Pass area (Figure 2). The STWAVE grid was developed with a constant grid cell size of 40m throughout the wave model domain. The wave model domain is similar to the M2D model domain from the offshore boundary to the shoreline and inlets but stops where the inlets encounter the back bay. This reduces the required computation time without reducing model accuracy since wave energy in the back-bay is expected to be minimal. | |||
The bathymetry data for M2D and STWAVE was developed by merging survey data from a variety of sources, including, GEODAS Data Base of NOS surveys, USACE LIDAR surveys from 2004 and 2006, and boat surveys in 2006. The NOS survey data, most of which was collected 50 years ago, is used in the offshore area generally between depths of 8 m and 10 m, where no recent LIDAR or boat survey data is available. LIDAR data collected in May 2004 was applied in the throat and ebb shoals of the inlets and in the near-shore areas to a depth of about 8 m along the Longboat, Lido, and Siesta Key shorelines. LIDAR data collected in May 2006 was utilized in the back-bay areas, including Sarasota and Roberts Bays. All model bathymetry was adjusted to the mean tide level reference based on the NOS benchmark at Sarasota Island Park in Sarasota Bay. | |||
[[Image:SAJ_BSPNP1.png|thumb|right|300px|Figure 1. New Pass and Big Sarasota Pass, Sarasota County, Florida.]] | [[Image:SAJ_BSPNP1.png|thumb|right|300px|Figure 1. New Pass and Big Sarasota Pass, Sarasota County, Florida.]] | ||
Latest revision as of 15:31, 9 December 2010
UNDER CONSTRUCTION
INTRODUCTION
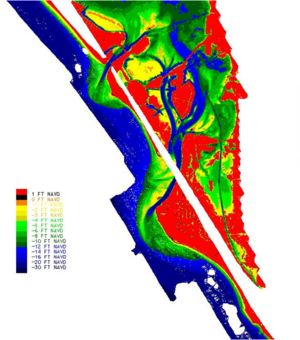
The Jacksonville District (SAJ) was directed to conduct a regional sediment study of a section of the Sarasota County, Florida Gulf Coast shoreline that encompasses New Pass and Big Sarasota Pass and the adjacent beaches (Figure 1) to develop an in-depth understanding of wave-forced and tidally-forced sediment transport processes and to configure an analytical model of the two-inlet system that includes regional sediment sources, sinks, and pathways that could be used for evaluating engineering and management alternatives. This effort was funded by the RSM program and focuses on the CMS-M2D morphological modeling of the Big Sarasota Pass and New Pass inlet system. Qualitative and Quantitative comparisons of CMS-M2D and LIDAR derived bathymetric changes were conducted, for the period of May to November 2004, to demonstrate the ability of CMS-M2D to simulate the morphology of the area.
BATHYMETRY
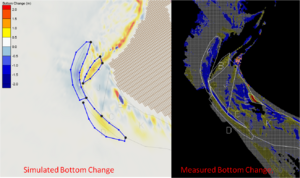
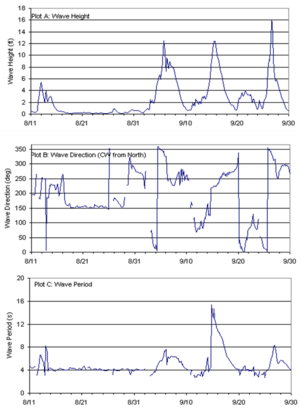
LIDAR bathymetry from May 2004 and May 2006 illustrate very similar morphological features. Observed bathymetric changes, for the period May to November 2004, show evidence of alongshore shore transport along Lido Key, and erosion at the distal portion of the ebb shoal primarily to the wave induced transport during the three hurricanes in September 2004. One bar attached to the Siesta Key shoreline. Many of the same morphological patterns of Big Sarasota Pass are evident during May 2004 to May 2006, but with more erosion at the distal portion of the ebb shoal, increased accretion on the ebb shoal platform and the linear bar, and increased erosion and accretion downdrift of the ebb shoal attachment. One noteworthy difference between patterns during the two periods is the predominate accretion at the mouth of the main channel.
MODEL SETUP
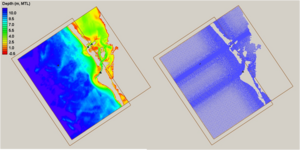
The M2D model grid was developed with a variable grid cell size ranging from 200 m on the offshore boundary to 30 m in the New Pass area and 40 m in the Big Sarasota Pass area (Figure 2). The STWAVE grid was developed with a constant grid cell size of 40m throughout the wave model domain. The wave model domain is similar to the M2D model domain from the offshore boundary to the shoreline and inlets but stops where the inlets encounter the back bay. This reduces the required computation time without reducing model accuracy since wave energy in the back-bay is expected to be minimal.
The bathymetry data for M2D and STWAVE was developed by merging survey data from a variety of sources, including, GEODAS Data Base of NOS surveys, USACE LIDAR surveys from 2004 and 2006, and boat surveys in 2006. The NOS survey data, most of which was collected 50 years ago, is used in the offshore area generally between depths of 8 m and 10 m, where no recent LIDAR or boat survey data is available. LIDAR data collected in May 2004 was applied in the throat and ebb shoals of the inlets and in the near-shore areas to a depth of about 8 m along the Longboat, Lido, and Siesta Key shorelines. LIDAR data collected in May 2006 was utilized in the back-bay areas, including Sarasota and Roberts Bays. All model bathymetry was adjusted to the mean tide level reference based on the NOS benchmark at Sarasota Island Park in Sarasota Bay.
