Idealized jettied inlet: Difference between revisions
No edit summary |
|||
| Line 32: | Line 32: | ||
wide range of wave heights. | wide range of wave heights. | ||
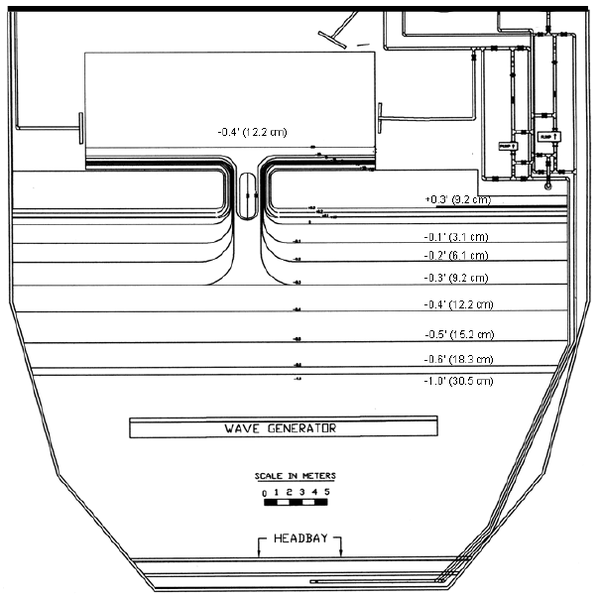
[[File:Idealized_Inlet_Model_Setup.png || | [[File:Idealized_Inlet_Model_Setup.png |thumb|right|600px|Figure 1. Physical model setup for the idealized inlet case (from Seabergh et al. (2005).]] | ||
Figure | |||
{| class="wikitable" border="1" | {| class="wikitable" border="1" | ||
|+ Table | |+ Table 1. Wave conditions (prototype scale) of three test cases from Seabergh et al. (2005). | ||
!Case !!Wave height*, m !!Wave period, s !!Wave Direction** | !Case !!Wave height*, m !!Wave period, s !!Wave Direction** | ||
|- | |- | ||
| Line 65: | Line 65: | ||
{| class="wikitable" border="1" | {| class="wikitable" border="1" | ||
|+ Table | |+ Table 2. CMS settings for the Seabergh et al. (2005) experiment. | ||
!Parameter !!Value | !Parameter !!Value | ||
|- | |- | ||
| Line 132: | Line 132: | ||
[[File:Idealized_Inlet_Wave_Heights.png ||leftthumb|400px|alt=framework]] | [[File:Idealized_Inlet_Wave_Heights.png ||leftthumb|400px|alt=framework]] | ||
Figure | Figure 2. Measured and calculated wave height (left) and mean current | ||
(right) vectors for Case 1. Background colors indicate the local water | (right) vectors for Case 1. Background colors indicate the local water | ||
depth corresponding to the right color bar. | depth corresponding to the right color bar. | ||
[[File:Cross-Shore_Transects.png ||leftthumb|400px|alt=framework]] | [[File:Cross-Shore_Transects.png ||leftthumb|400px|alt=framework]] | ||
Figure | Figure 3. Cross-shore transects of measured and calculated wave | ||
heights for Case 1 (<math>H</math> = 1.65 m, <math>T</math>= 11 s). For display purposes, wave | heights for Case 1 (<math>H</math> = 1.65 m, <math>T</math>= 11 s). For display purposes, wave | ||
heights are shifted by the number indicated on the left hand side of | heights are shifted by the number indicated on the left hand side of | ||
| Line 145: | Line 145: | ||
[[File:Cross-Shore_Transects_Measured.png ||leftthumb|400px|alt=framework]] | [[File:Cross-Shore_Transects_Measured.png ||leftthumb|400px|alt=framework]] | ||
[[File:Cross-Shore_Transects_Calculated.png ||rightthumb|400px|alt=framework]] | [[File:Cross-Shore_Transects_Calculated.png ||rightthumb|400px|alt=framework]] | ||
Figure | Figure 4. Cross-shore transects of measured and calculated longshore (left) and cross-shore (right) currents for Case 1 (<math>H</math>=1.65 m, <math>T</math>=11 s). For display purposes, current velocities are shifted by the number indicated on the left hand side of each transect. | ||
{| class="wikitable" border="1" | {| class="wikitable" border="1" | ||
|+ Table | |+ Table 3. Goodness-of-fit statistics* for Case 1 (<math>H</math>=1.65 m, <math>T</math>=11 s) | ||
!Variable !!NRMSE,% !!NMAE,% !!<math>R^2</math> !!Bias | !Variable !!NRMSE,% !!NMAE,% !!<math>R^2</math> !!Bias | ||
|- | |- | ||
| Line 178: | Line 178: | ||
[[File:Idealized_Inlet_Wave_Heights_Case2.png ||leftthumb|400px|alt=framework]] | [[File:Idealized_Inlet_Wave_Heights_Case2.png ||leftthumb|400px|alt=framework]] | ||
Figure | Figure 5. Measured and calculate wave height (left) and mean current | ||
(right) vectors for Case 2. Background colors indicate the local water | (right) vectors for Case 2. Background colors indicate the local water | ||
depth corresponding the right color bar. | depth corresponding the right color bar. | ||
| Line 184: | Line 184: | ||
[[File:Cross-Shore_Transects_Case2.png ||leftthumb|400px|alt=framework]] | [[File:Cross-Shore_Transects_Case2.png ||leftthumb|400px|alt=framework]] | ||
Figure | Figure 6. Cross-shore transects of measured and calculated wave | ||
heights for Case 2 (<math>H</math>=2.0 m, <math>T</math>=11 s). For display purposes, wave | heights for Case 2 (<math>H</math>=2.0 m, <math>T</math>=11 s). For display purposes, wave | ||
heights are shifted by the number indicated on the left hand side of | heights are shifted by the number indicated on the left hand side of | ||
| Line 201: | Line 201: | ||
[[File:Cross-Shore_Currents_Measured_Case2.png ||leftthumb|400px|alt=framework]] | [[File:Cross-Shore_Currents_Measured_Case2.png ||leftthumb|400px|alt=framework]] | ||
[[File:Cross-Shore_Currents_Calculated_Case2.png ||rightthumb|400px|alt=framework]] | [[File:Cross-Shore_Currents_Calculated_Case2.png ||rightthumb|400px|alt=framework]] | ||
Figure | Figure 7. Cross-shore transects of measured and calculated long-shore | ||
(left) and cross-shore (right) currents for Case 2 | (left) and cross-shore (right) currents for Case 2 | ||
(<math>H</math>=2.0 m, <math>T</math>=11 s). For display purposes, | (<math>H</math>=2.0 m, <math>T</math>=11 s). For display purposes, | ||
| Line 208: | Line 208: | ||
{| class="wikitable" border="1" | {| class="wikitable" border="1" | ||
|+ Table | |+ Table 4. Goodness-of-fit statistics* for Case 2 (<math>H</math>=2.0 m, <math>T</math>=11s) | ||
!Variable !!NRMSE,% !!NMAE,% !!R2 !!Bias | !Variable !!NRMSE,% !!NMAE,% !!R2 !!Bias | ||
|- | |- | ||
| Line 247: | Line 247: | ||
[[File:Measured_Calculated_Wave_Height_Case3.png ||leftthumb|400px|alt=framework]] | [[File:Measured_Calculated_Wave_Height_Case3.png ||leftthumb|400px|alt=framework]] | ||
Figure | Figure 8. Measured and calculated wave height (left) and mean current | ||
(right) vectors for Case 3. Background colors indicate the local water | (right) vectors for Case 3. Background colors indicate the local water | ||
depth corresponding the right color bar. | depth corresponding the right color bar. | ||
| Line 253: | Line 253: | ||
[[File:Measured_Calculated_Transects_Case3.png ||leftthumb|400px|alt=framework]] | [[File:Measured_Calculated_Transects_Case3.png ||leftthumb|400px|alt=framework]] | ||
Figure | Figure 9. Cross-shore transects of measured and calculated wave | ||
heights for Case 3 (<math>H</math>=3.25 m, <math>T</math>=8 s). For | heights for Case 3 (<math>H</math>=3.25 m, <math>T</math>=8 s). For | ||
display purposes, wave heights are shifted by the number indicated on | display purposes, wave heights are shifted by the number indicated on | ||
| Line 260: | Line 260: | ||
[[File:Cross-Shore_Currents_Measured_Case3.png ||leftthumb|400px|alt=framework]] | [[File:Cross-Shore_Currents_Measured_Case3.png ||leftthumb|400px|alt=framework]] | ||
[[File:Cross-Shore_Currents_Calculated_Case3.png ||rightthumb|400px|alt=framework]] | [[File:Cross-Shore_Currents_Calculated_Case3.png ||rightthumb|400px|alt=framework]] | ||
Figure | Figure 10. Cross-shore transects of measured and calculated long-shore | ||
(left) and cross-shore (right) currents for Case 3 (<math>H</math>=3.25 m, <math>T</math>=8 s). For display purposes, current velocities are shifted by the | (left) and cross-shore (right) currents for Case 3 (<math>H</math>=3.25 m, <math>T</math>=8 s). For display purposes, current velocities are shifted by the | ||
number indicated on the left hand side of each transect. | number indicated on the left hand side of each transect. | ||
| Line 268: | Line 268: | ||
{| class="wikitable" border="1" | {| class="wikitable" border="1" | ||
|+ Table | |+ Table 5. Goodness-of-fit statistics* for Case 3 (<math>H</math>=3.25 m, <math>T</math>=8 s) | ||
!Variable !!NRMSE, % !!RMAE, % !!<math>R^2</math> !!Bias | !Variable !!NRMSE, % !!RMAE, % !!<math>R^2</math> !!Bias | ||
|- | |- | ||
Revision as of 21:16, 17 April 2014
Test C2-Ex4: Idealized jettied inlet with equilibrium beach profile and oblique incident regular waves
Purpose
The purpose of this validation case was to evaluate the CMS for wave-induced hydrodynamics in the vicinity of an inlet with two absorbing jetties. The specific model features to be tested are the inline flow and wave coupling, wave-adjusted lateral boundary conditions, and Stokes velocities in the continuity and momentum equations.
Physical Experiment
In 2005 the USACE conducted a physical model study to collect both current and wave measurements in the vicinity of an idealized dual jetty inlet (Seabergh et al. 2005). The idealized inlet experiment was in a 46-m wide by 99-m long concrete basin with 0.6-m high walls. Figure 24 shows a map of the facility and basin area. A 1:50 undistorted Froude model scale was used to represent the dimensions of a medium-sized U.S. Atlantic coast inlet. The ocean side parallel contours correspond to an equilibrium profile , where h is the still water depth, is the cross-shore coordinate from the shoreline and is a grain size dependant empirical coefficient (equal to 0.1615 m here). For further details on the physical model and previous modeling results with CMS the reader is referred to Seabergh et al. (2005) and Lin et al. (2006). Fully reflective and absorbing jetties were constructed for inlet geometries studied in the physical model. However, all of the tests shown here are for the absorbing jetties since they represent those typically found in coastal applications. The incident wave conditions for the test cases used here are shown in Table 27. The three cases were chosen to cover a wide range of wave heights.
| Case | Wave height*, m | Wave period, s | Wave Direction** |
|---|---|---|---|
| 1 | 1.65 | 11.0 | -20º |
| 2 | 2.0 | 11.0 | -20º |
| 3 | 3.25 | 8.0 | -20º |
- Measured at the first offshore station approximately 50 m (prototype) from the jetty tips (see Figure 26).
- Clockwise from shore normal.
Model Setup
The computational grid and bathymetry for both CMS-Flow and CMS-Wave is shown in Figure 26. The grid has 31,422 active cells and a constant resolution of 10 m (prototype scale). A list of the basic model setup parameters is given in Table 28. A constant zero water level boundary condition was assigned to the offshore boundary of CMS-Flow. A wall boundary condition was used at all boundaries inside the bay.
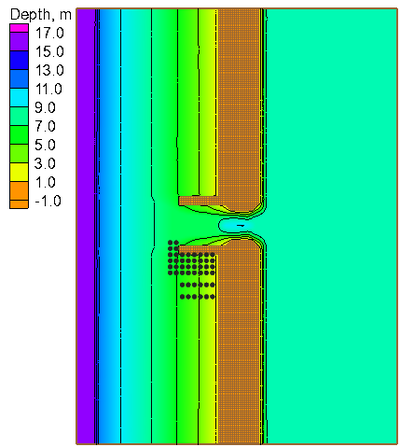 Figure 26. CMS computational grid showing the model bathymetry. Black
circles indicate current velocity and wave height measurement stations
used in this study.
| Parameter | Value |
|---|---|
| Flow time step | 6 min |
| Simulation duration | 4 hr |
| Ramp period duration | 3 hr |
| Manning’s n (both flow and wave grids) | 0.025 s/m1/3 |
| Steering interval | 1 hr |
| Roller | On |
| Roller dissipation coefficient | 0.05 (default for regular waves) |
| Stokes velocities | On |
| Wave reflection coefficient | 0.0 |
Default CMS settings were used where possible with the Manning’s
coefficient being the only calibrated parameter ( = 0.025 s/m) for
this case study. The roller dissipation coefficient was set to the
recommended value for regular waves (= 0.05). Both parameters were
held constant for all test cases. Including the roller is very
important for regular waves because it improves the prediction of the
long-shore current. The wave- and depth-averaged hydrodynamics
equations are solved for depth-uniform currents according to Phillips
(1977) and Svendson (2006). The formulation includes Stokes velocities
in both the continuity and momentum equations and provides a better
prediction of cross-shore currents.
Results and Discussion
The measured and calculated wave heights and wave-induced nearshore currents are presented in plan view vector plots and also cross-shore transects as discussed below. Note that the wave height and cross-shore profiles are offset by a number indicated to left of each transect which are plotted using different colors. Demirbilek et al. (2009) reported similar results for the wave height using a previous version of CMS. The current velocities reported here are significantly improved with respect to Demirbilek et al. (2009) due to the implementation of the surface roller and Stokes velocities.
Case 1 (=1.65 m, =11 s)
The calculated wave height magnitudes and directions agree well with the measurements with a NMAE of 10.62%(see Figures 27 and 28 and Table 29). The wave model tends to over predict wave refraction near the structure and shoreline. The breaker is located at approximately the third cross-shore measurement station from the shoreline and was well predicted by the model (Figure 28). Measured and computed current velocities for Case 1 are compared in Figures 27 and 29. The velocity field is characterized by a narrow longshore current approximately 75-m wide which is deflected seaward by the south jetty. The NRMSE and NMAE values for the longshore current are approximately 24 and 19%, respectively, while for the cross-shore current, they are significantly smaller at 14 and 10%, respectively (see Table 29). Most of the longshore current is located within the first 2 measurement stations from the shoreline. The calculated cross-shore currents agree well with the measurements except near the jetty where it was overestimated.
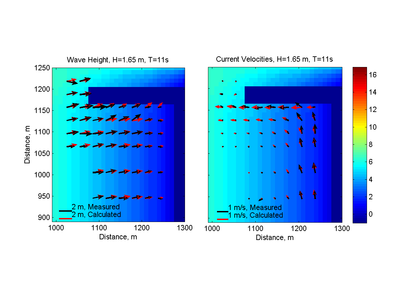 Figure 2. Measured and calculated wave height (left) and mean current
(right) vectors for Case 1. Background colors indicate the local water
depth corresponding to the right color bar.
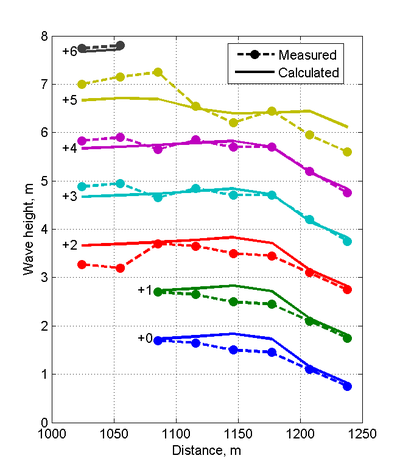 Figure 3. Cross-shore transects of measured and calculated wave
heights for Case 1 ( = 1.65 m, = 11 s). For display purposes, wave
heights are shifted by the number indicated on the left hand side of
each transect.
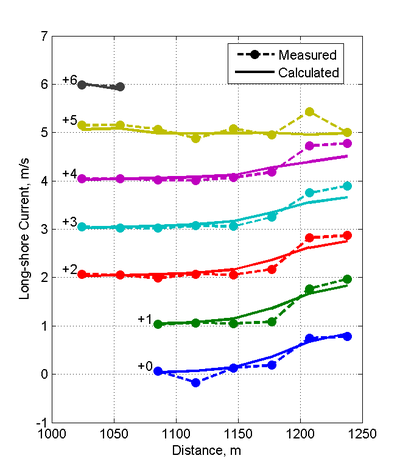
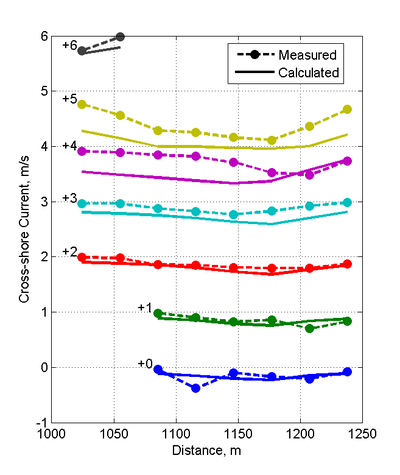 Figure 4. Cross-shore transects of measured and calculated longshore (left) and cross-shore (right) currents for Case 1 (=1.65 m, =11 s). For display purposes, current velocities are shifted by the number indicated on the left hand side of each transect.
- defined in Appendix A
| Variable | NRMSE,% | NMAE,% | Bias | |
|---|---|---|---|---|
| Longshore current | 24.11 | 18.74 | 0.836 | -0.141 m/s |
| Cross-shore current | 14.27 | 10.30 | 0.907 | 0.017 m/s |
| Wave Height | 13.96 | 10.62 | 0.826 | 0.051 m |
Case 2 (=2.0 m, =11 s)
The calculated wave height magnitudes and directions of Case 2 agree well with the measurements especially far away from the jetty (see Figures 30 and 31). The wave height NRMSE, NMAE, and are 12.33%, 8.05 %, and 0.889, respectively (see Table 30). Closer to the jetty, the differences are larger possibly due to reflected wave energy from the jetty. Even though the jetties were made of small stones and absorbed most of the wave energy, a small portion of the wave energy was reflected. CMS-Wave has the capability to simulate reflecting waves. However, for this study it was assumed that the jetty reflectance was negligible. Additional tests will be conducted in the future to test this hypothesis. The breaker is located at approximately the fourth cross-shore measurement station from the shoreline and was well predicted by the model.
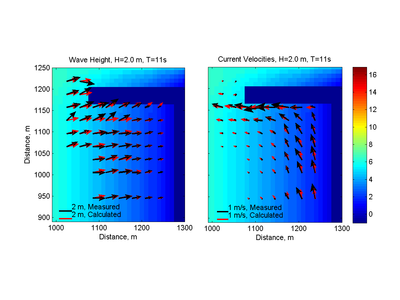 Figure 5. Measured and calculate wave height (left) and mean current
(right) vectors for Case 2. Background colors indicate the local water
depth corresponding the right color bar.
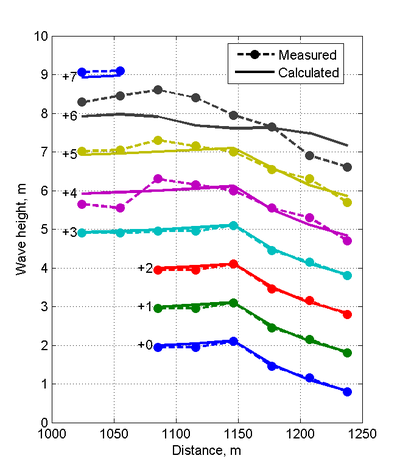 Figure 6. Cross-shore transects of measured and calculated wave
heights for Case 2 (=2.0 m, =11 s). For display purposes, wave
heights are shifted by the number indicated on the left hand side of
each transect.
Measured and calculated current velocities for Case 2 along cross-sectional transects, shown in Figure 32, have NRMSE and NMAE values less than 15 and 13%, respectively. Although the breaker zone for Case 2 is wider than in Case 1, most of the long-shore current is still located within the first 3 measurement stations from the shoreline. The calculated cross-shore currents tend to be underestimated near the shoreline and slightly overestimated outside of the breaker for all cross-shore transects except the one adjacent to the jetty.
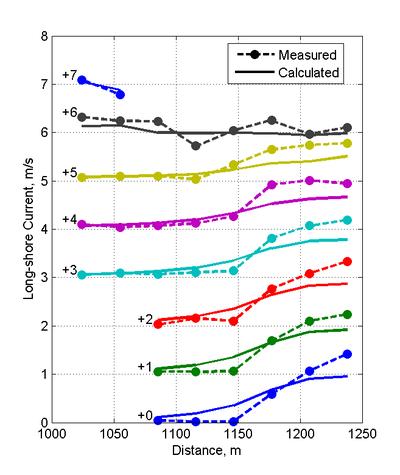
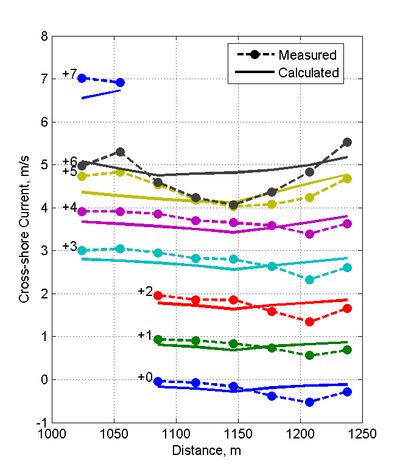 Figure 7. Cross-shore transects of measured and calculated long-shore
(left) and cross-shore (right) currents for Case 2
(=2.0 m, =11 s). For display purposes,
current velocities are shifted by the number indicated on the left
hand side of each transect.
| Variable | NRMSE,% | NMAE,% | R2 | Bias |
|---|---|---|---|---|
| Longshore current | 14.43 | 12.24 | 0.797 | -0.007 m/s |
| Cross-shore current | 14.69 | 11.49 | 0.930 | -0.065 m/s |
| Wave Height | 12.33 | 8.05 | 0.889 | -0.040 m |
| *defined in Appendix A |
Case 3 (=3.25 m, =8 s)
Figure 33 shows plan-view vector plots of the measured and computed wave heights and current velocities for Case 3. Cross-shore profiles of measured and computed wave heights and current velocities are plotted in Figures 34 and 35. For this case, the calculated wave heights are slightly overestimated for most of the measurement locations indicating the wave breaker coefficient was slightly overestimated for this steep wave condition. It is noted that wave breaker coefficient calculation is intended for irregular waves and has not been calibrated for regular waves. Wave directions agree well with the measurements with the exception of a few measurement stations where significant differences are observed in the incident wave angles. From the measurements it appears that the location of the breaker is outside of the measurement stations. The calculated longshore current velocities show the smallest NRMSE and NMAE of all three cases with values of 14 and 11%, respectively. The cross-shore velocities conversely, show the largest NRMSE and NMAE values of all three cases with values of 28 and 20%, respectively (Table 31). Measured and computed current velocities for Case 3 agree reasonably well. However, the long-shore current speed tends to be overestimated near the breaker.
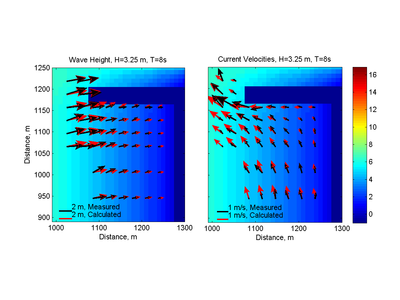 Figure 8. Measured and calculated wave height (left) and mean current
(right) vectors for Case 3. Background colors indicate the local water
depth corresponding the right color bar.
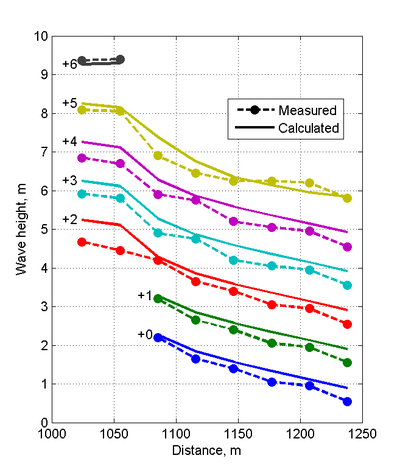 Figure 9. Cross-shore transects of measured and calculated wave
heights for Case 3 (=3.25 m, =8 s). For
display purposes, wave heights are shifted by the number indicated on
the left hand side of each transect.
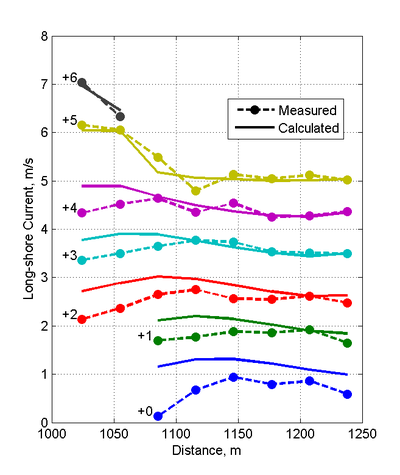
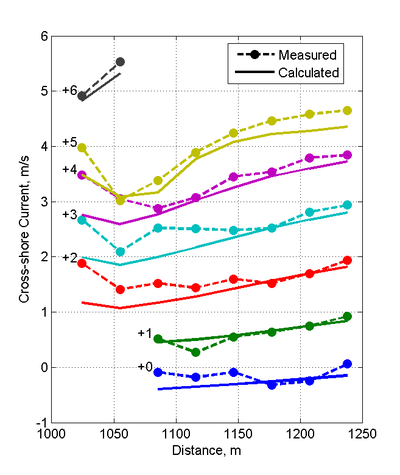 Figure 10. Cross-shore transects of measured and calculated long-shore
(left) and cross-shore (right) currents for Case 3 (=3.25 m, =8 s). For display purposes, current velocities are shifted by the
number indicated on the left hand side of each transect.
| Variable | NRMSE, % | RMAE, % | Bias | |
|---|---|---|---|---|
| Longshore current | 13.86 | 10.61 | 0.886 | -0.189 m/s |
| Cross-shore current | 27.75 | 20.48 | 0.676 | 0.158 m/s |
| Wave Height | 9.98 | 8.68 | 0.978 | 0.223 m |
| *defined in Appendix A |
Conclusions and Recommendations
Laboratory experiments were used to validate the CMS for cross-shore and longshore currents and waves near an idealized inlet with two fully-absorbing jetties. Measurements of regular waves and wave-induced currents were compared with CMS simulations at the prototype scale. The CMS was run using mostly default settings, except for the Manning’s coefficient (( = 0.025 s/m1/3) and roller dissipation coefficient ( = 0.05). Both parameters were held constant for all three cases. The value of the roller dissipation coefficient applied is the recommended value for regular waves. Model performance and behavior varied case by case but in general the calculated wave heights and wave-induced current velocities agreed reasonably well with measurements as indicated by the goodness-of-fit statistics. Calculated nearshore wave heights and currents upstream of a jetty were found to be within approximately 10-15% and 10-30%, respectively, of measurements. CMS-Wave was able to accurately predict the location of the wave breaker. However, tests were conducted in a physical model without tidal currents, winds, and with well known bathymetry and wave conditions which all represent additional potential sources of error in field applications. These results indicate that once the model is calibrated for a specific site, using mainly the bottom roughness, the model may be applied at the same site for different wave conditions without having to recalibrate the model. Using the wave- and depth-averaged hydrodynamic equations for depth-uniform currents as derived by Svendson (2006) significantly improved the nearshore currents most noticeably by producing an offshore directed flow or undertow. Including the surface roller improved the longshore currents by moving the peak longshore current closer to the shoreline.