IIAB/Overview/IIAB Users Guide: Difference between revisions
| Line 8: | Line 8: | ||
===CITATION:=== | ===CITATION:=== | ||
''Rosati, J.D., and Sumner, C.A. 2012. "Inlet Impacts on Adjacent Beaches - IIAB Java Program User's Guide," | ''Rosati, J.D., and Sumner, C.A. 2012. "Inlet Impacts on Adjacent Beaches - IIAB Java Program User's Guide," | ||
Wiki-TN-12-2, Vicksburg, MS: U.S. Army Engineer Research | Wiki-TN-12-2, Vicksburg, MS: U.S. Army Engineer Research and Development Center.'' | ||
===INTRODUCTION:=== | ===INTRODUCTION:=== | ||
Revision as of 14:07, 26 September 2012
Inlet Impacts on Adjacent Beaches - IIAB Java Program User's Guide
PURPOSE:
This Wiki-Technical note provides a User's Guide to the IIAB Java Program, which is available for download on the CIRP website[[1]]. For an inlet system bounded by adjacent beaches, the IIAB Program uses methods outlined in the Coastal Engineering Manual (CEM) Part V-6 to estimate the alongshore extent of inlet impact based on the volume of littoral sediment captured by the inlet. The user can load shoreline position, ebb and flood shoal volume (or volume change), and Operation & Maintenance (O&M) dredging volumes (or volume change) data to view plots and results.
CITATION:
Rosati, J.D., and Sumner, C.A. 2012. "Inlet Impacts on Adjacent Beaches - IIAB Java Program User's Guide,"
Wiki-TN-12-2, Vicksburg, MS: U.S. Army Engineer Research and Development Center.
INTRODUCTION:
The Inlet Impacts on Adjacent Beaches (IIAB) Java Program applies methods discussed in the Coastal Engineering Manual (CEM) Part V-6 (see p. V-6-29) to estimate the volumetric impact of an inlet on the adjacent beaches. The methods balance volume change on the updrift and downdrift beaches with the volume of littoral sediment captured by the inlet, accounting for Operation & Maintenance (O&M) dredging (Figure 1).
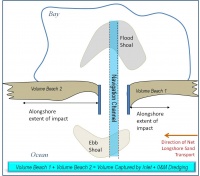
Five methods are described in the CEM to estimate the alongshore extent of inlet influence: (1) evaluation of historical shoreline (or volumetric) change; (2) even-odd analysis;(3) alongshore variations in beach morphology;(4) wave refraction analysis; and (5) examination of the "total inlet sink", or volume of littoral sediment captured by the inlet during the period of interest. The IIAB Program facilitates evaluation of Methods 1, 2, and 5, using shoreline position, berm crest and depth of closure data, ebb and flood shoal volume (or volume change) data, and O&M dredging volumes (or volume change) data. The user can upload *.csv (comma separated values) files with the data; example data files are provided both in U.S. customary and metric units. IIAB and the example files can be downloaded from the CIRP website [[2]], copied to a directory on the user's PC and unzipped.
AN OVERVIEW OF THE GRAPHICAL USER INTERFACE:
Figure 2 shows a screen shot of the graphical user interface (GUI) for IIAB.
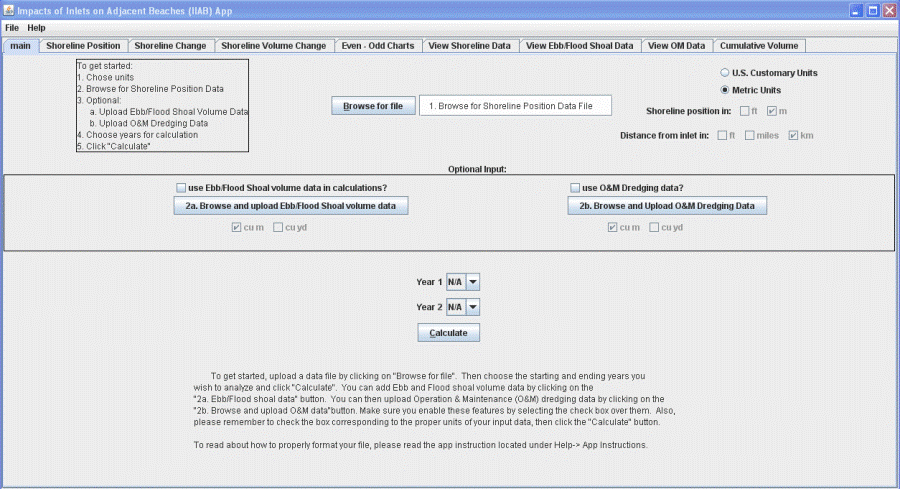
The GUI has tabs located toward the top, with each tab showing a specific set of data or graph that are created after data are input by the user and "Calculate" is executed. The main tab contains the interface for uploading and selecting the data that the user wishes to apply in calculations. At the start of the application, all tabs except for the main tab will be empty and will continue to be so until the user inputs data and clicks on 'Calculate' on the main tab.
At the top, the 'File' menu contains features to Open the file in excel, Open a new file in excel, Export data to file, and Print. 'Open the file in excel' will open the uploaded shoreline position data file. 'Open new file in excel' will open any .csv file in excel and will prompt the user to browse for a file. 'Export data to file' will export all data calculated by the application to the PC's clipboard. This means that the user will then be able to open any file they choose, click paste, and their data will be pasted into this file. Included in the zip file is an excel template for this purpose. The user can open the excel file and paste the data in the spreadsheet. The data will be pasted in and charts will be populated accordingly. The user can then save the excel sheet, but should use the 'save as' feature with a new file name in order to keep the template intact. The print feature in the application is not presently supported. In order to print, the user should either export the data to excel, or use the print screen feature of his or her computer.
INPUT FILE STRUCTURE:
All input files should be in either the .csv or .txt file formats. For either file format, the structure of the data within the file will be exactly the same.
Shoreline data files should be formatted as follows with all values delimited with commas:
The number of years or data sets
Date1, Date2, etc.....
Distance from inlet, berm, depth of closure, shoreline position at year1, shoreline position at year2, etc
0(inlet),0,0,0,0....etc
....
Distance from inlet,berm,depth of closure,shoreline position at year1,shoreline position at year2,etc.
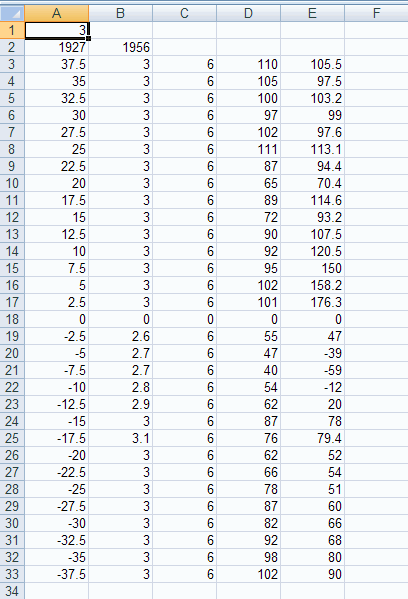
The center line of the inlet must be marked with a '0' for every column across that row. Here is an example of a properly formatted file with two years of data (1927 and 1956):
2
1927,1956
37.5,3,6,110,105.5
35,3,6,105,97.5
32.5,3,6,100,103.2
30,3,6,97,99
27.5,3,6,102,97.6
25,3,6,111,113.1
22.5,3,6,87,94.4
20,3,6,65,70.4
17.5,3,6,89,114.6
15,3,6,72,93.2
12.5,3,6,90,107.5
10,3,6,92,120.5
7.5,3,6,95,150
5,3,6,102,158.2
2.5,3,6,101,176.3
0,0,0,0,0
-2.5,2.6,6,55,47
-5,2.7,6,47,-39
-7.5,2.7,6,40,-59
-10,2.8,6,54,-12
-12.5,2.9,6,62,20
-15,3,6,87,78
-17.5,3.1,6,76,79.4
-20,3,6,62,52
-22.5,3,6,66,54
-25,3,6,78,51
-27.5,3,6,87,60
-30,3,6,82,66
-32.5,3,6,92,68
-35,3,6,98,80
-37.5,3,6,102,90
Data may also be formatted and saved in excel instead of a text editor, but the user must make sure to save the file as a .csv. This can be done by using the 'save as' feature of excel and then choosing the CSV format under 'save as type'. Figure 3 shows a properly formatted shoreline data file.

O & M dredging data should be formatted in this manner (Figure 4):
YearA, O&M Dredged in year A
YearB, O&M Dredged in year B
...
YearN, O&M Dredged in year N
Ebb and flood shoal data should be entered in this manner (Figure 5 shows the data properly formatted in excel):
YearA, Ebb Volume1, (or Ebb Volume rate), Flood Volume1, (or Flood Volume Rate)
YearB, Ebb Volume2, (or Ebb Volume rate), Flood Volume2, (or Flood Volume Rate)
If no rates are used, user should enter "0" as follows, if no volume data is being used, enter "0"
For example:
1927, 10076200,0,17983456,0
1956,11447900,0,18543700,0

UPLOADING FILES:
First, the user should select the appropriate units. Selecting 'U.S. Customary Units' or 'Metric Units' will force all input to be of the units system selected, e.g., feet or miles and cubic yards for U.S. Customary Units, or meters and cubic meters for Metric Units. To upload a shoreline position file, click on 'Browse for file' and browse for the appropriate shoreline data file. If the user is working in customary units, he or she will need to select the appropriate units for the 'Distance from inlet' data which are either in feet or miles. Then the user can enter the optional input data or proceed to calculate. When finished inputting data, the fields 'Year 1' and 'Year 2' will self populate with the available years in the shoreline data. The user should then select the two dates representing the start and end years of interest for the calculations and click on 'Calculate' Please note, 'Year 1' must come before 'Year 2' and 'Year 1' and 'Year 2' can not be the same year.
For the optional data, the user should click the check-boxes above the buttons for the additional input they wish to enter and browse for the appropriate files.
KNOWN ISSUES OR LIMITATIONS:
If the user inputs an extremely large file (in excess of about 200 alongshore data points), the program will not display the plots on the charts. This is not a bug, but rather a limitation of how many data points can be plotted. The program will still calculate the data and display it on the table. The user can export the data to excel to plot it on charts.
CALCULATIONS:
Even-Odd Analysis is described in the CEM-V-6 on p. V-6-30, see also Dean and Work (1993).
The total shoreline (or volume) change y at an alongshore distance x from the inlet is considered to be composed of an even (symmetric) component, yE(x), and an odd (antisymmetric)component, yO(x):
y(x) = yE (x) + yO (x)
where yE(x) = yE(-x), and yO(x) = -yO(-x)
The even and odd components are extracted from the total (measured) shoreline (or volume) change signal by
YE(x) = [y (x)+y (-x)] /2
Y0 (x) = [y (x)-y (-x)] /2
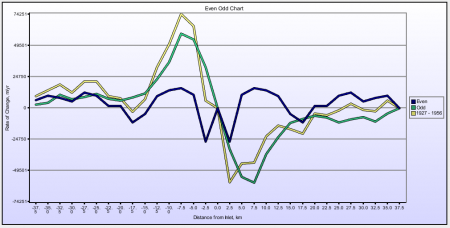
The even component is a change that is symmetric about the inlet center line (x = 0). Physically, it is interpreted as an ambient, or background change that is common to both shorelines adjacent to the inlet (e.g., storm erosion, relative sea level change), equal placement of fill on both sides of the inlet, or equal transport from the two shorelines into the inlet.
The odd component is antisymmetric about the inlet center line. It can be interpreted as the inlet’s interruption effect upon the net littoral drift (e.g., impoundment along the updrift shoreline and erosion along the downdrift shoreline), placement of fill on one side of the inlet, accretion of the shoreline due to an attachment of the ebb tidal shoal, etc. Again, volume change (instead of shoreline change) is as aptly used in these equations. Likewise, the difference in shoreline or volume changes before and after a given event in time can be considered by this approach. In this case, the given event may be the creation of, or some modification of, the inlet.
By its nature, the even-odd analysis assumes that shoreline changes (and transport processes) are symmetric/antisymmetric across the inlet center line. Accordingly, the degree to which results from the even-odd analysis accurately reflect actual inlet processes depends upon the degree to which the inlet-adjacent processes are, indeed, symmetric. Imbalances of volume change across the inlet are inherently spread across the inlet (i.e., split between the two shorelines) by the even-odd analysis.
The total littoral impact is described in the CEM-V-6 beginning on p. V-6-50:
An inlet's net sink effect is defined as the quantity of sediment the inlet has taken from the littoral system. In most cases, natural and stabilized inlets remove sand from the littoral system through accretion of adjacent shores, shoaling in channels, and accretion of ebb- and flood-tidal shoals. However, inlets with riverine input may be the source of littoral material for the coast (e.g., Columbia River, WA/OR).
- The net sink effect, or volumetric impact, is first computed by adding: the volume (or rate) of impoundment adjacent to the inlet entrance; the volume (or rate) of net sand accumulation within the inlet’s channels and shoals; the volume (or rate) of sand removed from the littoral system by dredging and offshore (or out-of-system) disposal. (If dredged material is placed on the adjacent beaches, it remains within the adjacent littoral system and thus is not added to the total).
- Then, the following is subtracted from this total: The volume (or rate) of riverine (or other upland) sedimentary input; the volume (or rate) of barrier removed due to creation (through dredging or breach) of the inlet (if this event is within the time period of consideration).
- The resulting value is the volume (or rate) of sand which has been removed from the adjacent shores’ littoral systems over the period of examination. Inlet-adjacent volume changes are then examined to discern the minimum distance away from the inlet along which this volumetric impact is manifest.
RESULTS:
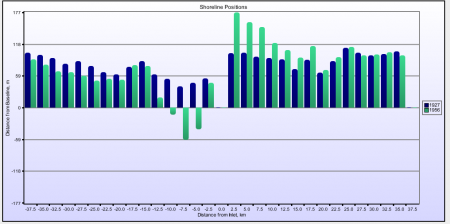
The IIAB calculates several plots, shown below using the example shoreline, Ebb/Flood shoal, and O&M data. Once these data are uploaded and the "calculate" has completed, shoreline position, rate of change, and volume change can be reviewed (Figures 5-7):
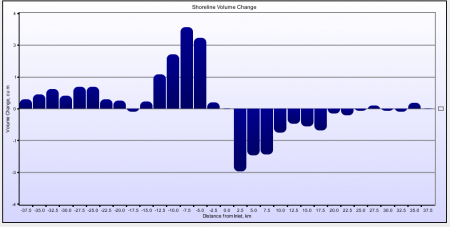
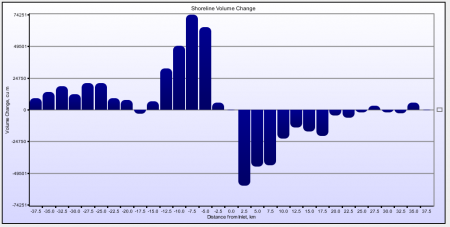
From these data, IIAB calculates the Even-Odd Functions as shown in Figure 8.
Using the shoreline volume change, shoal, and O&M data, IIAB calculates the total littoral impact, or cumulative volume change as a function of distance from the centerline of the inlet (Figure 9).
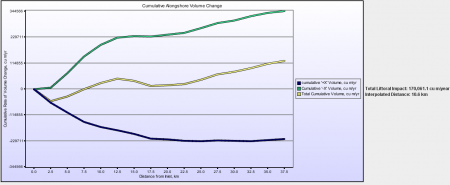
The user might interpret the inlet influence based on the Even-Odd analysis to be 20 km from the inlet (location at which the odd function reduces slope) or perhaps to the fullest extent of the data set, 37.5 km. However, the cumulative volume change analysis is more encompassing because it balances inlet and O&M changes with the adjacent beaches, and the Even-Odd method is only intended as a guide for use if only shoreline data are available.
Three cumulative volume change calculations are shown, for the "+x" (in this case, updrift), "-x" (downdrift) axes, and the total. The user can visually interpret these curves to indicate the distance from the inlet for which the inlet influence has decreased. This distance is discerned by a change in the slope of the total cumulative volume change curve, which in this case is estimated by IIAB as 10.6 km from the inlet. The IIAB estimates this distance by balancing the volumetric change on the adjacent beaches with the shoal evolution and O&M removed from the inlet. The user may choose another value depending on other knowledge of the site.
CONCLUSIONS:
The IIAB calculator is intended to provide quick analysis of shoreline and inlet volume change to assist with inlet sediment budgets and other inlet studies. For more information about the IIAB, or to suggest improvements, please contact Julie Rosati, Julie.D.Rosati@usace.army.mil, 251-635-9519.
REFERENCES:
U.S. Army Corps of Engineers. 2003. Coastal Engineering Manual (CEM) Part V-IV, "Sediment Management at Inlets", p. V-6-30-V-6-50.