CMS-Flow:Model Control:Output: Difference between revisions
No edit summary |
|||
| Line 16: | Line 16: | ||
{| border="1" | {| border="1" | ||
! Output Dataset !! Group !! Description !! Units !! | ! Output Dataset !! Group !! Description !! Units !! | ||
|- | |||
| Depth || Morphology || Cell-centered still water depth || m | |||
|- | |- | ||
| Current Velocity || Velocity || Depth-averaged and cell-centered current velocity vector dataset and with respect to local grid coordinates || m/s | | Current Velocity || Velocity || Depth-averaged and cell-centered current velocity vector dataset and with respect to local grid coordinates || m/s | ||
| Line 21: | Line 23: | ||
| Current Magnitude || Velocity || Depth-averaged and cell-centered current velocity magnitude dataset || m/s | | Current Magnitude || Velocity || Depth-averaged and cell-centered current velocity magnitude dataset || m/s | ||
|- | |- | ||
| | | Morphology || Morphology || Cell-centered morphology (bed) change. Positive is accretion and negative is erosion || m | ||
|- | |- | ||
| Concentration || Transport || Depth-averaged and cell-centered sediment concentration || kg/m^3 | | Concentration || Transport || Depth-averaged and cell-centered sediment concentration || kg/m^3 | ||
| Line 33: | Line 33: | ||
| Salinity || Transport || Depth-averaged and cell-centered sediment concentration capacity || kg/m^3 | | Salinity || Transport || Depth-averaged and cell-centered sediment concentration capacity || kg/m^3 | ||
|- | |- | ||
| | | Water height || Wave || Cell-centered water surface elevation || m | ||
|- | |- | ||
| | | Wave period || Wave || Cell-centered significant wave height|| m | ||
|- | |- | ||
| Wave | | Wave height vector || Wave || Cell-centered significant wave height vector || m | ||
|- | |- | ||
| Wave | | Wave dissipation || Wave || Cell-centered significant wave dissipation || m | ||
|- | |||
| Eddy Viscosity || Eddy viscosity || Cell-centered horizontal eddy viscosity || m^2/s | |||
|- | |- | ||
|} | |} | ||
Revision as of 21:49, 16 December 2022

Simulation Label
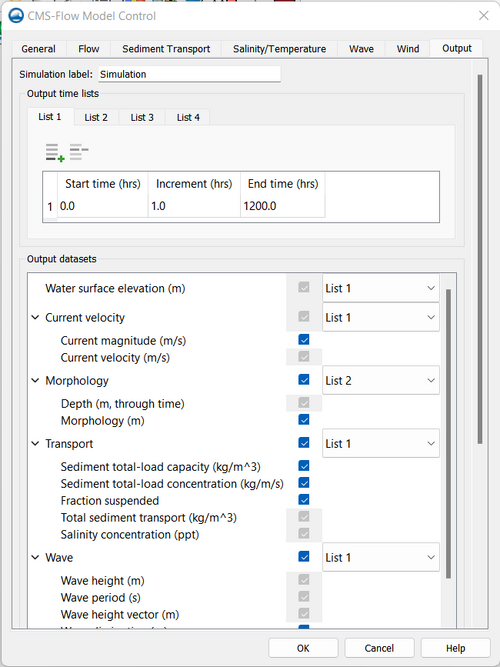
Change Simulation label, if desired. Users ma change the simulation if they changed time intervals or other variables into the model.
Output Times Lists
The times at which each group is output is determined by the selecting one of four user defined output time series or lists. In SMS versions 10.1 and earlier, the output time series were used. However, because the output time series can become very large for long-term simulations, the time series have been replaced by lists in which the output times are specifying a list of starting, ending and increments. This option is more compact and also makes it easier to manually change the output options in the cmcards file.
Output Datasets
Global output refers to the variables that are output on every active cell on the grid. The global output options are specified in Output tab of the CMS-Flow Model Control window. More information on the global output variables, groups and CMS-Flow cards is provided in the sections below. Change List to use for Morphology and Transport
Global output datasets are divided into groups and each group is assigned an output times, and file. A description of the various output datasets and the associated groups is provided in Global Output Datasets
| Output Dataset | Group | Description | Units | |
|---|---|---|---|---|
| Depth | Morphology | Cell-centered still water depth | m | |
| Current Velocity | Velocity | Depth-averaged and cell-centered current velocity vector dataset and with respect to local grid coordinates | m/s | |
| Current Magnitude | Velocity | Depth-averaged and cell-centered current velocity magnitude dataset | m/s | |
| Morphology | Morphology | Cell-centered morphology (bed) change. Positive is accretion and negative is erosion | m | |
| Concentration | Transport | Depth-averaged and cell-centered sediment concentration | kg/m^3 | |
| Capacity | Transport | Depth-averaged and cell-centered sediment concentration capacity | kg/m^3 | |
| Total Sediment Transport | Transport | Depth-averaged and cell-centered total-load sediment transport | kg/m/s | |
| Salinity | Transport | Depth-averaged and cell-centered sediment concentration capacity | kg/m^3 | |
| Water height | Wave | Cell-centered water surface elevation | m | |
| Wave period | Wave | Cell-centered significant wave height | m | |
| Wave height vector | Wave | Cell-centered significant wave height vector | m | |
| Wave dissipation | Wave | Cell-centered significant wave dissipation | m | |
| Eddy Viscosity | Eddy viscosity | Cell-centered horizontal eddy viscosity | m^2/s |
Statistical Output
Output options
For more information about the outputs format, please visit: