IIAB/Overview/IIAB Users Guide: Difference between revisions
No edit summary |
No edit summary |
||
| Line 53: | Line 53: | ||
5,3,6,102,158.2<br> | 5,3,6,102,158.2<br> | ||
2.5,3,6,101,176.3<br> | 2.5,3,6,101,176.3<br> | ||
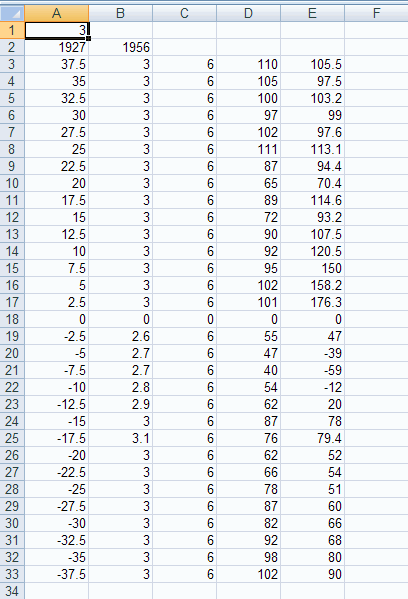
0,0,0,0,0 [[Image: | 0,0,0,0,0 [[Image:ExcelExample.jpg|500px|thumb|right|Fig. A – an example of a properly formatted shoreline data file in excel]] | ||
-2.5,2.6,6,55,47<br> | -2.5,2.6,6,55,47<br> | ||
-5,2.7,6,47,-39<br> | -5,2.7,6,47,-39<br> | ||
Revision as of 18:59, 23 May 2012
Inlet Impacts on Adjacent Beaches - IIAB Java Program User's Guide
PURPOSE:
This Wiki-Technical note provides a User's Guide to the IIAB Java Program, which is available for download on the CIRP website[[1]]. For an inlet system bounded by adjacent beaches, the IIAB Program uses methods outlined in the Coastal Engineering Manual (CEM) Part V-6 to estimate the alongshore extent of inlet impact based on the volume captured by the inlet. The user can load shoreline position, ebb and flood shoal volume (or volume change), and Operation & Maintenance (O&M) dredging volumes (or volume change) data to view plots and results.
CITATION:
 Rosati, J.D., and Sumner, C.A. 2012. "Inlet Impacts on Adjacent Beaches - IIAB Java Program User's Guide," Wiki-TN-12-2, Vicksburg, MS: U.S. Army Engineer Research
 and Development Center.
INTRODUCTION:
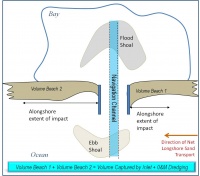
The Inlet Impacts on Adjacent Beaches (IIAB) Java Program applies methods discussed in the Coastal Engineering Manual (CEM) Part V-6 (see p. V-6-29) to estimate the volumetric impact of an inlet on the adjacent beaches. Generally, the methods balance volume change on the updrift and downdrift beaches with the volume captured by the inlet, accounting for Operation & Maintenance (O&M) dredging (Figure 1).

Five methods are described in the CEM to estimate the alongshore extent of inlet influence: (1) evaluation of historical shoreline (or volumetric) change; (2) even-odd analysis;(3) alongshore variations in beach morphology;(4) wave refraction analysis; and (5) examination of the "total inlet sink", or volume captured by the inlet during the period of interest. The IIAB Program facilitates evaluation of Methods 1, 2, and 5, using shoreline position, berm crest and depth of closure data; ebb and flood shoal volume (or volume change) data; and O&M dredging volumes (or volume change) data. The user can upload *.csv (comma separated values) files with the data; example data files are provided both in U.S. customary and metric units. IIAB and the example files can be downloaded from the CIRP website [[2]], copied to a directory on the user's PC and unzipped.
AN OVERVIEW OF THE GRAPHICAL USER INTERFACE:
Blah blah blah
INPUT FILE STRUCTURE:
All input files should be in either the .csv or .txt file formats. For either file format, the structure of the data within the file will be exactly the same. User data should be formatted as follows with all values delimited with commas:
The number of years or data sets Date1, Date2, etc..... Distance from inlet, berm, depth of closure, shore position at year1, shore position at year2, etc 0(inlet),0,0,0,0....etc .... Distance from inlet,berm,depth of closure,shore position at year1,shore position at year2,etc.
The center line of the inlet must be marked with just a '0' for every column across that row.
Here is an example of a properly formatted file with two years of data (1927 and 1956):
2
1927,1956
37.5,3,6,110,105.5
35,3,6,105,97.5
32.5,3,6,100,103.2
30,3,6,97,99
27.5,3,6,102,97.6
25,3,6,111,113.1
22.5,3,6,87,94.4
20,3,6,65,70.4
17.5,3,6,89,114.6
15,3,6,72,93.2
12.5,3,6,90,107.5
10,3,6,92,120.5
7.5,3,6,95,150
5,3,6,102,158.2
2.5,3,6,101,176.3
0,0,0,0,0

-2.5,2.6,6,55,47
-5,2.7,6,47,-39
-7.5,2.7,6,40,-59
-10,2.8,6,54,-12
-12.5,2.9,6,62,20
-15,3,6,87,78
-17.5,3.1,6,76,79.4
-20,3,6,62,52
-22.5,3,6,66,54
-25,3,6,78,51
-27.5,3,6,87,60
-30,3,6,82,66
-32.5,3,6,92,68
-35,3,6,98,80
-37.5,3,6,102,90
Data may also be formatted and saved in excel instead of a text editor, the user must make sure to save the file as a .csv. This can be done by using the 'save as' feature of excel and then choosing the CSV format under 'save as type'. Figure A shows a properly formatted shoreline data file.
UPLOADING FILES:
Blah blah blah
CALCULATIONS:
Blah blah blah
DISCUSSION:
Blah blah blah
CONCLUSIONS:
Blah blah blah
REFERENCES:
ref1 ref2