Inlet Geomorphic Analyses
Several geomorphic analyses of inlets have been conducted through the Geomorphic Evolution Work Unit of the CIRP. The goal of this type of research is to enhance our understanding of the natural and anthropogenically modified nature of tidal inlet systems and their navigation channels. The mission of the Geomorphic Evolution Work Unit is improve the knowledge of geomorphic properties and long-term evolution of inlets, and to develop useful tools in the management of this dynamic resource.
Each study listed below focuses on a comparison of some balance between the natural forces and the resultant geometric shape and morphologic characteristics of tidal inlets. Because many of our managed tidal inlets are not natural, several distinctions are made in the geomorphic analyses given below. These variances allow for a clearer understanding of how natural and modified (e.g. jettied) tidal inlets behave.
Geometric Properties
Aerial photographs and nautical charts were analyzed to evaluate the seaward and downdrift longshore extents of ebb tidal deltas for a number of the inlets within the database. Non-rectified aerial photographs of different scales were consulted, with individual photograph scales determined through comparison of distance between two stationary objects, such as two jetties. On some photographs, the ebb delta could be identified through calm water. For other photographs, the location of the ebb delta had to be inferred by wave refraction and diffraction patterns (Gibeaut and Davis, 1993). Uncertainty is associated with the latter situation. If the ebb delta could not be readily identified, the photograph was eliminated from analysis. For some Pacific coast and highly wave-exposed Atlantic coasts, the location of the breaking waves for fair-weather waves is located landward of the terminal lobe of the ebb delta (due to their great depths), and therefore nautical charts were necessary for analysis.

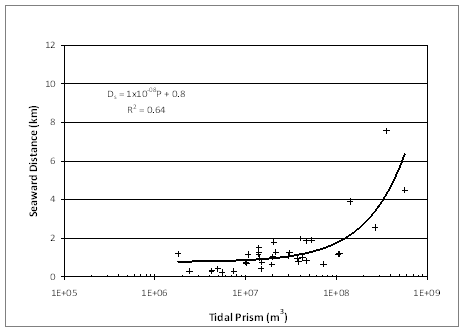
Two geometric properties of the ebb-delta plan view shapes were obtained from interpreting the photographs or nautical charts: the distance to the most seaward extent of the ebb delta Ds, and the distance to the down-drift attachment bar Dd. Although measurements were made from one source for each inlet (most recent aerial photograph or nautical chart), several sources were reviewed for the inlet to ensure the determination was reliable. Uncertainties introduced for the distance measurements are estimated to be 25 to 150 m, depending on the scale, distortion, and parallax on the aerial photograph. Inlets selected for analysis were considered mature and assumed to be in equilibrium.
The distance to the most seaward extent of the ebb delta Ds was measured from the water-beach interface. In aerial photographs, this distance was determined visually based on the identification of the ebb delta through tonal changes (Gibeaut and Davis 1993). Nautical charts were analyzed if aerial photographs were not available or if ebb delta plan views were not distinguishable on photographs, e.g., at Pacific coast inlets with greater ebb shoal extents. Distance to the seaward extent of the ebb delta on nautical charts was determined as the point at which the contour lines were oriented similar to offshore contours far from the inlet (Vincent and Corson 1981). This distance was visually clear and easily identified by assessment of the slopes at the terminal lobe of the ebb delta. Gentle contours were identified over the ebb delta, transitioning to greater slopes as the ebb delta met the continental shelf.
A consistent interpretation of the location of the shoreline from the aerial photographs and nautical charts was attempted. A baseline was determined with two end points located at the updrift and downdrift shorelines outside of the direct influence of the inlet or terminal structures. This methodology is similar to that of Gibeaut and Davis (1993), whose baseline end points were located where the ebb delta intersected the shoreline to obtain a shoreline trend from which their measurements could commence. Figure 2 shows an example of the shoreline trend utilized for measurement of the distance to the most seaward extent of the ebb delta. The identification of a baseline from which measurements are taken effectively eliminates ambiguity of an updrift and downdrift shoreline offset. For example, Grays Harbor, Washington, has a large shoreline offset (approximately 3 km), whereas Mason Inlet, North Carolina, has negligible offset. Shoreline offsets may be produced by coastal structures adjacent to the jetty or from the presence of the ebb delta attachment.
The distance to the downdrift attachment bar Dd was measured along a straight baseline set parallel to the trend of the shoreline. The measurement began at the downdrift inlet shoreline (at the narrowest section of the inlet channel) and ended at the location of the ebb delta attachment to the downdrift shoreline (Figure 1). If the location of the narrowest section of the inlet channel was not located along the baseline, then the measurement origin was translated perpendicularly to begin along the baseline. An attempt was made to determine a distance to the updrift attachment bar as done by Carr and Kraus (2001) for a limited number of inlets, but identification was difficult at most of the additional inlets examined. Updrift bypassing bars were found to be rare at inlets stabilized by jetties, so this parameter was not analyzed.
Back to Inlet Database