Structure
Introduction
In coastal applications, it is important for hydrodynamic and sediment transport models to simulate wave transmission and flow penetration through rubble mound structures (d’Angremond et al. 1996; Garcia et al. 2004; Tsai et al. 2006). The present study applies the methodology simulating the permeability of rubble mound structures (Reed 2010) in the CMS to Dana Point Harbor on the southern California coast. The hydrodynamic calibration and sediment transport validation are conducted against the field measurements.
Study area and data collections
Dana Point Harbor is located in Orange County on the US Pacific coast, 40 miles southeast of Los Angeles, CA. The harbor is entirely manmade and is protected from ocean waves by a pair of riprapped breakwaters constructed in the late 1960s. The breakwaters, consist of a long shore-parallel West Breakwater of 5,500 ft and a shore-normal East Breakwater of 2,250 ft (Figure 1), were designed as permeable structures. As these structures can dissipate wave energy and reduce wave reflection, the current and sediment transport can pass through. As a result, fine sands are accumulated inside the West Breakwater and maintenance dredging is required periodically (County of Orange 2009).
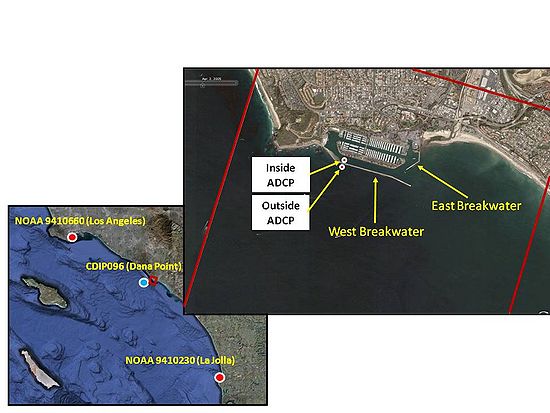
A field data collection program was designed for this study. A hydrographic multi-beam survey for the underwater portion along with the above-water mapping via the LiDAR scanning technology for the breakwaters was conducted in October 2009 (Fugro West 2010). Bathymetric data were also collected in the marina basins, harbor entrance and nearshore areas outside the harbor. Two ADCPs were deployed from November 2009 through January 2010 to collect current and water level inside (without wave data collection) and outside (with wave data collection) the West Breakwater (Figure 1). Because of the instrument failure, only initial six days of data were recovered from the outside ADCP. In the last 20 years, Orange County has conducted three maintenance dredges to remove fine sand material that moved through and deposited on the harbor side of the West Breakwater. The dredged volumes inside the West Breakwater are approximately 25,000 cy in 1990, 35,500 cy in 1999, and 54,000 cy in 2009 (County of Orange 1990; 1999; 2009).
Methodology
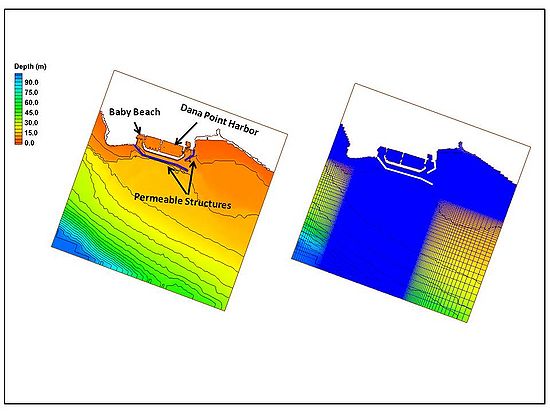
In the CMS, both the West and East Breakwaters were specified as permeable structures, through which wave transmission, flow and sediment seepage were implemented. Figure 2 shows the CMS rectangular grid domain that consists of 399 ´ 327 cells surrounding Dana Point Harbor. The water depth ranges from 0 m at Baby Beach to 9 m at the harbor entrance channel inside the marina and increases to more than 10 m outside the West Breakwater. The offshore area further deepens to a few hundred meters and is open to the Pacific Ocean. A variable-resolution grid system was created to discretize the entire harbor and the offshore region, which permits much finer grid resolution (5 m) in areas of high interest such as the harbor and the breakwaters. The model domain extends approximately 5 km alongshore and 4 km offshore, and the offshore boundary of the domain reaches to the 300‑m isobath.
Results and discussion
The CMS simulations were conducted for a 10-day period from 18 to 27 November, 2009, which covers the beginning stage of the inside ADCP survey and the entire record of the outside ADCP survey. The calculated wave parameters are compared with the measurements at the outside ADCP station (Figure 3). The mean significant wave height is 0.75 m. Wave heights for the 10-day period are mostly less than 1.0 m. The mean wave period is 13.5 sec, and the predominant wave direction is west-southwest. Comparing to the 2008 annual data, the 6-day period represents a slightly lower wave height and a typical wave direction in November. The wave transformation results show a good consistency with the measured wave parameters. An underestimate of wave height in the first couple of days could be related to the wind forcing since the wind data used were obtained from a different buoy.
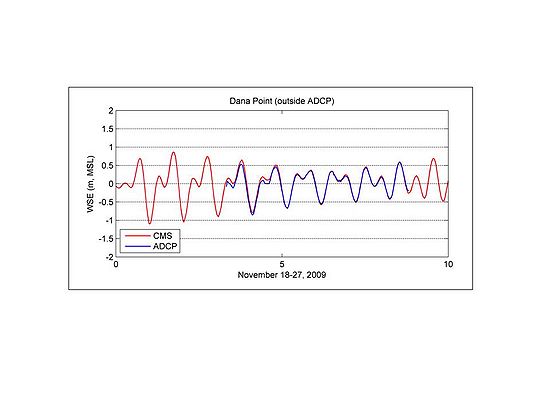
Figure 4 shows the comparison of calculated and measured WSEs at the outside ADCP station from 18 to 27 November 2009. During this neap tidal period, the CMS results well reproduce the tidal signals displayed in the 6-day WSE survey outside of the West Breakwater.
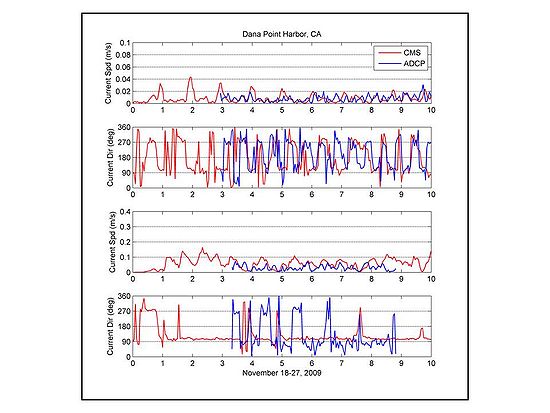
The current measurements show different flow patterns at the inside and outside ADCP stations during this simulation period. The depth averaged current has a small speed of less than 2 cm/s but shows a clear flood and ebb tidal current signal along the breakwater at the inside ADCP station. The current speed at the outside ADCP station has a magnitude of about 4-5 cm/s and the dominant current directions are from west northwest (i.e., traveling along the west breakwater). Figure 5 compares the calculated current with the measurements at both inside and outside ADCP locations. In the first 2-3 days, the calculated results show that the harbor area experienced a few short periods of relatively high currents. By checking all the forcing terms in the model, the spring tide is probably responsible for those speed spikes inside and outside of the harbor (Figure 4). Similar to the ADCP data, the calculated current directions at the inside station are basically corresponding to the flood (260-300°) and ebb tide (80-120°) although the CMS results show some discrepancies at a few occasions. It is a wave-controlled environment outside the West Breakwater. Both the measured and the calculated flow directions reveal that the currents move predominantly east-southeastward parallel to the breakwater.
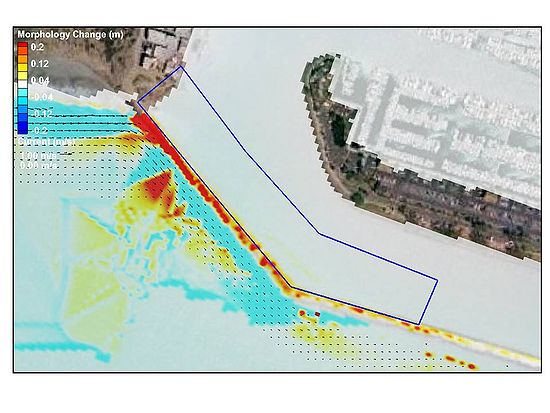
The Google Earth photograph taken in 2005 (Figure 1) shows sand penetration through and sand accumulation inside the West Breakwater before the 2009 harbor maintenance dredge. Based on this latest dredging information, average annual sediment transport rate is around 5,000-6,000 cy. To estimate the sediment seepage through the permeable structure, the transport module in the CMS was set up. The structure permeability was specified by testing and adjusting the resistance parameters in the Forchheimer equation and the structure void space in the conservation of mass equation. Figure 6 shows the morphology change surrounding the west portion of the West Breakwater at the end of the 10-day simulation. Although small, sand accretion can be detected inside the harbor and the distribution pattern of the bed change looks similar to the Google Earth photograph shown in Figure 1. Transport within a structure cell is greatly reduced by the weaker flow speed, lower wave energy, and subsequent smaller bottom stresses. As a result, large deposition occurs within the breakwater. To estimate total sediment volume changes related to the sediment seepage through the breakwater, a polygon area is drawn by the breakwater inside the harbor on Figure 6. The morphology and bed volume changes within the area were estimated at the end of the simulation. Time extrapolation of the CMS results presented an approximate sediment transport rate of 4,000 cy annually through the West Breakwater, which is quantitatively comparable to the average annual volumes dredged inside of the West Breakwater.
Conclusions
Wave transmission and flow penetration through a permeable breakwater were incorporated into the CMS, a coupled wave, flow and sediment transport numerical modeling system. The model performance was validated by the measured waves, current, and water surface elevation. The implementation of the algorithms for flow and sediment seepage through the permeable breakwater was verified by the historical dredging information.
The CMS results indicate that it is a tide-dominated environment inside and a wave-dominated environment outside the West Breakwater at Dana Point Harbor. During the 10-day simulation (corresponding to a neap tide) for 18 to 27 November, 2009, the depth average current has a speed of 2-10 cm/s. Sensitivity tests reveal that the flow variations inside the harbor are closely associated with the wind forcing and the specifications of the porous structure.
By applying and adjusting the parameters of the breakwater porosity and flow resistance, sediment transport through the permeable structure was estimated. The sediment transport rate obtained from the CMS simulations was validated via the volumes from the historical maintenance dredging activities at Dana Point Harbor.
References
County of Orange. (1990). “Plans and special provisions for the maintenance dredging at Dana Point Harbor,” funded by Harbor, Beaches and Parks, County of Orange.
County of Orange. (1999). “Plans and special provisions for the maintenance dredging at Dana Point Harbor,” funded by Harbor, Beaches and Parks, County of Orange.
County of Orange. (2009). “Plans and special provisions for the maintenance dredging at Dana Point Harbor,” funded by Harbor, Beaches and Parks, County of Orange.
d’Angremond, K., Van der Meer, J. W., and de Jong, R. J. (1996). “Wave transmission at low-crested structures,” Proceedings 25th International Conference on Coastal Engineering, Orlando, FL. USA, ASCE, 2418-2427.
Fugro West Inc. (2010). "USACE Dana Point Harbor breakwater comprehensive condition survey,” Field Operation Report.
Garcia, N., Lara, J. L., and Losada, I. J. (2004). “2-D numerical analysis of near-field flow at low-crested permeable breakwaters,” Coastal Engineering, 51, 991-1020.
Reed, C. W. (2010). “Representation of Rubble Mound Structures in the Coastal Modeling System,” Coastal and Hydraulics Engineering Technical Note ERDC/CHL CHETN-XX-XX. U.S. Army Engineer Research and Development Center, Vicksburg, MS. An electronic copy of this CHETN is available from http://chl.erdc.usace.army.mil/chetn.
Tsai, C.P., Chen, H. B., and Lee, F. C. (2006). “Wave transformation over submerged permeable breakwater on porous bottom,” Ocean Engineering, 33, 1623 - 1643.