Publications:CIRP-WN-10-1
Post-Processing Coastal Modeling System Simulations: Part 1, Calculating Volumetric Change
PURPOSE: : This Coastal and Hydraulics Engineering Technical Note (CHETN) is the first in a series that presents methods for analyzing output from Coastal Modeling System (CMS) simulations. Part 1 discusses calculation of volumetric change using results of a 1-year CMS simulation for Shark River Inlet, New Jersey.
CITATION:
Rosati, J.D., Beck, T.M., and Sanchez, A., 2010, Post-Processing Coastal Modeling System Simulations, Part 1, Calculating Sand Transport Rates,Coastal and Hydraulics Engineering Technical Note ERDC/CHL CHETN-XX-XX, Vicksburg, MS: U.S. Army Engineer Research and Development Center,http://chl.erdc.usace.army.mil/chetn.
INTRODUCTION: The Coastal Modeling System (CMS) is an integrated wave, current, sediment transport, and morphology change numerical model within the Surface Water Modeling System (SMS) (Buttolph et al. 2006, Lin et al. 2008, CIRP 2010, and Wu et al. 2010). The CMS is designed for practical engineering calculations in the coastal zone, including coastal inlets, inlet structures such as jetties, and navigation channels. Processes calculated within the CMS include tidal forcing, wind, wave-driven currents, and the resulting sediment transport and morphology change. Three sediment transport models are available to calculate the transport due to bed and suspended loads, and resulting morphology change. Wave and structure calculations include reflection, diffraction, refraction, transmission, runup, and overtopping. The CMS calculates coastal and inlet processes and the resulting morphology change for simulation periods ranging from hours to months up to a year (e.g., Beck and Kraus 2010).
The analyses discussed herein present methods to analyze CMS output for volumetric change within a defined polygon such as a section of a navigation channel or a morphologic feature such as an ebb shoal. The step-by-step procedure is applied to CMS output from a study at Shark River Inlet, New Jersey (Beck and Kraus 2010). CMS output files applied herein are available for download: http://cirp.usace.army.mil/wiki/Applications.
OVERVIEW OF SHARK RIVER INLET SIMULATION: The Shark River Inlet calculations were conducted for a 1-year simulation to determine future conditions of the navigation channel under different channel and structural configurations. The model was first calibrated for hydrodynamics, and then for sediment transport and morphology change through comparison of pre- and post-dredging bathymetric surveys (conducted by the Corps of Engineers, New York District). For the Shark River application discussed herein, the total load non-equilibrium sediment transport model with Lund-CIRP transport equations were applied and used with the bed change equation to calculate the morphology change. Simulation results were both calibrated and validated based on short-term measurements of channel infilling, following the frequent 3-4 month channel surveys, and with model simulations extending to a year of calculations. The model was forced with the Sandy Hook NOAA tide gauge for water levels and currents, and offshore waves from Wave Information Study (WIS) Station 129 for 1994 were applied for wave-current interaction.
CALCULATING VOLUME CHANGE: Calculating volume change is necessary for determining rates of channel infilling, inlet shoal evolution, and on a more basic level understanding sand pathways and formulating sand budgets. In the CMS, volume change can be calculated for any polygon defined by feature arcs in the SMS. The following section presents a step-by-step method for calculating volumetric change using the Shark River Inlet simulation files.
Loading Files and Setting Projection: Download the Shark River Inlet calculation file SRI.zip from: http://cirp.usace.army.mil/wiki/Applications. Unzip the files in a directory on your PC.
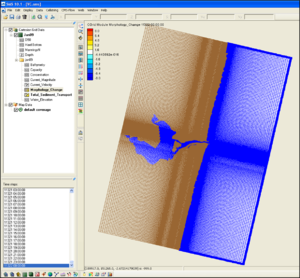
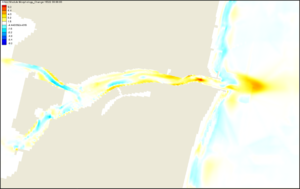
Load the file Shark River Inlet.cmcards into SMS by dragging it into the SMS or by clicking File | Open | Shark River Inlet.cmcards. The solution file should load in automatically as shown in Figure 1a. Once you have loaded the solution file, zoom in to show the channel region (Figure 1b).
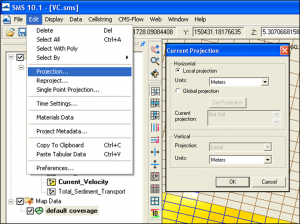
CMS makes calculations in metric units, so to make sure the volumetric change is interpreted properly in SMS, you need to check that your projection is in meters by clicking the top toolbar under Edit – Projection (Figure 2).
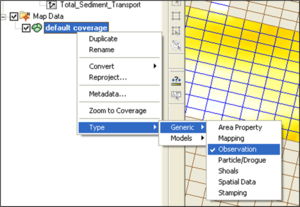
Defining a polygon for volumetric change: To begin defining the polygon in which we will calculate volume change, you will define a transect or Feature Arc in SMS and convert this arc or a set of arcs into a polygon. To start, in the project explorer to the left of the SMS window, Right-click on the default coverage and select Type | Generic | Observation (Figure 3).
Next, zoom into the area of interest and create a Feature Arc. Make sure you are in the Map module by clicking on the Map Module Tool or by clicking on Map Data. The Map Module toolbar should become available in the SMS window. Click on the Create Feature Arc tool (Figure 4).

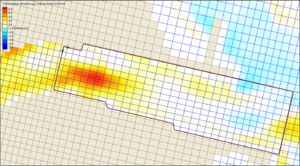
A polygon can be created with the Feature Arc tool that delineates the area of interest. For this example, a Feature Arc delineating the inlet navigation channel from the landward bend in the channel (west) out seaward to the 5.5 m contour is chosen to document the channel infilling rate (Figure 5).
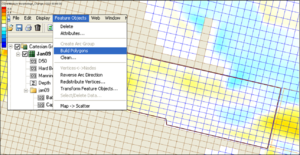
To select the Feature Arc, click on the Select Feature Arc tool ![]() and click on the Feature Arc. Next we will convert the Feature Arc into a polygon. With the Feature Arc selected, click on Feature Objects | Build Polygons (Figure 6).
and click on the Feature Arc. Next we will convert the Feature Arc into a polygon. With the Feature Arc selected, click on Feature Objects | Build Polygons (Figure 6).
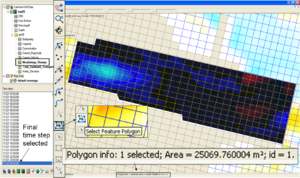
Select the Polygon by clicking on the Select Feature Polygon tool  (Figure 7). Note that Morphology_Change is selected in the left file tree structure and the final time step is selected in the Time steps window. The area of the polygon is shown at the bottom of the SMS window.
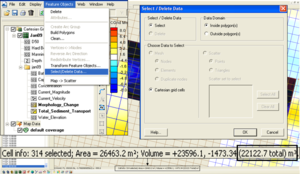
Calculate Volume Change: To integrate volume change within the defined polygon at the time step selected, click on Feature Objects | Select/Delete Data, and in the window that pops up, choose Inside polygon(s)for the Data Domain, then OK (Figure 8). SMS will calculate statistics about the selected cells within the polygon and summarize these in the bottom portion of the window. Note that the calculation represents the area and cumulative volume change associated with the selected cells that are in contact with the polygon; this area will most likely be slightly different than the polygon area that was calculated in Figure 7. The net volumetric change for the example channel polygon shown in Figure 8 is approximately 22,000 cu m.
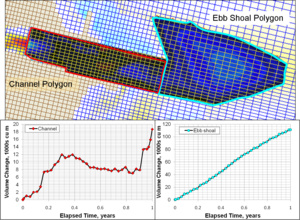
Interpretation of Results: With the polygon selected in the main SMS window, scroll through selected time steps of interest (bottom left window) and note the volume for each one in a spreadsheet. Figure 9 shows volumetric change for the Shark River Inlet channel and ebb shoal through time. The channel polygon in Figure 9 was selected to match the channel survey data available from the New York District, so that calculated infilling could be compared to measurements. Calculations show a large initial infilling during the first 0.25 year, followed by a slightly scouring period, and once again increasing during 0.75-1 year. The greater rates of volume change in the first quarter (Jan – Mar) and last quarter (Oct-Dec) of the year illustrate the influence of storms in transporting larger sand volumes into the channel during these periods. In contrast, the ebb shoal increases in volume continually during this period of time, indicating that it is likely not yet in equilibrium. We would expect that the ebb shoal’s rate of growth would decrease for longer simulation periods over multiple years.
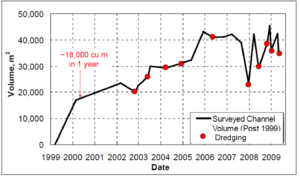
For comparison, Figure 10 shows the measured (surveyed) volume change in the channel for this same region of the channel (from the bridge out to the -5.5 m Mean Low Water elevation contour; modified from Figure 16 of Beck and Kraus, 2010). The measured channel infilling shows ~ 18,000 cu m in the first year, comparable to the calculated channel infilling shown in Figure 9. In recent years, shoaling has increased to 30,000-40,000 cu m/year, and the New York District must dredge the channel quarterly to maintain navigability.
CONCLUSIONS: This CHETN is Part 1 of a series discussing post-processing of Coastal Modeling System (CMS) simulations. Herein we present a step-by-step method for calculating volume change within defined polygons. With this method, the time history of volume change for defined polygons can be calculated within SMS. Output files used in the examples are provided for download from the CIRP wiki (http://cirp.usace.army.mil/wiki/Applications).
ADDITIONAL INFORMATION: This CHETN was prepared as part of the Coastal Inlets Research Program (CIRP) under the Inlet Engineering Toolbox work unit, and was written by Dr. Julie Dean Rosati (Julie.D.Rosati@usace.army.mil), Ms. Tanya Beck (Tanya.M.Beck@usace.army.mil), and Mr. Alejandro Sanchez (Alejandro.Sanchez@usace.army.mil ) of the U.S. Army Engineer Research and Development Center (ERDC), Coastal and Hydraulics Laboratory (CHL). The Shark River Inlet application used to illustrate the method was part of a study conducted for the USACE District, New York. Ms. Irene Watts, New England District, reviewed this CHETN. This CHETN should be cited as follows:
Rosati, J.D., Beck, T.M., and Sanchez, A., 2010. Post-Processing Coastal Modeling System Simulations: Part 1, Calculating Sand Transport Rates. Coastal and Hydraulics Engineering Technical Note ERDC/CHL CHETN-XX-XX. Vicksburg, MS: U.S. Army Engineer Research and Development Center. http://chl.erdc.usace.army.mil/chetn.
REFERENCES:
Beck, T.M., and Kraus, N.C. 2010. Shark River Inlet, New Jersey, Entrance Shoaling: Report 2, Analysis with Coastal Modeling System. Coastal and Hydraulics Laboratory Technical Report 10-4. Vicksburg, MS: U.S. Army Engineer Research and Development Center, U.S.A.
Buttolph, A.M., Reed, C.W., Kraus, N.C., Ono, N., Larson, M., Carmenen, B., Hanson, H., Wamsley, T., and Zundel, A.K. 2006. Two-dimensional depth-averaged circulation model CMS-M2D: Version 3.0, Report 2: Sand transport and morphology change. Coastal and Hydraulics Laboratory Technical Report ERDC/CHL TR-06-9. Vicksburg, MS: U.S. Army Engineer Research and Development Center, U.S.A.
Coastal Inlets Research Program (CIRP), 2010. CIRP wiki – CMS. http://cirp.usace.army.mil/wiki/CMS , last updated 28 July 2010, accessed 16 August 2010.
Lin, L., Demirbilek, Z., Mase, H., Zheng, J., and Yamada, F. 2008. CMS-Wave: A nearshore spectral wave processes model for coastal inlets and navigation projects. Coastal and Hydraulics Laboratory Technical Report ERDC/CHL TR-08-13, Vicksburg, MS: U.S. Army Engineer Research and Development Center, U.S.A.
Wu, W., Zhang, M., and Sanchez, A. 2010. An implicit 2-D shallow water flow model on unstructured quadtree rectangular mesh. J. Coastal Res., in press.
Zundel, A. K., 2000. Surface-water modeling system reference manual. Brigham Young University, Environmental Modeling Research Laboratory, Provo, UT.