CPT General Layout
Setting the level of analysis (Reach, Project, District, Division)
CPT is designed to enable analysis of commercial utilization of the Corps-maintained waterway infrastructure at a variety of coverage levels. At the most detailed level, individual channel sub-reaches may be chosen for analysis and compared to other sub-reaches in the USACE portfolio of navigation projects. However, in order to provide decision support to personnel at all levels of Corps management, CPT can also be used to analyze and compare commercial usage figures at the Project, District, and Division levels. For example, a District program manager might want to see which navigation project under his or her control handles the most exports of a particular commodity. CPT pulls from a large database that is maintained by the Corps’ Waterborne Commerce Statistics Center (WCSC). Setting the desired level of analysis is done through the CPT Home screen: https://cpt.usace.army.mil/. Figure 1 shows the four levels of analysis provided by CPT; the desired level is chosen by simply clicking on the respective link.
Selection of items to be ranked and/or analyzed
The entities (reaches, Project, Districts, etc.) to be analyzed and or compared using CPT is determined via the selection made on the CPT Home screen. Once this selection is made, the user is taken to a selection page wherein the desired entities can be selected from a nested drop-down tree. Figure 2 shows the nested tree magnified on the left side of the selection page.
br style=clear:both /
Nested selection tree
The tree is organized into a hierarchy starting at the division level and then progressing to district, project and finally reach levels. Starting at the Division level the user may open each successive level of the drop-down tree by clicking the small triangles next to each division, district or project name. If the reach level of analysis was chosen the user may select all of the reaches within a division by selecting the box next to a division name. Similarly all the reaches in a particular district or project may be selected by clicking the associated boxes. If the user wishes to select individual reaches for analysis he/she may burrow to the reach level within the tree and click the box(es) assosiated with the desired reach(es).
Depending on the level of analysis selected the CPT will only allow the user to open the associated level in the tree. For example, if the user selected the district level for analysis he/she would be able to open the division level of the tree and make district selections; but he/she would not be able to open any of the districts to see the project level. Figure 3 shows the selection of the Ashtabula, OH reach, within the Ashtabula Harbor Project, the Buffalo District and the Great Lakes and Rivers Division.
br style=clear:both /
Uploading Channel Conditions
In an effort to obtain the most accurate data possible CPT includes a feature allowing authorized district personnel to upload actual channel conditions to be included in CPT analyses. After selecting reaches from the nested tree and pressing the Update Selections Button the table on the right of the Reach Selection page will be populated with all the selected reaches. Figure 4 shows the table populated with reaches from the Galveston District. The authorized user may then upload channel limiting depths and shoaling rates by clicking on the row containing the desired reach and entering values into the pop-up window. Alternatively, the authorized user may select the Download Excel Template button after the table has been populated to enter values into an excel spreadsheet. This method is convienent if a lot of data is to be entered at one time. After filling in the spreadsheet it may be uploaded for inclusion in CPT. Whatever method is used to enter channel data it will take time for those data to be incorporated into the CPT database, and consequently, to be reflected in the output of a CPT analysis. br style=clear:both /
Explanation of Preferences
Once the user is done making selections using the drop-down tree, the Preferences tab immediately to the right of the Selection tab should be clicked in order to specify data filtering criteria and other query parameters. Figure 5 shows the Preferences page, and each of the user-specified query parameters is described in the following sections.
br style=clear:both /
Grouping and Filtering Options
CPT allows the user to group output data into several configurations by selecting any combination of the boxes labeled Draft, System, Vessel Type, and Traffic under the Grouping and Filtering Options portion of the Preferences Page (See Figure 6). These selection boxes control which columns are included in the details page (discussed below) tables, and thus how the output for a selected entity is grouped together.
A toggle is also available in the Grouping and Filtering Options portion of the preferences page. This toggle allows the user to select All Data or Data on Current Page Only. This selection also controls the output displayed in the details page tables. These tables can be modified by the user to include the top 10, 20, 50, 100, 250, or 500 rows of output data. By selecting All Data the total row in the table will display the sum of all data whether it is included in the table or not. Selecting Data on Current Page Only the total row will be a sum of only the data currently displayed in the table.
br style=clear:both /
Limiting Depths and Drafts
The limiting depth used in CPT for each channel can either be uploaded by authorized users or set to a default value. Uploaded values will be entered by district personnel who presumably have access to the latest channel surveys. The default value is indirectly calculated for each year based on the deepest transiting vessel calls in the Waterborne Commerce database found to have utilized a given channel. The assumption made is that commercial shipping would utilize the deeper depths if they were in fact available. The user can specify which of these values to use by clicking Use Default Limiting Depths or Use Uploaded Limiting Depths in the Limiting Depths and Drafts portion of the preferences page.
Included in the Limiting Depths and Drafts section of the preferences page is the ability for the user to select the range of vessel drafts to display in the output of an analysis. By selecting the All Drafts box all vessels with their associated draft will be included in the analysis. By deselecting the All Drafts box the user will then be required to enter the range of drafts to include in the analysis. This option is helpful when researching just the deep draft channels within a system.
Shoaling
Just as with limiting depths authorized users may upload actual channel shoaling rates to include in CPT analysis. The user may include these uploaded values in their query by selecting Use Uploaded Shoaling Rates in the Shoaling section of the preferences page. On the other hand, the user may choose to apply a default shoaling rate uniformly across all selected sub-reaches by selecting Use Default Shoaling and entering an integer value in the Default Anticipated Shoaling box. The integer entered represents the feet of shoaling that will be applied to all selected sub-reaches (See Figure 7).
Taking the effects of shoaling into account the user may focus on the commercial shipping utilizing just the deepest portions of maintained channels, i.e. those depths most vulnerable to shoaling during a given budget cycle, and also those depths most dependent upon USACE maintenance dredging to remain clear for navigation. Alternatively, the user may choose to ignore shoaling conditions altogether, in which case all tonnage (or $-value) transiting at all depths will be used as the scoring metric when ranking chosen entities.
Years of coverage
CPT presently offers coverage of waterborne commerce movements starting in 2003 up until 2008. Figure 7 shows the section of the Preferences page below the Shoaling section wherein years of coverage are specified. The box indicating All Years of available data is checked as the default setting. If multiple years are selected for the query CPT's default setting is to display output as the total for all selected years; however, if the user selects the Details By Year box, output will be displayed for each of the selected years separately.
It should be noted that prior to 2005, draft information was not recorded for foreign vessels; therefore those vessels are assigned a draft of zero for years 2003 and 2004. br style=clear:both /
Commodity selection
The Waterborne Commerce database classifies cargo into 662 separate commodity listings. CPT allows the user to choose any subset of these codes for inclusion in the analysis. Figure 8 shows the Commodities section in the Preferences page where the user may make commodity related selections. The user may simply choose to include all commodities (as indicated in Fig. 8), or select individual commodity listings from the nested drop down tree. The level of commodity detail displayed by CPT may be altered by selecting the 1-Digit, 2-Digit, 4-Digit or 5-Digit toggle. The default level of commodity detail is 2-Digit, as shown in the figure. The 5-Digit level is the most detailed, whereas the 1-Digit level groups commodities into a few general categories. By entering an integer into the Top n commodities to display in charts box the user is able to regulate the number of commodities included in the color coded draft profile charts.
An additional toggle is available within the Commodities section. Within a given channel or project, waterborne commerce may load and unload at docks, piers, and berthing terminals, while other traffic may simply transit the channel without stopping while on its way to some other destination. In both instances, the channel in question supports those shipments in the course of their voyage; however the CPT user may wish to see one or the other for the purposed of their analysis. The two options available in CPT include “Transit” (selected in Fig. 8) and “Docked.” In this version of CPT, the “Transit” option actually considers both tonnage that docks within a reach and also through tonnage that transits without stopping. The “Docked” option counts just the tonnage that actually docks within a given reach. Subsequent versions of CPT will include a third toggle that isolates through tonnage from docked tonnage. br style=clear:both /
Traffic Type and Vessel Type
CPT provides the option of considering just particular traffic types (i.e. imports, exports, coastwise domestic, etc.) when comparing selections. These traffic types are listed in the Traffic Type section of the Preferences page, as seen in Figure 9; the user has selected only Overseas-Imports and Canadian-Imports for consideration. Foreign traffic types included in CPT are: Overseas - Imports and Exports, Canadian - Imports and Exports, and Intransit - Imports and Exports. Intransit - Imports and Exports are shipments from a foreign country to the United States, which are then shipped to another foreign country without being entered as imports.
Domestic traffic types available include Coastwise, Lakewise, Internal, Local, Intra - Territory, and Ferry movements. Coastwise traffic are domestic movements that transit an ocean or the Gulf of Mexico. Lakewise traffic refers to waterborne traffic between U.S. ports on the Great Lakes System. Internal movements are those occurring completely within the inland river system. Local (also known as Intraport) traffic are movements within the confines of a port. Intra - Territory traffic refers to movements between ports in Puerto Rico and the Virgin Islands.
Filtering by vessel type is another option available to CPT users. Figure 9 shows the Vessel Types portion of the preferences page under the Traffic portion of the page. The user may select all vessel types as shown in Figure 9 or select any subset of the available vessel types to include in the analysis. Vessel types available for selection are: Rafted Logs, Self-Propelled Dry, Tanker, Towboat, Dry Cargo Barge, Liquid Barge, and Other.
br style=clear:both /
Container Types, Directions, and Systems
The last three data filters available in CPT are the Container Types section, the Directions section, and the Systems section. These sections are shown in Figure 10. The Container Types section allows the user to analyze only containerized cargo, only non-containerized cargo, or all shipments.
By default the Directions and the Systems sections are set to 'All Directions' and 'All Systems' respectively. Under the Directions section 'Upbound' refers to shipments traveling in an upstream direction. In case the upstream direction cannot be determined 'Upbound' is taken as a northerly or easterly direction. Similarly, 'Downbound' means shipments travel downstream, or a southerly or westerly direction.
Within the Systems dropdown box the user may select any combination of Inbound, Outbound, Intrasystem, Through, or Indeterminate. 'Inbound' indicates traffic moving from one waterway onto the subject waterway, which is also its destination. 'Outbound' is traffic leaving the subject waterway, its origin, for another waterway. Traffic that transits a stretch of waterway and whose origin and destination are both outside the stretch of waterway is classified as 'Through.' Traffic that is not classified in any of the other categories of the Systems drop down box is classified as 'Indeterminate.'
Google Earth .kml settings
CPT allows for exporting of .kml files for viewing in Google Earth to help convey the relative significance of sub-reaches and deep-water waterway network links in terms of the tons and/or $-value of cargo utilizing those entities. Results from both Rankings queries and Flow queries can be exported for viewing in Google Earth.
Two methods are available for displaying CPT reaches and network links within Google Earth: 1) the “Polygon” option allows the user to define an upper and lower bound for the width of the overlays, and 2) the “Line” option uses simple lines between 1 and 10 pixels wide to represent channels and network links. Due to the way in which each option is rendered within the Google Earth viewing environment, it is recommended that the Polygon option be selected when comparing reaches within a single Project-sized area (e.g. Baltimore Harbor or the Galveston Bay area), while the Line option works better when wanting to see regional comparisons of channel significance (i.e. commodity flows along the East coast or a comparison of reaches in multiple harbors).
Additionally the user may choose between scaling the CPT output by thickness, as discussed above, by color, or by a combination of the two. The color coding within CPT assigns the darkest red to those network links with the most tonnage or the highest commodity $-value. Those with the least amount of tonnage/$-value are assigned blue. Other links that have intermediate tonnage/$-values are scaled on the color spectrum between red and blue.
Figure 11 shows the KML Settings section of the Preferences page. In the example shown, the Polygon option is selected, with a minimum width of 528 ft and a maximum width of 5280 ft. Note that if the Line option were selected, the width values would need to be specified in terms of screen pixels, with a minimum and maximum of 1 and 10 pixels, respectively.
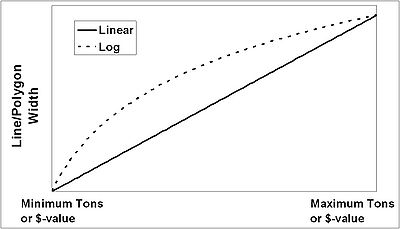
The Log/Linear toggle shown in Figure 11 determines the manner in which the width of each reach is scaled for display. Recall that the width of each reach overlay is determined by the tons or $-value utilizing the respective reach. The simplest way to convey this is to have a linear scale, with the highest-tonnage reach having the maximum specified width, and all subsequent reach widths scaled accordingly down to the reach with the fewest tons or $-value. However, often times the tonnage or $-value utilizing the selected reaches will vary by orders of magnitude, so the linear scaling can result in a less-than-ideal visual conveyance of the relative significance of each reach. To address this issue, CPT provides a Log scaling option, which uses a more gradual reduction in line width as the underlying tonnage or $-value decreases. Figure 12 gives a general idea of the differences between Linear and Log width scaling.

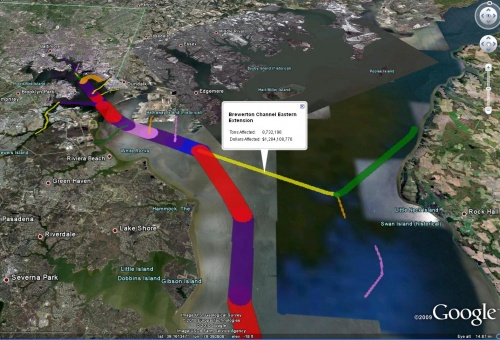
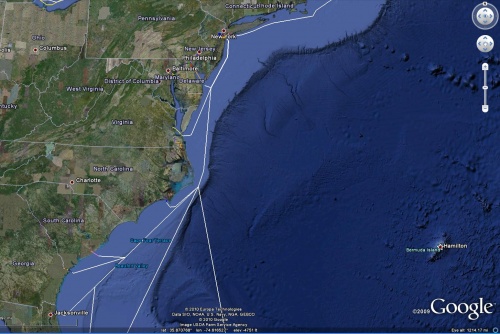
br style=clear:both / Figures 13 and 14 show the Polygon and Line overlay options, respectively. In each case, the clicking on the reach overlays shows the underlying tons and $-value.


br style=clear:both /
Saving Preferences
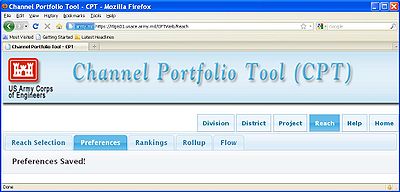
Once all filter criteria have been specified using the Preferences page, the Save Preferences button (Fig. 6, bottom of page) must be pressed before the query can be executed. Figure 10 shows the resulting screen, giving confirmation that the Preferences have been recorded and that the various analyses can now be performed.

br style=clear:both /
Viewing of Rankings, Roll-ups, and Flow tables
Once Preferences have been saved, the CPT user may select one of the three tabs shown to the left of the Preferences tab in Figure 10. The remainder of this page will give step-by-step instructions on how to use the Rankings, Rollup, and Flow features of CPT for analysis.