Planar Beach
Test C2-Ex3: Planar sloping beach with oblique incident regular waves
Purpose
The CMS is applied to a laboratory experiment of wave-induced currents and water levels due to regular waves. The large cross-shore gradient of wave height in the surf zone produces a large forcing useful for testing hydrodynamic model stability and performance under strong wave forcing. The specific CMS-Flow features tested are the surface roller, cross-shore boundary conditions, and combined wave-current bottom shear stress parameterization.
Experiment
In 1991, Visser conducted eight laboratory experiments of monochromatic waves on a planar beach and collected measurements on waves, currents and water levels. In this report, experiments (Cases) 4 and 7 are selected as representative test cases. The bathymetry consisted of a 1:10 slope for the first 1 m from shore, a 1:20 slope for the next 5 m, followed by 5.9-m flat bottom to the wave generator. Cases 4 and 7 had an incident wave height of 0.078 m, peak period of 1.02 s and incident wave angle of 15.4°. Case 4 was run over a concrete bed and Case 7 was run over a thin 0.005-0.01 m layer of gravel grouted onto the concrete floor. A summary of the wave conditions is provided in Table 21.
| Parameter | Value |
|---|---|
| Wave height (regular) | 0.078 m |
| Wave period | 1.02 s |
| Incident wave angle | 15.4º |
Model Setup
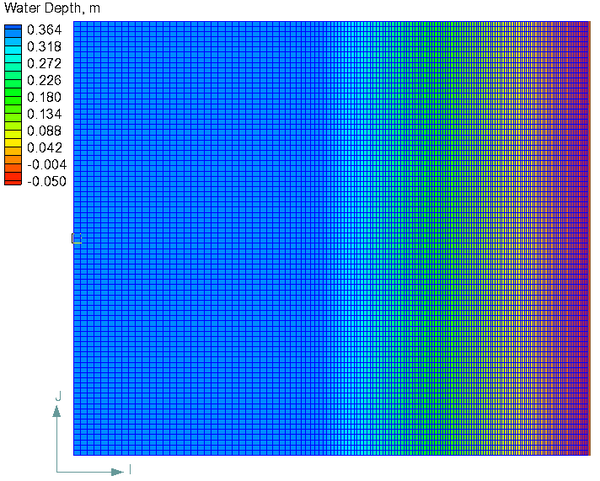
The computational grid (Figure 22) consists of 84 rows and 147 columns with a constant grid resolution in the longshore direction of 0.15 m and a variable grid resolution between 0.04 and 0.15 m in the cross-shore direction. A constant zero water level was forced at the offshore boundary and cross-shore boundaries were applied on each side of the shoreline. The boundary type solves the 1-D cross-shore momentum equations for the longshore current and water level and applies a flux boundary condition for inflow conditions and a water level condition for outflow conditions. The combined wave-current bottom shear stress model of Fredsoe (1984) is used. The cases were simulated as steady-state solutions with pseudo-time stepping to reach steady-state while coupling waves, currents and water levels. The initial condition was specified as zero current velocity and water level for the whole domain. Waves and hydrodynamics were coupled every 20 min (steering interval) and run until steady-state. The surface roller model (Stive and De Vriend 1994)was run after each CMS-Wave run and the roller surface stresses were then added to the wave radiation stresses before running CMS-Flow. A summary of the important simulation settings for CMS-Flow and CMS-Wave is given in Tables 22 and 23 respectively. The experiments was simulated in laboratory scale, which is why some of the parameters like the wetting/drying depth were decreased.

| Parameter | Value |
|---|---|
| Solution scheme | Implicit |
| Time step | 1 min |
| Wetting/drying depth | 0.006 m |
| Simulation duration | 3 hr |
| Ramp duration | 2 hr |
| Wave-current bottom friction | Fredsoe (1984) |
| Parameter | Value |
|---|---|
| Wave breaking formulation | Battjes and Janssen (1981) |
| Bottom friction | Off (default) |
| Steering interval | 20 min |
All of the wave breaking formulations in CMS-Wave are designed for random waves. However the Visser (1991) laboratory experiments were run with regular (monochromatic) waves which are not useful for validating the CMS-Wave. Since the objective of this test case was to assess the performance of the hydrodynamics, it was necessary to calibrate the waves to obtain the most accurate wave results in order to analyze the performance of the hydrodynamic model by itself and not have the analysis impacted by the results from an inadequately calibrated wave model. The calibration procedure consisted of first calibrating the location of the breaker using the breaker index γ. The flow was then calibrated using the Manning's coefficient and roller efficiency coefficient (Stive and De Vriend 1994). Additional tests were run for comparison with the same settings except the roller model was turned off.
| Parameter | Case 4 | Case 7 | Default |
|---|---|---|---|
| Manning’s coefficient,s/m1/3 (flow only) | 0.0115 | 0.018 | None |
| Breaker coefficient | 0.64 | 0.9 | Automatic(random waves) |
| Roller dissipation coefficient | 0.1 | 0.1 | 0.1 |
| Roller efficiency factor | 0.8 | 0.8 | 1.0 |
Results and Discussion
Case 4
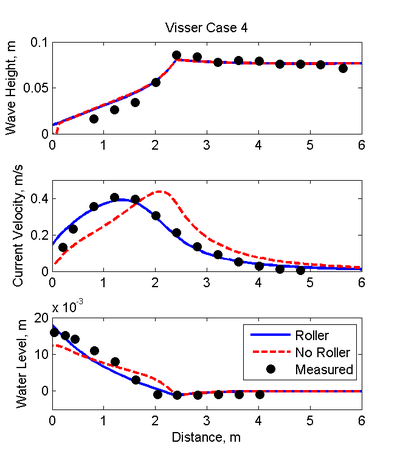
The measured and computed wave heights, longshore currents, and water levels for Case 4 are compared in Figure 23. Results are shown with and without the surface roller. The results are significantly improved when the surface roller is included as demonstrated by the goodness-of-fit statistics shown in Table 25. The NMAE for longshore current was reduced from approximately 20 to 5%. The roller has the effect of spreading the peak longshore current and moving it closer to the shore. The surface roller also reduces the setup at the breaker and increases it in the surf zone and near the shoreline. Although the water levels and currents are significantly affected by the surface roller the wave height profile shows only minor differences when the roller is included. This is due to the fact that in this case the dominant wave process in the surf zone is the wave breaking and the current-wave interaction is relatively weak in the wave model.
 Figure 23. Measured and calculated wave height (top), longshore
current (middle), and water level (bottom) for Visser (1991) Case 4.
| NRMSE, % | NMAE,% | R2 | Bias | ||
|---|---|---|---|---|---|
| No Roller | Wave height | 7.10 | 5.35 | 0.985 | 0.002 m |
| Longshore current | 22.59 | 19.91 | 0.609 | 0.018 m/s | |
| Water level | 13.95 | 11.66 | 0.954 | 0.000 m | |
| Roller | Wave height | 6.70 | 5.11 | 0.985 | 0.002 m |
| Longshore current | 7.14 | 5.11 | 0.962 | 0.007 m/s | |
| Water level | 9.04 | 7.38 | 0.957 | 0.000 m |
Case 7
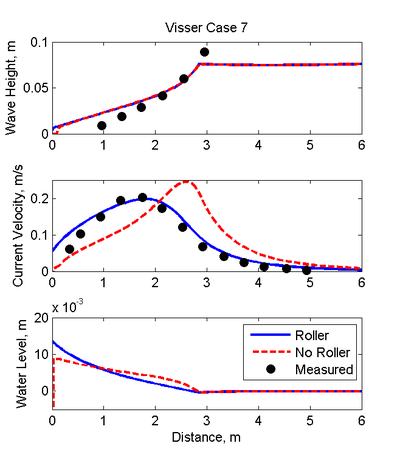
The measured and computed wave heights, longshore currents, and water levels with and without the roller for Case 7 are shown in Figure 24. It is interesting to note that although the offshore wave height, period and direction are the same as Case 4, the location of the breaker for Case 7 is significantly further offshore. It is suspected that Case 7 actually had a larger wave height than Case 4 which produced a larger breaker further offshore. However, because no measurements were available further offshore of the breaker, no changes were made to the incident wave height. The results are similar to those of Case 4 in that the longshore current velocities are significantly improved when the roller is included (see Table 26). No measurements of water levels were available for Case 7. Similarly to Case 4 the longshore current is well predicted when the roller is included except for the first 1 m from the shoreline where the current velocity is overpredicted.
 Figure 24. Measured and computed longshore currents (top), water
levels (middle) and wave heights (bottom) for Visser (1991) Case 7.
| !Roller | Variable | NRMSE, % | NMAE, % | Bias | |
|---|---|---|---|---|---|
| Off | Wave height | 7.10 | 5.35 | 0.985 | 0.002 m |
| Longshore current | 22.59 | 19.91 | 0.609 | 0.018 m/s | |
| Water level | 13.95 | 11.66 | 0.954 | 0.000 m | |
| On | Wave height | 6.70 | 5.11 | 0.985 | 0.002 m |
| Longshore current | 7.14 | 5.11 | 0.962 | 0.007 m/s | |
| Water level | 9.04 | 7.38 | 0.957 | 0.000 m |
Conclusions and Recommendations
Wave-induced currents and water levels were simulated with the CMS for the case of monochromatic waves over a planar bathymetry. Results were calculated with and without the surface roller and the best results were obtained with the roller turned on, using a roller dissipation coefficient of 0.1 and a roller efficiency factor of 0.8. Both currents and water levels were predicted with errors less than 10%. Additional tests will be conducted in the future to show model sensitivity to the calibration parameters and to better determine these parameters based on field conditions. The wave calibration and results shown here are related to regular waves and are not directly applicable to field conditions. However, the purpose of these tests was to test the performance of the hydrodynamic model as quantified by the comparison between measured and simulated longshore current velocities and water levels under strong wave forcing.