User Guide 011
Notes:
- • The size classes are constant for the whole domain.
- • The fraction of each sediment size class in the bed describes the bed composition.
- • Increasing the number of sediment size classes increases the com-putational time because each size class requires its own governing equations.
- • If not size classes are specified, then a single transport grain size is used based on the mean of the median grain size diameter for the surface bed layer
.
Recommendations:
- • It is NOT recommended to use more 8-9 sediment size classes, be-cause of the increased computational time. For most cases, 3-5 sediment size classes are sufficient.
- • A good and simple way of estimating the grain size classed based only on the size limits of the distribution is by distributing the diameters logarithmically:
| (2-22) |
where N is the number of sediment size classes, k indicates the sediment size class, and the subscript indicates the size class num-ber. This leads diameters more closely spaced in the finer grain sizes and more loosely spaced in the coarser grain sizes. Since the sediment transport is larger for the finer grain sizes, it makes sense to give more resolution near the finer grain sizes.
- • The size class diameter should be chosen carefully so that encom-pass the whole range of sediment sizes found in the bed.
A Matlab example how to select the sediment size classes based on a median grain size and geometric standard deviation is given in Appendix E.
Fall Velocity
The user may select one of several sediment size class fall velocity formulas to calculate the fall velocity. It is noted that the fall velocity should not be used as a calibration parameter. There are three options for the sediment fall velocity:
- 1. User-specified
- 2. Soulsby (1997)
- 3. Wu and Wang (2006)
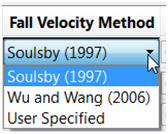
The options for the sediment fall velocity can be selected with within the Size Class section within the Sediment tab of the CMS-Flow Model Control window (see figure below).
Figure 2-84. Sediment size class Fall Velocity Method options in the Size Class section within the Sediment tab of the CMS-Flow Model Control window in SMS 11.1.
The cards used to specify the sediment fall velocity are described in the table below.
table 2-74
The Soulsby (1997) formula is given by
| (2-23) |
where d* is the dimensionless grain size
| (2-24) |
where d50 is the median grain size, s is the sediment specific gravity, g is the gravitational constant, is the kinematic viscosity.
The Wu and Wang (2006) formula includes the effect of the sediment shape through and is given by
| (2-25) |
where M = 53.5 exp(-0.65FS) , N = 5.65 exp(-2.5FS) , n = 0.7 + 0.9FS. Here FS is the Corey shape factor defined as in which ds ,dI , and dL are the diameters of the short, intermediate and long mutually perpendicular axes. Naturally worn quartz sands have a typical Corey shape factor of 0.7 and calcareous sand of about 0.55.
Notes:
- • For noncohesive sediments, it is NOT recommended to use the sediment fall velocity, or shape factor as calibration parameters. These parameters should be estimated using field or literature data. If not measurements are available then the default formula should be used.
- • For high sediment concentrations, the sediment fall velocity can be reduced. However, because the effects are important for high concentrations, the effect can usually be ignored.
- • Decreasing the shape factor decreases the sediment fall velocity.
Critical Shear Stress
When using the Lund-CIRP or Watanabe transport formula, the option is given to modify the critical shear stress for incipient motion. In the case of the Soulsby-van Rijn, and van Rijn transport formula, the depth-averaged critical velocities are used and cannot be modified by the user. Therefore this section is only applicable to the Lund-CIRP and Watanabe transport formula. There are three options for the critical shear stress for incipient motion:
- 4. User-Specified
- 5. Soulsby (1997)
- 6. Wu and Wang (1999)
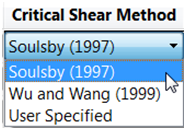
The options for the sediment size class critical shear stress can be selected with within the Size Class section within the Sediment tab of the CMS-Flow Model Control window (see figure below).
Figure 2-85. Sediment size class Critical Shear Method options in the Size Class section within the Sediment tab of the CMS-Flow Model Control window in SMS 11.1.
The cards used to specify the sediment size class critical shear stress are described in the table below.
table 2-75
The critical shear stress, , is related to the Shields parameter, , by
| (2-26) |
Soulsby (1997) proposed the following formula for the Shields parameter
| (2-27) |
The formula by Wu and Wang (1999) is given by
| (2-28) |
=Notes:
- • For noncohesive sediments, it is NOT recommended to use the sediment fall velocity, or shape factor as calibration parameters. These parameters should be estimated using field or literature data. If not measurements are available then the default formula should be used.
Examples
In the example below a single sediment size is specified. Since there is only one sediment size class, the bed sorting and gradation is not considered.
example 2-72
In the following example three sediment size classes are considered which allows the model to track the bed composition. It is noted that not the same input parameters have to be specified for all sediment size classes. Any parameters which are not specified are set the default value.
example 2-73
Transport Model
There are currently three sediment transport models available in CMS: (1) Equilibrium total load, (2) Equilibrium bed load plus advection-diffusion for suspended load, and (3) Non-equilibrium total load. The first two models are selected by unchecking the checkbox which says "Use non-equilibrium transport" and selecting either "Total load" for the first model, or "Advection-diffusion" for the second next to input item named "Formulation". The third model is selected by checking the box "Use non-equilibrium transport".
Table 2-76 gives a description, default value, and range for the sediment transport models.
table 2-76
example 2-74
Notes:
- • When selecting the equilibrium total load model, the SED_TRAN_FORMULATION card is set to either WATANABE or LUND_CIRP depending on the transport formula chosen. When se-lecting the equilibrium A-D model, the transport formula is speci-fied through the concentration profile formula (described below).
- • All three sediment transport models are available with the explicit solver, while only the NET is available only with the implicit time stepping scheme.
- • Only the Nonequilibrium Total Load model is available in CMS versions 4.0 and greater at the moment. Plans are under way to in-clude the Equilibrium Bed plus Advection-Diffusion Suspended Load model as an option, but the Equilibrium Total Load model will likely be discontinued.
A description of each sediment transport model is described in the sections below.
Equilibrium Total load
In this model, both the bed load and suspended load are assumed to be in equilibrium. The bed change is solved using a simple mass balance equation known as the Exner equation.
Equilibrium Bed load plus Advection-Diffusion Suspended Load
Calculations of suspended load and bed load are conducted separately. The bed load is assumed to be in equilibrium and is included in the bed change equation while the suspended load is solved through the solution of an advection-diffusion equation. Actually the advection diffusion equation is a non-equilibrium formulation, but because the bed load is assumed to be in equilibrium, this model is referred to the "Equilibrium A-D" model.
Nonequilibrium Total Load
In this approach, neither the bed nor suspended loads are assumed to be in equilibrium. The suspended- and bed-load transport equations are combined into a single equation and thus there is one less empirical parameter to estimate (adaptation length).
Sediment Transport Formula
The near bed sediment concentration or concentration capacity are calcu-lated with one of the following transport formula:
- • Lund-CIRP (2006)
- • Van Rijn (1998)
- • Watanabe (1987)
- • Soulsby-van Rijn (1997) (>=V4.0)
Table 2-77 gives a description, default value, and range for the sediment transport formulae.
table 2-77
example 2-75
Notes:
- • Different transport formula may produce very different results in morphology change.
- • The Lund-CIRP does well in predicting the surf zone sediment transport but tends to overestimate the transport rates near the wetting and drying limit and in deep water (>10 m).
- • The van Rijn transport formula tends to underestimate the trans-port for conditions near the critical shear stress of motion. The for-mula also tends to underestimate the transport close to the shore-line.
- • The Watanabe formula tends to underestimate the transport in deep water (>10 m).
Recommendations:
- • For every sediment transport project, it is recommended to test several sediment transport formula to observe the sensitivity of the results to the sediment transport formula. The sediment transport formula is perhaps the most important parameter of any sediment transport model and the largest source error.
Scaling Factors
Transport Scaling Factors
The bed- and suspended-load transport scaling factors multiply directly by the transport capacity or near-bed sediment concentration calculated from the transport formula. Error! Reference source not found. gives a description, default value, and range for the bed- and suspended-load scaling factors.
table 2-78
example 2-76
Note:
- • The transport scaling factors should be one of the first parameters used in calibrating a sediment transport model. The scaling factors can be calibrated using measured sediment transport rates or morphology change. In general, larger scaling factors will produce larger bed change.
- • Due to the large uncertainty in the transport formula, it is generally common to use scaling factors in the range of 0.5-2.0. However values between 0.2 and 5.0 are not unreasonable given the uncertainty in the equilibrium sediment transport formula.
- • For simplicity, the same transport scaling factors are applied for the whole solution domain and for all sediment sizes.
Morphologic Acceleration Factor
The morphologic scaling factor is directly multiplied by the calculated bed change at every time step and is intended as a means of speeding up the computational time. It is only recommended for periodic boundary conditions or conditions that do not change rapidly over time. Table 2-79 gives a description, default value, and range for the morphologic acceleration factor.
table 2-79
example 2-77
Note:
- • The morphologic scaling factor is NOT a calibration parameter. It should only be used in cases with periodic forcing and boundary conditions and even then it should be used with caution. It is NOT recommended to use larger values than 20-30.
- • The acceleration factor may be used to turn off the morphology change by setting it to zero.
Schmidt Number
The sediment mixing coefficient is calculated as the eddy viscosity divided by the Schmidt number. For simplicity the Schmidt number is assumed to be constant and the default value is 1.0. Table 2-80 gives a description, default value, and range for the Schmidt number.
table 2-80
The example below demonstrates how the Schmidth number is specified in the CMS-Flow Model Control file.
example 2-78
Note:
- • The Schmidt number should NOT be used as a calibration number and should only be changed in sensitivity analysis or model testing.
Adaptation Coefficient
The adaptation coefficient is an important parameter to consider in setting up the CMS sediment transport model. The sensitivity of results to the adaptation coefficient depends on the spatial and temporal scales of the problem. For example, if a high resolution grid is used to model short-term dynamics of a nearshore disposal site or a small inlet, then the adaptation coefficient is likely to be important. However, if a relatively coarse grid is used to study sediment pathways in a large estuary entrance, then the adaptation coefficient will not be important.
Total Load
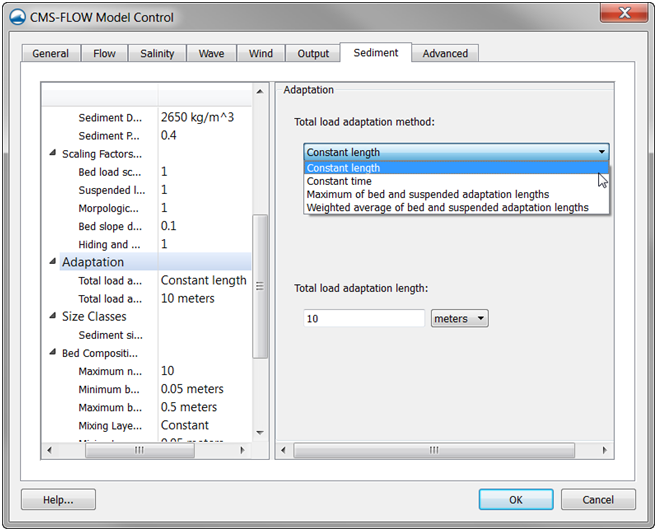
There are four methods for calculating the total load adaptation coefficient in CMS:
- 1. Constant length
- 2. Constant time
- 3. Maximum of bed and suspended load lengths
- 4. Weighted average of bed and suspended load lengths
Figure 2-86. Adaptation section within the Sediment tab of the CMS-Flow Model Control window in SMS 11.1
Constant Length
A temporally and spatially total load adaptation length is used for the whole domain. The total load adaptation coefficient is calculated as
| (2-29) |
where is the sediment fall velocity of the transport grain size, for single size sediment transport, or the median grain size, in the case of multiple-sized sediment transport.
Constant Time
A temporally and spatially constant total-load adaptation time is used for the whole domain. The total load adaptation coefficient is calculated as
| (2-30) |
where is the sediment fall velocity of the transport grain size for single size sediment transport, or the median grain size, in the case of multiple-sized sediment transport.
Maximum of Bed and Suspended Load Lengths
A temporally and spatially constant total-load adaptation time is used for
| ( 2-31) |
where ls is the suspended load adaptation length and Lb is the bed load adaptation length. The methods for determining Lb and Ls are described in subsequent sections.
Weighted Average of Bed and Suspended Load Lengths
A temporally and spatially constant total-load adaptation time is used
| (2-32) |
where Ls is the suspended load adaptation length, Lb is the bed load adaptation length, and rs is the fraction of suspended load of the total load.
The methods for determining Lb and Ls are described in subsequent sections.
The CMS cards related to the total load adaptation coefficient are de-scribed in the table below.
table 2-81
Note:
- • If the total-load adaptation length is set to -1.0, then the maximum of the bed- and suspended-load adaptation lengths is used. This is the input format used by SMS.
Recommendations:
- • When first setting up a sediment transport model, it is recom-mended to use a spatially constant total load adaptation length for simplicity.
- • If the user is not sure of the sensitivity of the results to the adapta-tion length for the specific project, then it is recommended to test different total load adaptation lengths; for example 5, 10, and 50 meters. This will provide an insight into the sensitivity of the results to the adaptation length. In many cases, the results are not found to be sensitive and the default value of 10 m can be used. If the results are found to be more tests are necessary in determining to optimal method and parameters for calculating the adaptation length.
- • WGHT_AVG_BED_SUSP_LENGTH is the most physically accurate method for determining the total load adaptation length. However, it can lead to relatively small adaptation lengths which cause insta-bilities, especially for large computational time steps. If this occurs then it is recommended to use M AX_BED_SUSP_LENGTH.
Bed Load
The bed load adaptation parameters only need to be specified if the total-load adaption coefficient is set as a function of the bed load adaptation length. The CMS cards related to the bed load adaptation length are de-scribed in the table below.
table 2-82
Note:
- • If the total-load adaptation length is set to a negative number, then the value is interpreted as being the bed-load adaptation length depth factor. The bed-load adaptation length is therefore calculated as the depth times the positive depth factor.
Recommendations:
- • Based on experience, it is recommended to use a constant bed load length of at least one to three times the grid resolution.
Suspended Load
The suspended load adaptation parameters only need to be specified if the total load adaption coefficient is set as a function of the suspended-load adaptation length. The CMS cards related to the suspended-load adaptation coefficient are described in the table below.
table 2-83
Notes:
- • By default, SMS writes the CMS-Flow card ADAPTATION_COEFF_SUSPENDED . However, this card is outdated and can be confused with the card ADAPTATION_COEFFICIENT_SUSPENDED (see table above). In-stead, it is recommended for the user to use the ADAPTATION_METHOD_SUSPENDED to specify the method for the suspended-load adaptation coefficient.
Examples
The first example shown below demonstrates the simplest method for specifying the total load adaptation length which is with a constant value. It is noted that if the card ADAPTATION_LENGTH_TOTAL is specified, then the total load adaptation method is automatically set to a constant length. The way this option is specified in the SMS 11.1 interface is shown in Figure 2-86.
example 2-79
The following example uses a more complicated formulation for calculat-ing the total load adaptation method. The total load adaptation length is calculated as the weighted average of the bed and suspended loads. The average weights for the bed and suspended loads are given by the fraction of each load relative to the total load. The bed load adaptation length is calculated as a function of the water depth (Lb = 7h) while the suspended load adaptation length is calculated using the formulation of Armanini and di Silvio (1986). The figure below shows how to setup the adaptation parameters in the SMS 11.1 interface for this example.
![{\displaystyle d_{k}=exp\left[ln\ d_{1}+ln(d_{N}/d_{1}){\frac {k-1}{N-1}}\right]}](https://en.wikipedia.org/api/rest_v1/media/math/render/svg/4baa93e3e69858bc5978b1a9a7fe2bc995b31980)

![{\displaystyle \omega _{s}={\frac {v}{d}}\left[(10.36^{2}+1.049d_{*}^{3})^{1/2}\right]}](https://en.wikipedia.org/api/rest_v1/media/math/render/svg/8f9f8060ab5acb0aabd8cd5f858cc2639f596b49)
![{\displaystyle d_{*}=d_{50}\left[{\frac {(s-1)g}{\nu ^{2}}}\right]^{1/3}}](https://en.wikipedia.org/api/rest_v1/media/math/render/svg/c36e890db21fe759a286a90a8191d3b227b33bca)

![{\displaystyle \omega _{s}={\frac {M_{\nu }}{N_{d}}}\left[{\sqrt {{\frac {1}{4}}\left({\frac {4N}{3M^{2}}}d_{*}^{3}\right)^{1/n}}}-{\frac {1}{2}}\right]^{n}}](https://en.wikipedia.org/api/rest_v1/media/math/render/svg/c3dc1fe159a428e5af2fd8090dd153dd130945ba)


![{\displaystyle \Theta _{cr}={\frac {0.3}{1+1.2d_{*}}}+0.55[1-exp(-0.22d_{*})]}](https://en.wikipedia.org/api/rest_v1/media/math/render/svg/e3bc7a992fec8c735c3d4a3e8cad02b3f0bfc3d3)


