CMS Dredge Module - Phase 1
Dredge Area Setup
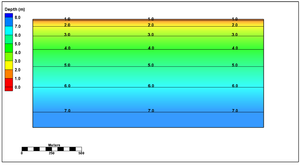
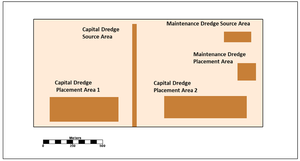
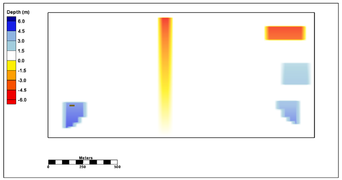
The first dredge area, "CapitolDredge" consists of a dredge source area aligned to represent a navigation channel (north-south alignment). The dredge depth was set to 7.5 meters, which created a total dredge volume of approximately 153,000 m3. The dredge rate was set to 5000 m3/day, which yielded a total time of 30 days to complete dredging. Two placement areas were defined; both near the southern edge of the grid domain, one to each side of the channel.
The second dredge area, "MaintDredge" consisted of a dredge area in the northeast corner of the grid domain and resembles a sediment impoundment basin. The dredge depth was set to 8 meters yielding a dredge volume of 130,000 m3. The dredging rate was set to 6000 m3/day, yielding a dredge time of 22 days. A single placement area was defined to the south of the dredge source area.
The bathymetry of the simulation grid is shown in Figure 3. The location and extent of the dredge source and placement areas for each scenario are shown in Figure 4.
Test Cases
| Test Number | Description |
|---|---|
| 101 | CapitalDredge: Dredge option 2 (starting location set to north end of dredge source area), Trigger Option 1 with Threshold set to 7 m. Placement option 1 with Limit of 3m. Placement Allocation 100% for #1 and 0 % for #2.
MaintDredge: Dredge option 1 (shallowest), Trigger Option 1 with Threshold set to 7.5 m. Placement option 1 with Limit of 3.5 m. |
| 102 | CapitolDredge: Dredge Approach is changed to method 2 (shallowest cell) |
| 103 | CapitolDredge: Placement Allocation is changed form 100%/0% to 60%/40%. |
| 104 | CapitolDredge: Placement Approach is changed from 1 to 2. The CapitolDredge starting
location is the northwest corner for placement area 1 and is at the northeast corner of placement area 2. The 60%/40% placement allocations used in Test 103 was applied. |
| 105 | CapitolDredge: Placement Areas were reduced to limit capacity and force an excess of
dredge material during the simulation; placement allocation is sequential |
| 106 | CapitolDredge: Placement Areas were reduced to limit capacity and force an excess of
dredge material during the simulation; placement allocation is 80%/20% |
| 108 | CapitolDredge: trigger approach is changed to option 4 |
Test 101
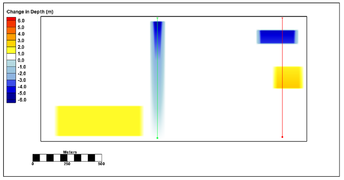
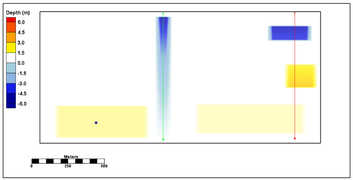
Examples of the simulated dredging activities for Test 101 are shown in Figure 5 through Figure 8. Figure 5 shows the final morphology changes due to the simulated dredging activities. The CapitolDredge navigation channel is apparent, as is the placement in Area 1. The capacity of Placement Area 1 was not exceeded, so the second area was not used. The changes in morphology for the MaintDredge scenario are also evident in the figure.
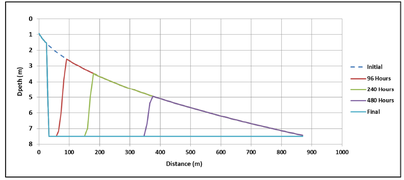
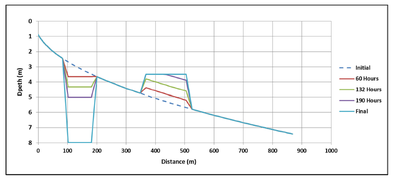
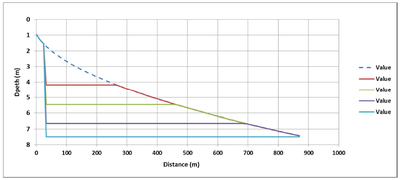
Figure 6 shows the morphological evolution for the CapitolDredge scenario along a transect aligned with the navigation channel. The dredging begins at the specified starting location at the north end of the channel and proceeds southward. The evolution for the MaintDredge scenario is shown in Figure 7 along a north-south transect passing through both the dredge source and placement areas. The dredging for the source area starts at the northern end, which is the shallowest, but quickly proceeds uniformly over the dredge source area as all cells obtain an equal depth. The placement of the material builds up uniformly over the placement area until the specified placement depth limit (3.5 m) is reached in the shallower portion of the profile. At this time, more material is placed in the deeper areas.
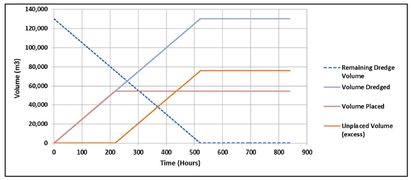
A time series of the dredge volume for the MaintDredge Scenario is provided in Figure 8. The dredge volume starts at 130,000m3 and steadily decreases during the dredging activity at 6000 m3/day and is completed at approximately 22 days (528 hours). The dredge volume placed in the MaintDredge placement area increases steadily up to 220 hours at which time the placement area capacity of 54,000 m3 is reached. The placement area capacity is controlled by the specified placement depth limit of 3.5m for this scenario. At 200 hours, the remaining dredge volume is assumed to be placed outside of the CMS grid domain and is tracked as the Unplaced Volume (excess).
-
Figure 5. Final Morphology Changes for Test 101.
-
Figure 6. Dredge Profile Evolution for Test 101, CapitolDredge Scenario.
-
Figure 7. Dredge Profile Evolution for Test 101, MaintDredge Scenario.
-
Figure 8. Dredge Source and Placement Area volume evolution for Test 101, MaintDredge Scenario.
Test 102
Sample results from Test 102 are shown in Figures 9 and 10. In this test case, the dredge option for the CapitolDredge scenario was changed to number 1, which causes the dredging to start at the shallowest cell. The dredge profile evolution along the navigation channel is shown in Figure 9. The dredging starts at the northern shallowest end of the source area, and progress downward, extending further offshore as the depth increases. This profile contrasts the profile obtained with dredge option 2, shown in Figure 6.
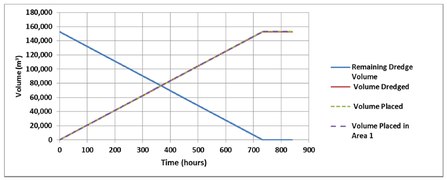
A time series of the dredge volume for the CapitolDredge Scenario is provided in Figure 10. The dredge volume starts at 153,000 m3 and steadily decreases during the dredging activity at the rate of 5000 m3/day. Dredging is completed at approximately 30 days (720 hours). The dredge volume placed in the CapitolDredge placement area increases steadily at the same rate until the dredging is completed. No excess volume is recorded since the placement area capacity is sufficient.
-
Figure 9. Dredge Profile Evolution for Test 102, CapitolDredge Scenario (transect is shown in Figure 5).
-
Figure 10. Dredge Source and Placement Area volume evolution for Test 102, CapitolDredge Scenario.
Test 103
Sample results from Test Simulation 103 are shown in Figure 11 and Figure 12. In this test case, the placement allocation between the two placement areas was changed from 100% and 0% to 60% and 40%. Figure 5 shows the final morphology changes due to the simulated dredging activities. The dredge material form the CaptiolDredge source area is distributed over both placement areas. These results are in contrast to the results obtained with the 100%/0% split shown in Figure 5.
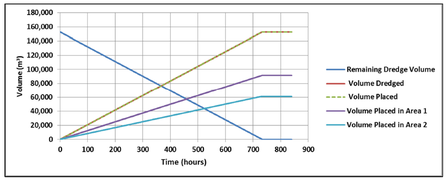
A time series of the dredge volume for the CapitolDredge Scenario is provided in Figure 12. As in test Simulation 102, the dredge volume starts at 153,000m3 and steadily decreases during the dredging activity and the total dredge volume placed in the CapitolDredge placement area increases steadily at the same rate. Additionally the volumes placed in areas 1 and 2 are proportioned by the specified allocation of 60% and 40%, yielding a final volume of 91,000 m3 in area 1 and 62,000 m3 in area 2.
-
Figure 11. Final Morphology Changes for Test 103.
-
Figure 12. Dredge Source and Placement Area volume evolution for Test 103, CapitolDredge Scenario.
Test 104
In Test Simulation 104, the dredge placement approach for the CapitolDredge scenario was changed from option 1 to option 2, which places material in the cells closest to the designated starting point first. The starting location is the northwest corner for placement area 1 and is at the northeast corner of placement area 2. The final morphology changes are shown in Figure 13. The placement areas are filled according to the specified allocation of 60% and 40%, but the filling starts at the cells closest to the designated starting locations, and are filled to the specified placement limit of 3 meters for area 1 and 3.5 meters for area 2.
-
Figure 13. Final Morphology Changes for Test 104.
Tests 105 and 106
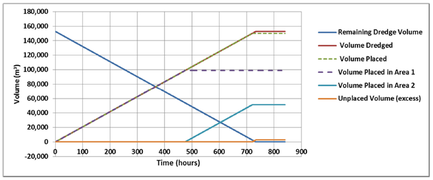
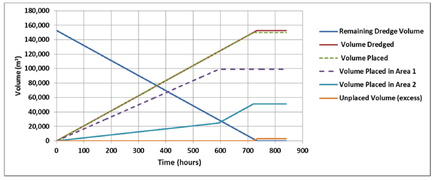
In Tests 105 and 106, the dredge placement approach for the CapitolDredge scenario is reduced to limit capacity and force an excess of dredge material during the simulation. For Test 105, the placement allocation is sequential and for Test 106 the placement allocation is 80%/20%. The time series of dredge and placed volumes is shown in Figure 14 for Test 105 and in Figure 15 for Test 106.
The primary differences in the results are in the placed volume time series for the two cases. For Test 105, the first placement area is filled at a constant rate until it reaches its capacity at about 490 hours (approximately 98,000 m3), at which time the dredge material is placed in placement area 2. When the placement area 2 capacity is reached at about 730 hours (approximately 51,000 m3), the remaining dredged material is assumed to be placed in an area off of the CMS grid domain and that volume is recorded (this amount is approximately 3,000 m3).
For Test 106, both placement areas are filled steadily according to the specified ratio of 80%/20%. When the first placement area reaches capacity at about 600 hours, the total dredge volume is placed into placement area 2 and therefore the filling rate of placement area 2 increases. When the capacity of placement area 2 is reached at about 720 hours, the remaining dredged is assumed to be placed in an area off of the CMS grid domain and that volume is recorded.
-
Figure 14. Dredge Source and Placement Area volume evolution for Test 105, CapitolDredge Scenario.
-
Figure 15. Dredge Source and Placement Area volume evolution for Test 106, CapitolDredge Scenario.
Test 108
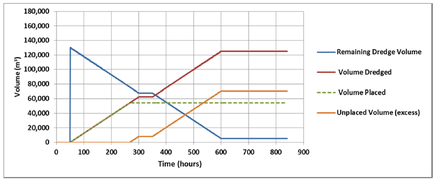
The final example provided is for Test Simulation 108, in which the CapitolDredge and MaintDredge scenarios triggering option was set to number 4. For the MaintDredge scenario, two dredge periods were specified: one from 50 to 300 hours and another from 350 to 600 hours. The time series of dredged and placed volumes for Test 108 is shown in Figure 16. The remaining dredge volume decreases steadily during the two designated periods, and remains constant during the 50 hour break between the two dredging periods. The MaintDredge Placement area is filled after 220 hours of dredging (equal to 270 hours of simulation time), at which time the remaining dredged is assumed to be placed in an area off of the CMS grid domain and that volume is recorded. Between 200 and 350 hours, dredging has ceased and the dredged and placed volumes remain constant. After hour 350, dredging continues and the material is placed off the CMS grid domain.
As seen previously in Test 101 (See Figure 8), the time to dredge the entire source area at 6000 m3/day is approximately 528 hours. Since the allocated dredge time for Test 108 is 500 hours, the source area volume of 130,000 m3 is not completely removed. The dredge volume is limited to 125,000 m3 due to the specified dredging periods and dredge rate.
-
Figure 16. Dredge Source and Placement Area volume evolution for Test 108, CapitolDredge Scenario.
