Profile Feature Extraction: Step 3 - Calculate CERI

Summary: This step uses feature characteristics from generated CERI tables along with wave and storm surge data to calculate CERI values for each transect. Wave and storm data are imported from saved WIS (Wave Information Studies, United States Army Corps of Engineers 2024) and NOAA (National Oceanic and Atmospheric Administration 2024) lookup tables, respectively. User-defined return periods for waves and water levels indicate the severity of the storm event for which CERI values are calculated. This step appends the CERI table generated in Step 2a or Step 2b. There is no feature class output in this step. For more information on the full calculation of CERI factors and the overall CERI value, please see Dong et al. (2018) and Spurgeon (2023).
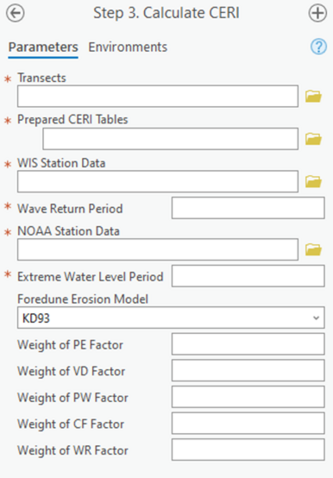
Transects: Transects generated in the previous steps. The location of these transects assists in selecting WIS and NOAA data.
Prepared CERI Tables: The CERI table created in previous steps, output will be appended to the table.
WIS Station Data: The Wave Information Study lookup table, located in the lookup .gdb provided with the toolbox.
Wave Return Period: An integer wave return period from 1 to 100 years. The CERI values will be calculated based on resilience to the selected return period of the extreme event.
NOAA Station Data: The NOAA extreme water levels lookup table, located in the lookup .gdb provided with the toolbox.
Extreme Water Level Return Period: An integer water level return period between 1 and 100 years. The CERI values will be calculated based on resilience to the selected return period of the extreme event.
Foredune Erosion Model: The foredune erosion model that will be used during CERI calculation. Options include KD93 (Kriebel and Dean 1993) and K99 (Komar et al. 1999) foredune erosion models.
Weight of PE, VD, PW, CF, WR Factor: The custom weighting factors for CERI factors, if desired. The default CERI calculation weights each factor of CERI equally and will calculate as such if left blank.
Best Practices & Example Data:
1. A 10 year return period is the most common value for both water level and wave return periods since this is a frequently assumed renourishment interval.
2. The KD93 foredune erosion model tends to provide more conservative results as it provides more consistent recession values alongshore, but both models are used frequently based on user preference.
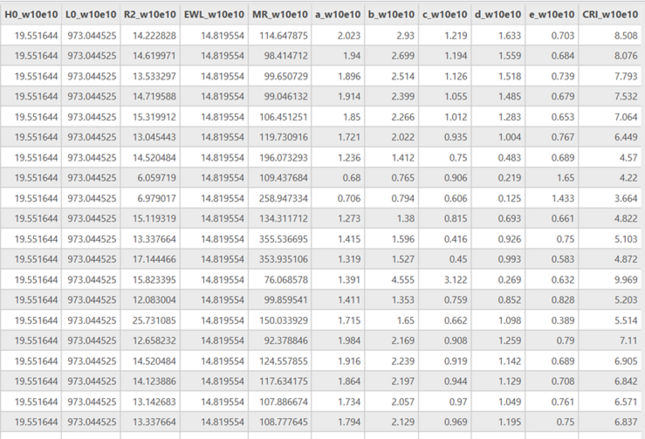
Figure 14 below displays the fields in the CERI table that are appended during this step. In the case that a CERI table already has these fields and is used as an input to this step, any data within these fields will be overwritten as CERI is recalculated. Please see the appendix for definitions for all the fields added in Step 3.
