Quick Response Toolbox: Step 7 - Calculate Volume Above Shoreline
From CIRPwiki
Revision as of 23:47, 10 December 2024 by Rdchlaje (talk | contribs) (Created page with "{{DISPLAYTITLE:Quick Response Toolbox: Step 7 - Calculate Volume Above Shoreline}} File:QR Step7.jpg|thumb|right|alt=A screenshot of the ArcPro geoprocessing panel for Step 7. The "Raster(s)" input allows the user to select the file from a dropdown menu or the file explorer. The "Vertical Unit of Input Raster" allows user to select appropriate units from a drop down menu. The "Transect Mask" allows the user to enter file locations as text or select from the file explo...")
(diff) ← Older revision | Latest revision (diff) | Newer revision → (diff)
Jump to navigation Jump to search


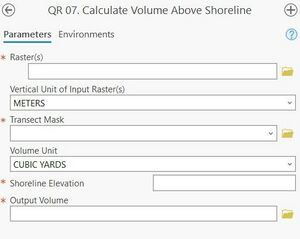
A screenshot of the ArcPro geoprocessing panel for Step 7. The "Raster(s)" input allows the user to select the file from a dropdown menu or the file explorer. The "Vertical Unit of Input Raster" allows user to select appropriate units from a drop down menu. The "Transect Mask" allows the user to enter file locations as text or select from the file explorer. The "Volume Unit" input allows users to select desired unit from a drop down menu. The "Shoreline Elevation" input requires a numerical text value from the user. The "Output Geodatabase" input allows the user to enter file locations as text or select from the file explorer.
Step 7: Calculate Volume Above Shoreline

Summary: This step analyzes volume in each bin above the defined shoreline elevation. In each bin the sum, minimum, maximum, mean and standard deviation of the difference grid is calculated, and the statistics are added to the transect mask feature class. This step needs to be run for each raster year.

Raster(s): Raster layer, one run for each year.

Transect Mask: Transect mask created in Step 2.

Volume Unit: Desired unit of measure for volume output. Options are cubic yards, cubic meters, and cubic feet.

Shoreline Elevation: User-defined shoreline elevation used in Step 5.

Output Volume: Desired name and file path for the project. The output file name will be “User-defined project name” + “_date_” + “VolAboveMHW”.


Best Practices & Example Data: 1. The shorelines from this tool may require manual editing to delete contour lines that are not shoreline data. For smoothing tolerance, a value of 20 meters is typically effective and is the default value within the tool.

Figure 9 below displays volume above MHW output for Homer, AK 2019 example data. Symbology edited to display volume attribute. When the output from this step is loaded into the map the user may wish to alter the symbology. Below the data is symbolized based on the “NetVolume” attribute. A table containing descriptions for pertinent attributes within the output tables can be found in the Attribute Table Definitions.
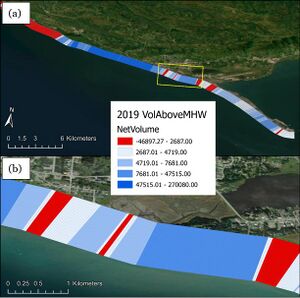
A view of the volume above MHW polygons visualized by net volume in cubic meters. The bins show blue for volume above MHW and red for volume below MHW. There is one for the whole project as well as a zoomed in extent. The magnitudes for both signs are similar and there is an area on the far west end of the study area showing wide spread below MHW trends.
Figure 9: 2019 Volume above MHW output from Step 7 at Homer, AK. The bottom figure (b) displays the zoomed area outlined in yellow from (a) to show individual bins.

Useful Links

JALBTCX Main Documentation Page

Refences: Quick Response Toolbox