Tips for Developing Bathymetry Grids for Coastal Modeling System Applications
INTRODUCTION:
The governing equations of engineering numerical models of coastal process represent the leading physical phenomena associated with wave transformation, circulation produced by various forcing mechanisms, sediment transport, and morphology change. Processes such as wetting and drying, nonerodible bottom, and avalanching of steep slopes can also be described (Buttolph et al. 2006). Typically, the reliability of a simulation depends more on the quality of the input forcing data and the bathymetry data, and less on representation of the physics or on the numerical solution approach. Common forcing conditions are tide, wind, offshore waves, river discharges, and their combination. This CHETN concerns development of grids that represent the bathymetry (water depth), topography (land elevations above typical water level datum), structures such as jetties and breakwaters, and the land-sea boundary (shoreline on ocean and bay perimeters)for two-dimensional (2-D) depth-averaged circulation models and wave models. The accuracy and resolution to which such features should be represented depends on study goals and desired efficiency of the modeling. The reliability of a coastal modeling application depends directly on the accuracy and consistency of the bathymetry data entered on the grid.
Long waves are waves with length much greater than the water depth. Such waves include tsunami, tide, and seiches in lakes. Long waves travel at the speed (gh)1/2, where g = acceleration due to gravity, the value of which depends slightly on latitude, and h = water depth. If the bathymetry of a modeling grid suffers a systematic translation up or down (typically caused by a vertical datum shift), then the calculated long waves and associated water level and current will be compromised over the entire grid. Similarly, if channels are not correctly represented, speed of the wave will be altered. Misrepresentation of channel depth is a typical source of phase error between calculated water level and measured water level in the more distant reaches of bays. Ocean waves break at a certain depth in shallow water, typically generating a significant current and sediment transport. Calculation of both the location and pattern of wave breaking and the wave-induced current depend on the bathymetry grid. All these processes are represented and can interact in the CMS.
Once a bathymetry grid is created and tested, it is rarely inspected during production simulation runs. The proverb “A good beginning makes a good ending” is therefore appropriate to the task of grid development.
BEGINNING OF MODELING STUDY:
If the modelers and key personnel involved are not familiar with the study area, then a site visit should be made. At that time, the study sponsors can point out concerns and various features of interest. Condition of the jetties and shoreline, the general circulation pattern, type of sediment, and recent changes and distinguishing features can be noted. Historic and recent aerial photographs, preferably vertical photographs that can be rectified, should be assembled, from which locations of structures and shorelines can be read from georeferenced images. Those with local knowledge can be interviewed to learn about the presence of sand shoals and strong or weak currents. At this point, a meeting of the modeling team and Project Delivery Team is beneficial to review modeling objectives and essential features governing the waves, circulation, and sediment transport at the site. It is possible that several bathymetry grids may need to be developed that represent a past condition, existing condition, and the engineering alternatives under consideration.
INFORMATION AND DATA GATHERING:
In the following, the phrase “bathymetry grid” unless otherwise noted refers collectively to marine and land elevation, shoreline position, and location and configuration of coastal structures. Coastal inlet applications are emphasized, for which all such data are required in CMS applications as performed in the Coastal Inlets Research Program (Hughes and Kraus 2006).
Sources of Bathymetry Data:
Bathymetry data can be obtained from a variety of sources, and a full bathymetry grid typically consists of information from several surveys and databases. The accuracy and limitations of the surveys (and databases) should be understood, and the coverage documented through metadata. Occasionally, these surveys may contain random vertical errors that may adversely influence the simulations and should be identified and addressed (Byrnes et al. 2002; Johnston 2002).
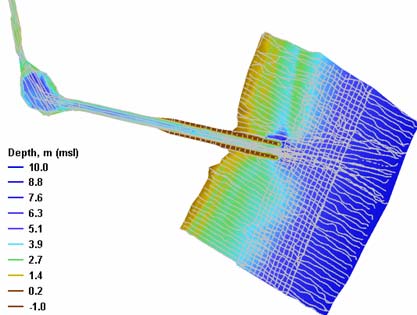
At a minimum, the metadata set describing background of bathymetry data sources contains horizontal and vertical coordinate system information and units, and the date of the survey. A simulation conducted for a time interval close to the surveys is best for comparison with measurements, such as with National Oceanic and Atmospheric Administration (NOAA) water level measurements. If a non-tidal vertical reference datum was used in a survey, the metadata should provide a relationship of this datum to known tidal datums (particularly to mean sea level (msl) or to mean tide level (mtl)) for the site. For example, mean low tide is a non-tidal datum defined by the U.S. Army Engineer District, Galveston, because of the strong influence of wind tide along the coast and coastal inland waters of Texas (Kraus et al. 1997). Similarly, the International Great Lakes Datum is a survey datum in the Great Lakes. Tidal and nearshore circulation modeling is done with reference to msl, mtl, or mean water level (Great Lakes), so that the average amount of water is represented on the modeling grid through time. Often, bathymetric and land surveys are performed by reference to a geodetic datum such as National Geodetic Vertical Datum 1929 (NGVD 29), North America Vertical Datum 1988 (NAVD 88), to mean lower low water, or to a local survey datum, and a transfer must be made to the mean level of the water body being considered. Benchmark information for Federal water level stations can be found at http://tidesandcurrents.noaa.gov. An example of boat survey track lines is shown in Figure 1 for Packery Channel Inlet, Corpus Christi, TX. To this local survey would be added available navigation channel survey data (channel cross sections), location of jetties as through rectified aerial photographs, and offshore and alongshore bathymetry data obtained through other surveys or databases. Specialized surveys of the bayside wetland and marshes might also be required, depending on application. In assembling bathymetry data, the team should consider including topographic elevation information on the grid. Typically, in modeling a beach or other gently sloping shore, it is desirable to include a certain distance above msl to account for flooding and drying during typical storms. Depending on local tidal range, 1 to 3 m of topographic elevation is usually sufficient, but in some modeling efforts (such as in conducting surge modeling or in representing rivers with great change in water level), 4 m or more of elevation may be needed for improved accuracy of the modeling.

Figure 1. Example of boat survey, showing track lines and bathymetry.
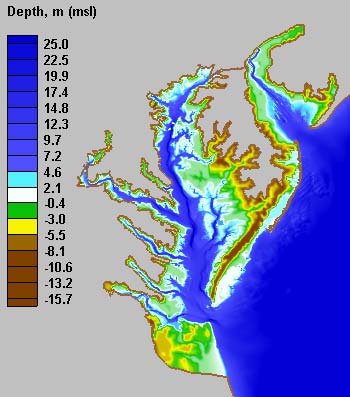
As an example of the necessity of including substantial topographic features, the U.S. Army Engineer Research and Development Center (ERDC) Coastal and Hydraulics Laboratory (CHL) applied this technique in developing a numerical model grid for Chesapeake Bay, MD, surge study (Lin et al. 2004). The U.S. Geological Survey (USGS) Digital EEM database, GTOPO30 – 30-sec arc resolution (http://edcdaac.usgs.gov/gtopo30/gtopo30.asp) was consulted to include low-land topography on the grid to an elevation of 10 m above mtl. Representation of inland basins and valleys allowed simulation of water storage capacity for the surge caused by numerous tropical and extratropical storms. An image showing the final grid for this study is given in Figure 2.
Resources for obtaining elevation data include LIght Detection And Ranging (LIDAR) surveys such as from the U.S. Army Corps of Engineers (USACE) National Coastal Mapping Program (http://shoals.sam.usace.army.mil/Data/Data_Home.asp), NOAA’s 2-min resolution topographic datasets, ETOPO2 (http://www.ngdc.noaa.gov/mgg/image/2minrelief.html), and USGS sites such as the Seamless Data Distribution System (http://seamless.usgs.gov/).
