Inlet Geomorphic Analyses
Several geomorphic analyses of inlets have been conducted through the Geomorphic Evolution Work Unit of the CIRP. The goal of this type of research is to enhance our understanding of the natural and anthropogenically modified nature of tidal inlet systems and their navigation channels. The mission of the Geomorphic Evolution Work Unit is improve the knowledge of geomorphic properties and long-term evolution of inlets, and to develop useful tools in the management of this dynamic resource.
Each study listed below focuses on a comparison of some balance between the natural forces and the resultant geometric shape and morphologic characteristics of tidal inlets. Because many of our managed tidal inlets are not natural, several distinctions are made in the geomorphic analyses given below. These variances allow for a clearer understanding of how natural and modified (e.g. jettied) tidal inlets behave.
Tidal Inlet Classification
Most studies of tidal inlets refer to the classification of Hayes (1979) to place the site into a geomorphic context. A tidal inlet is an opening in the shore that allows exchange of water between the ocean and bays, lagoons, and marsh and tidal creek systems, and for which the tidal current maintains the main channel of the inlet (FitzGerald 2005). The Hayes (1979) classification is aimed to identify geomorphic inlet type by tide range and mean wave height, and it has limiting states of tide dominated and wave dominated, with mixed states defined in between. The classification thus attempts to convey qualitative information about the plan-view geomorphology of a tidal inlet. Wave-dominated inlets are understood to have ebb deltas that are smaller in area and volume than tide-dominated inlets and are typically associated with micro-tidal ranges (range < 2 m, according to Davies 1964), whereas tide-dominated coasts have well-developed ebb deltas and are typically associated with meso-tidal ranges (2 m < range < 4 m). Davis and Hayes (1984) continue such discussion. Ebb deltas at wave-dominated tidal inlets typically have arcuate or horseshoe-shaped bypassing bars and a shoal in front of the ebb jet (the “ebb delta proper” following terminology of Kraus (2000)), and tide-dominated inlets tend to exhibit two shore-normal parallel channel margin bars, without an ebb delta proper. Because mixed-energy inlets can exhibit a wide range of varying energy forcing (both wave and tidal), their ebb deltas are not as easily defined and may exhibit a variety of morphologies (FitzGerald 1982). Typical morphologic features associated with mixed-energy ebb deltas include an updrift channel margin linear bar, a flood marginal channel along the updrift side of the delta, and a large and shallow bypassing platform along the downdrift side of the delta.
Bruun and Gerritsen (1959) identified two mechanisms for natural sediment bypassing at tidal inlets: (1) wave-induced sand transport along the periphery of the ebb delta (bar bypassing), most applicable to wave-dominated inlets, (2) transport of sand in channels by tidal currents (tidal bypassing), most applicable at tide-dominated inlets. FitzGerald (1982) examined sediment bypassing at non-structured, mixed energy tide-dominated inlets and identified a discontinuous or episodic process of attachment of portions of the ebb delta to the downdrift shore (see Gaudiano and Kana (2000) for a case study). Such detachment or significant shoal migration as a collective feature (Sonu 1968) is also manifested in structured inlets as jetty tip shoals, sand bodies that migrate around, typically, the updrift jetty to deposit near or in the navigation channel. For design and management of inlets, especially those inlets stabilized by jetties and those to be dredged for navigation, a general classification scheme of inlets according to their wave environment, if valid, provides helpful information for both initial desk-top planning and in subsequent quantitative analysis. However, site experiences have revealed tidal inlets (structured and unstructured) that did not fall into the expected classification, motivating the present study.
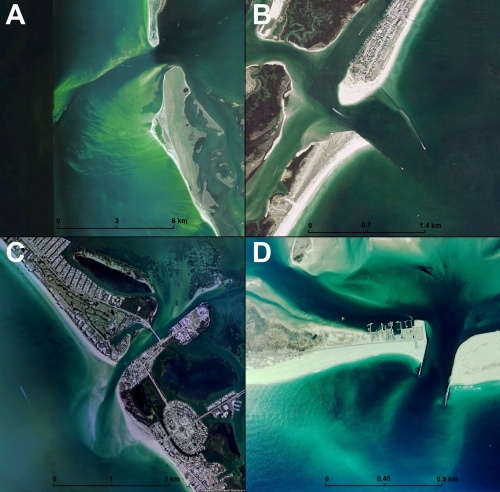
Eighty-nine inlets along the Atlantic, Pacific, and Gulf of Mexico coasts of the United States were examined to assess their compatibility with the Hayes (1979) diagram. Following concepts and methods in Hayes (1979), the inlets were separated into three morphologic classes (wave dominated, tide dominated, and mixed energy) based on inspection of aerial imagery and nautical charts produced by the National Oceanic and Atmospheric Administration, National Ocean Service (NOS). Fifty-seven inlets were classified as wave dominated, nine inlets were classified as tide dominated, and twenty-three inlets were classified as mixed energy. Figure 1 gives examples of inlet morphologic type determined from ebb delta morphology as evident in aerial photographs and to illustrate the authors’ decision process. In the figure, (A) is Boca Grande Inlet, Florida, exhibiting a tide-dominated morphology with large marginal linear shoals extending along the channel; (B) is Masonboro Inlet, North Carolina, exhibiting a mixed-energy morphology with jetties; (C) is New Pass, Florida, exhibiting a natural mixed-energy morphology with one updrift channel margin linear bar and a large downdrift bypassing platform; and (D) is Shinnecock Inlet, New York, exhibiting a wave-dominated inlet with a large arcuate bypassing bar characterizing the ebb delta.
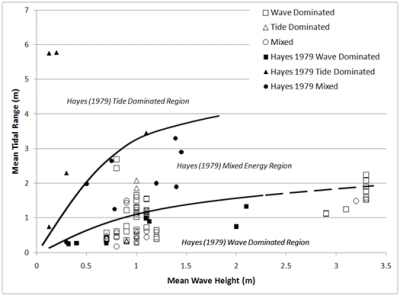
The 89 data points assembled are plotted in Figure 2 together with 20 of the 21 original points of Hayes (1979) that could be identified. Based on lack of segregation of the data, there appears to be no justification for a classification describing mixed-energy tide-dominated and mixed-energy wave-dominated inlets. There is little separation of the tidal inlet morphologic type based on mean tide range, with three inlets clearly classified by visual inspection as wave dominated (Plum Island Sound, Essex Bay Inlet, and Newbury Port Harbor, all in Massachusetts), but lying close to the original line demarking tide dominated. Many inlets classified visually as tide dominated fall into the Hayes category of wave dominated (for example, New Pass, Lee County, Redfish Pass, Boca Grande Pass, Pensacola Bay Entrance and Bunces Pass, all in Florida; and Barataria Pass, Louisiana).
The inlets presented in the original Hayes (1979) diagram were not typical barrier island inlets. Some of which were fjords, and Bristol Bay and the Copper River Delta in Alaska included in the original diagram may not be considered as tidal inlets (based upon the definition that the main inlet channel be maintained by the tidal current (FitzGerald (2005)), but rather as entrances to large bays. The Bay of Fundy, included in the original Hayes diagram is an entrance with an extremely large tidal range and a small mean wave height. Such sites differ from the more typical and less extreme barrier-inlet systems examined in the present study.
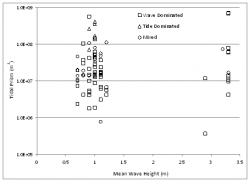
It is concluded that, except for extremes of either tide range or wave height, the inlet classification approach of Hayes (1979) holds little utility. This finding extends the observations of Davis and Hayes (1984), who discuss other variables that might determine or limit the end state of inlet morphology, including physiography and stratigraphic sequences. They hypothesized that tidal prism, instead of tidal range, would provide improved prediction of inlet morphology type, stating “Exceptions to these stated generalizations are so numerous that wave energy and tidal prism must be included in characterizing coasts. It is possible to have wave-dominated coasts with virtually any tidal range and likewise possible to have tide-dominated coasts even with very small (tide) ranges.” However, Figure 3 plots the classification data against tidal prism and mean wave height, and no segregation of inlet morphologic type with tidal prism in lieu of tide range is found.
Geometric Properties
Aerial photographs and nautical charts were analyzed to evaluate the seaward and downdrift longshore extents of ebb tidal deltas for a number of the inlets within the database. Non-rectified aerial photographs of different scales were consulted, with individual photograph scales determined through comparison of distance between two stationary objects, such as two jetties. On some photographs, the ebb delta could be identified through calm water. For other photographs, the location of the ebb delta had to be inferred by wave refraction and diffraction patterns (Gibeaut and Davis, 1993). Uncertainty is associated with the latter situation. If the ebb delta could not be readily identified, the photograph was eliminated from analysis. For some Pacific coast and highly wave-exposed Atlantic coasts, the location of the breaking waves for fair-weather waves is located landward of the terminal lobe of the ebb delta (due to their great depths), and therefore nautical charts were necessary for analysis.
Two geometric properties of the ebb-delta plan view shapes were obtained from interpreting the photographs or nautical charts: the distance to the most seaward extent of the ebb delta Ds, and the distance to the down-drift attachment bar Dd. Figure 1 illustrates Ds and Dd. Although measurements were made from one source for each inlet (most recent aerial photograph or nautical chart), several sources were reviewed for the inlet to ensure the determination was reliable. Uncertainties introduced for the distance measurements are estimated to be 25 to 150 m, depending on the scale, distortion, and parallax on the aerial photograph. Inlets selected for analysis were considered mature and assumed to be in quasi-equilibrium.
The distance to the most seaward extent of the ebb delta Ds was measured from the water-beach interface. In aerial photographs, this distance was determined visually based on the identification of the ebb delta through tonal changes (Gibeaut and Davis 1993). Nautical charts were analyzed if aerial photographs were not available or if ebb delta plan views were not distinguishable on photographs, e.g., at Pacific coast inlets with greater ebb shoal extents. Distance to the seaward extent of the ebb delta on nautical charts was determined as the point at which the contour lines were oriented similar to offshore contours far from the inlet (Vincent and Corson 1981). This distance was visually clear and easily identified by assessment of the slopes at the terminal lobe of the ebb delta. Gentle contours were identified over the ebb delta, transitioning to greater slopes as the ebb delta met the continental shelf.
A consistent interpretation of the location of the shoreline from the aerial photographs and nautical charts was attempted. A baseline was determined with two end points located at the updrift and downdrift shorelines outside of the direct influence of the inlet or terminal structures. This methodology is similar to that of Gibeaut and Davis (1993), whose baseline end points were located where the ebb delta intersected the shoreline to obtain a shoreline trend from which their measurements could commence. Figure 1 shows an example of the shoreline trend utilized for measurement of the distance to the most seaward extent of the ebb delta. The identification of a baseline from which measurements are taken effectively eliminates ambiguity of an updrift and downdrift shoreline offset. For example, Grays Harbor, Washington, has a large shoreline offset (approximately 3 km), whereas Mason Inlet, North Carolina, has negligible offset. Shoreline offsets may be produced by coastal structures adjacent to the jetty or from the presence of the ebb delta attachment.
The distance to the downdrift attachment bar Dd was measured along a straight baseline set parallel to the trend of the shoreline. The measurement began at the downdrift inlet shoreline (at the narrowest section of the inlet channel) and ended at the location of the ebb delta attachment to the downdrift shoreline. If the location of the narrowest section of the inlet channel was not located along the baseline, then the measurement origin was translated perpendicularly to begin along the baseline. An attempt was made to determine a distance to the updrift attachment bar as done by Carr and Kraus (2001) for a limited number of inlets, but identification was difficult at most of the additional inlets examined. Updrift bypassing bars were found to be rare at inlets stabilized by jetties, so this parameter was not analyzed.
Seaward Extent of Ebb Delta, Ds
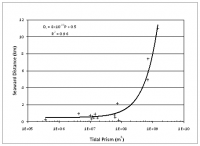
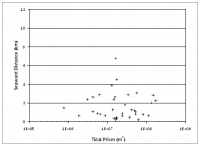
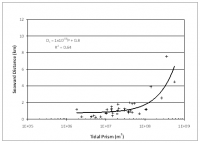
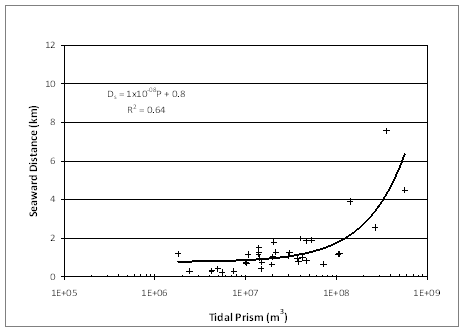
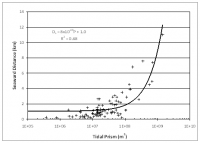
The seaward extent of an ebb delta is expected to be proportional to the magnitude of the tidal prism, based on experience with many inlet morphologic properties that correlate with prism (as summarized by Kraus 2009). Figure 2 plots the results for all inlets, and Figures 3 through 5 plot results for highly, moderately, and mildly wave-exposed coasts as defined by Walton and Adams (1976). Except for the moderately wave-exposed coasts, a visually drawn line for Figure 2 describes the data as Ds = 1 km for tidal prism with a range less than 108 m3, after which the line of correlation arcs upward linearly with P, indicating a notable change in behavior of the ebb delta for prism greater than 108 m3. The same general behavior holds true for Figures 3 and 5, with near-constant Ds for P < 108 m3. Evidently, there is a tipping point in tidal prism above which it dominates over other possible controlling factors such as wave direction, back-bay configuration, and tidal inlet channel alignment, that can contribute to determination of inlet plan-form morphology. Best-fit lines are plotted on Figures 3, 4, and 5 along with their associated equation and correlation coefficient. No correlation between Ds and tidal prism was found for moderately wave-exposed inlets (Figure 4).
A stronger correlation of Ds and tidal prism was expected for highly wave-exposed inlets because greater wave energy limits the extent to which the ebb delta can grow offshore under a given tidal prism forcing. Mildly wave-exposed inlets with large tidal prisms are typically situated along wide continental shelves (which gradually dissipate wave energy) and tend to have a shallow offshore platform, for example, as that found at Boca Grande Pass, Florida and Sapelo Sound Inlet, Georgia. At such sites, the distance to the furthest seaward extent of the ebb delta may be a function of the accommodation space on the shelf and the shelf slope. At other inlets, such as Stono Inlet, South Carolina, and Willapa Bay Inlet, Washington, another controlling factor to Ds is the amount of available sediment to form large ebb deltas.
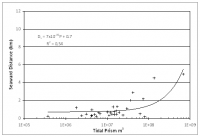
Jetties constrict the ebb flow of an inlet, or its ebb jet, and are expected to cause sediment deposition further offshore than a natural inlet with the same tidal prism. Therefore, it was initially hypothesized that the seaward margin of the ebb delta at dual-jettied inlets would be located further offshore. Figure 6 does not indicate a correlation describing this pattern. As an example, the greatest seaward extent of an ebb delta with two jetties was 5 km, and yet the greatest seaward extent of all the inlets (Figure 2) was 11 km for San Francisco Inlet (no jetties). The ebb deltas with the greatest seaward extents were associated with inlets without jetties, which are large tidal inlets for which jetties are neither feasible to construct nor necessary (Mobile Bay Entrance, Alabama, Sapelo Sound Inlet, Georgia, and Willapa Bay Inlet, Washington).
Distance to Downdrift Attachment Bar, Dd Bruun (1995) discussed what he termed the “short” distance and “long” distance of shoreline recession at littoral barriers. The beach segment between the downdrift jetty of an inlet and its attachment bar represents the short distance and has been referred to as an “isolated” beach (Hanson and Kraus 2001). Longshore sediment transport input is limited to the isolated beach by the jetty and by the attachment bar, which acts as a groin, and such beaches experience chronic erosion. Further down drift, the long-term influence of the littoral barrier is manifested as a smaller rate of shoreline recession.
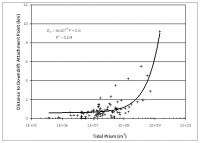
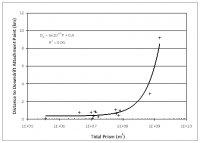
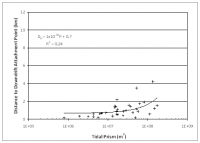
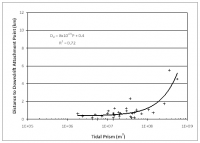
The distance to the down-drift attachment bar is, therefore, of great interest in defining the extent of the isolated beach and understanding the scale of coastal change of an inlet. This distance is represented by the quantity Dd. Figure 7 plots the results for all inlets, and Figures 8 through 10 plot results for highly, moderately, and mildly wave-exposed coasts. Similar to the findings in the previous section for Ds, the distance Dd remains approximately constant for tidal prism P < 108 m3, then increase linearly with P above this critical value. Trend lines are plotted on Figures 7 through 10 along with their associated equation and correlation coefficient.
As suggested by Bruun (1995), Dd is a characteristic parameter indicating the relative influence of wave and tidal energy forming the bypassing pathways and the associated down-drift attachment. In separating the amount of wave exposure, a reasonable correlation between Dd and tidal prism is found for highly and mildly wave-exposed inlets (Figures 11 and 13), with R2 of 0.95 and 0.72, respectively. However, moderately wave-exposed inlets exhibit weak correlation between Dd and P (Figure 12). A strong correlation of Dd and P was expected for highly wave-exposed inlets, similarly to Ds, because higher wave energy will modify the lateral extent of sediment bypassing pathways. It is not clear how the lateral extent of sediment transport is modified by tidal flow; it is speculated that the persistent higher wave energy, with greater refraction by large wave periods, dominates the morphology of the inlets through reducing the variation in directional wave exposure.
References
- Bruun, P., and Gerritsen, F., 1959 Natural by-passing of sand at coastal inlets. Journal of the Waterways and Harbors Division WW4, pp. 75-107.
- Bruun, P., 1995. The development of downdrift erosion. Journal of Coastal Research 11(4), pp. 1242-1257.
- Buonaiuto, F.S., and Kraus, N.C., 2003. Limiting slopes and depths at ebb-tidal shoals. Coastal Engineering 48(1), pp. 51–65.
- Carr de Betts, E.E., 1999. An examination of flood deltas at Florida’s tidal inlets. MS thesis, University of Florida, Gainesville, FL, 125 p p.
- Carr-Betts, E.E., 2002. Morphologic asymmetry of ebb deltas at tidal inlets. MS Thesis, Report Number UFL/COEL-2002/16. University of Florida, Gainesville, FL, 171 pp.
- Carr, E.E., and Kraus, N.C., 2001. Morphologic asymmetries at entrances to tidal inlets. Coastal and Hydraulic Engineering Technical Note ERDC/CHL CHETN-IV-33, U.S. Army Engineer Research and Development Center, Vicksburg, MS. (http://chl.wes.army.mil/library/publications/chetn).
- Davies, J.L., 1964, A morphogenic approach to world shorelines: Zeitschrift für Geomorphologie 8, pp. 27-42.
- Davis, Jr., R.A., and Hayes, M.O., 1984. What is a wave dominated coast? Marine Geology 60, 313-329.
- FitzGerald, D.M., 1982. Sediment bypassing at mixed energy tidal inlets. Proceedings 18th Coastal Engineering Conference, ASCE Press, pp. 1094-1118.
- FitzGerald, D. M., 2005. Tidal inlets. In: Encyclopedia of Coastal Science, Schwartz, M. (ed.), Springer, 958-685.
- Gaudiano, D.J., and Kana, T.W., 2000. Shoal bypassing in South Carolina tidal inlets: Geomorphic variables and empirical predictions for nine mesoscale inlets. Journal of Coastal Research 17(2), 280-291.
- Gibeaut, J.C., and Davis, R.A., 1993. Statistical geomorphic classification of ebb-tidal deltas along the west-central Florida coast. Journal of Coastal Research SI(18), 165-184.
- Hanson, H., and Kraus, N.C., 2001. Chronic beach erosion adjacent to inlets and remediation by composite (T-head) groins. Coastal Engineering Technical Note CHETN-IV-36, U.S. Army Engineer Research and Development Center, Vicksburg, MS.
- Hayes, M.O., 1979. Barrier island morphology as a function of tidal and wave regime. In: Barrier Islands form the Gulf of St. Lawrence to the Gulf of Mexico, S.P. Leatherman (Ed.). Academic Press, NY, pp. 1-27.
- Jarrett, J.T., 1976. Tidal prism – inlet area relationships. GITI Report 3, U.S. Army Engineer Waterways Experiment Station, Vicksburg MS. 55 pp.
- Kraus, N.C., 2000. Reservoir model of ebb-tidal delta evolution and sand bypassing. Journal of Waterway, Port, Coastal, and Ocean Engineering 126(3), 305-313.
- Kraus, N.C., 2009. Engineering of tidal inlets and morphologic consequences. In: Handbook of Coastal Engineering, Kim, Y. (ed.), Chapter 31, World Scientific Publishing, pp. 867-900.
- Marino, J.N., and Mehta, A.J., 1987. Inlet ebb tide shoals related to coastal parameters. Proceedings Coastal Sediments 87, ASCE Press, pp. 1,608-1,622.
- Sonu, C.J., 1968. Collective movement of sediment in littoral environment. Proceedings 11th Coastal Engineering Conference, ASCE Press, pp. 373-398.
- Vincent, C.L., and Corson, W.D., 1981. Geometry of tidal inlets: empirical equations. Journal of Waterway, Port, Coastal and Ocean Division, 107(1), pp. 1-9.
- Walton, T.L., and Adams, W.D., 1976. Capacity of inlet outer bars to store sand. Proceedings 15th Coastal Engineering Conference, ASCE Press, pp. 1919–1937.
Back to Inlet Database
