CR-07-1:Chapter5
A Unified Sediment Transport Formula for Coastal Inlet Application
Summary of total load formula
In the following, a summary is given of the governing equations in the sediment transport model in concise form. Previous presentation of the model included many aspects of the equations that were developed and tested, which could make it difficult for the reader to extract the most suitable equations needed for computations.
Bed-load transport
Camenen and Larson (2005a, b) developed a formula for the bed-load transport based on the Meyer-Peter and Müller (1948) formula. The bed-load transport (qsb) may be expressed as follows:
| (225) |
where the subscripts w and n correspond, respectively, to the wave direction and the direction normal to the waves, s is the relative density between sediment (s) and water (), g the acceleration due to gravity, d50 the median grain size, aw, an, and b are empirical coefficients (to be discussed), cw,m the mean Shields parameter, cw the maximum Shields parameter due to wave-current interaction, , where fc is the current related friction factor, Uc the steady current velocity, and the angle between the wave and the current direction. To simplify the calculations, the mean and maximum Shields parameter due to wave-current interaction is obtained by vector addition:
and , where is the angle between the mean current direction and the wave incidence direction, and c, w,m, and w are the current, mean wave, and maximum wave Shields number, and w,m = 0.5 w for a sinusoidal wave profile. The net sediment transporting velocity in Equation 225 is given by:
| (226) |
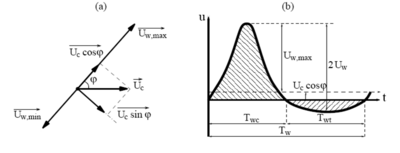
where cw,onshore and cw,offshore are the mean values of the instantaneous shear stress over the two half periods Twc and Twt (Tw = Twc + Twt, in which Tw is the wave period), and pl,b a coefficient accounting for the phase lag (Camenen and Larson 2006). In the same way as for the Dibajnia and Watanabe (1992) formula, the mean values of the instantaneous shear stress over a half period are defined as follows (Figure 93):
| (227) |
where uw(t) is the instantaneous wave orbital velocity, t the time, and fcw the friction coefficient due to wave-current interaction introduced by Madsen and Grant (1976):
| (228) |
with , where Uw is the average of the peak velocities during the wave cycle (the root-mean-square value is used for random waves). Based on comparison with an extensive data set (Camenen and Larson 2005b), the following relationship is proposed for the transport coefficient aw:
| (229) |
in which Y = c/(c + w). The coefficient perpendicular to the waves, where only the current transport sediment, is set to an = 12, and the coefficient in the term describing initiation of motion is b = 4.5 (Equation 225). The phase lag is introduced through the coefficient pl,b = c - t following Camenen and Larson (2006):
Figure 93. Definition of current and wave direction and velocity variation at bed in direction of wave propagation.
| (230) |
where Uw,cr,sf is the critical wave orbital velocity for the inception of sheet flow (Equation 57), and Ucw,j is the root-mean-square value of the velocity (wave and current) over the half period Twj, and the subscript j should be replaced either by c (crest or onshore) or t (trough or offshore) (Figure 93):
| (231) |
Suspended load transport
In determining the suspended load qss, following the simplified approach by Madsen (1993) and Madsen et al. (2003), the vertical variation in the horizontal velocity was neglected and an exponential-law profile assumed for the sediment concentration. Thus, the suspended sediment load may be obtained from (Camenen et al. 2005; Camenen and Larson 2007):
| (232) |
where h is the water depth, Uc,net the net mean current over a wave period, cR the reference concentration at the bottom, Ws the sediment fall speed, and the sediment diffusivity. In calculating the integral, the ratio Wsh/ may often be assumed large, implying that the exponential term is close to zero. However, such an assumption that integrating to infinity or to h produces about the same result may not be valid if a strong mixing by wave breaking is present. The bed reference concentration is obtained from:
| (233) |
The coefficient AcR is written as follows:
| (234) |
where is the dimensionless grain size. A multiplying factor is introduced if plunging breakers occurs:
| (235) |
The sediment diffusivity is related to the energy dissipation:
| (236) |
in which D is the total effective dissipation:
| (237) |
where the energy dissipation from wave breaking (Db) and from bottom friction due to current (Dc) and waves (Dw) were simply added, and kb, kc, and kw are coefficients (Equations 175, 166, and 167, respectively). The coefficient kb corresponds to an efficiency coefficient, whereas kc and kw are related to the Schmidt number. Assuming a parabolic profile for the vertical sediment diffusivity, its mean value over the depth (for a steady current or waves, respectively) may be written as follows:
| (238) |
where σc/w is the Schmidt number or ratio between the vertical eddy diffusivity of the particles v and the vertical eddy viscosity v, and u*c/w is the shear velocity due to a current or to waves only, respectively, and Cw is an integration constant that is 1 for the case of a steady current and /2 for a sinusoidal wave. The following expression for the Schmidt number was proposed:
| (239) |
where A1 = 0.4 and A2 = 3.5 in case of a steady current alone and A1 = 0.15 and A2 = 1.5 in case of waves only. For wave and current interaction, a weighted value is employed for the Schmidt number:
| (240) |
The net mean current is defined in a similar way to the net Shields parameter for the bed load in order to take into account sediment transport due to asymmetric waves, as well as possible phase lag between the suspended concentration and the velocity:
| (241) |
where αpl,s is a coefficient for the phase lag on the suspended load (Equation 221). For a steady current, Uc,net = Uc.
Bottom slope
The bottom slope may influence the sediment transport, especially if it is close to the critical value given by the internal friction angle at saturated conditions of the sediment. To take into account the local slope, the transport rate (qs) may be multiplied with a function containing the local slope and a coefficient,
| (242) |
where β is a coefficient for the bottom slope (0.5 < β < 2), and zb/s is the local slope. Following Bailard (1981), the coefficient β depends on the sediment transport mode:
| (243) |
where s = 0.02 is the suspended-load efficiency as given by Bailard (1981), and is the instantaneous velocity vector (wave and current combined).
Velocity profiles for varying slope
Variations in the velocity profile can influence both bed load and suspended load transport because the characteristic velocity in the lower part of the water column, where the concentration is larger, may be significantly reduced. Coles (1956) showed that velocity profiles in a non-uniform flow can be described by a linear combination of logarithmic profiles representing the law of the wall and a perturbation profile representing the influence of pressure gradients:
| (244) |
in which uh is flow velocity at the water surface (z = h), z0 the zero-velocity level (z0 = 0.03 ks from Van Rijn and Tan 1985), and A1 and A2 are dimensionless variables. Van Rijn and Tan (1985) proposed the following perturbation profile:
| (245) |
| Applying the boundary condition u(z) = uh for z = h, introducing the discharge integrated over the width |
, where B is the width of the flow, and assuming that the middepth velocity is approximatively the same as for a uniform flow, a relationship for n can be numerically obtained:
| (246) |
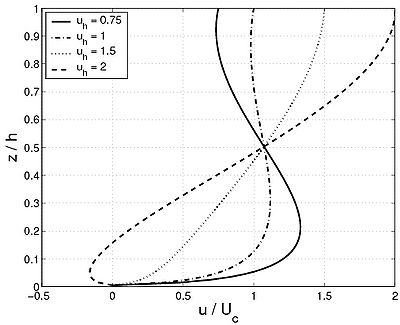
Figure 94 shows that this method is capable of representing a wide range of velocity profiles including those with flow reversal.
Figure 94. Velocity profiles according to Equations 244, 245, and 246 ('''Uc '= 0.4 m/sec, '''h '= 0.2 m, and '''zo '= 0.001 m). Van Rijn and Tan (1985) proposed a first-order differential equation to solve for the spatial variation of the water surface velocity uh, which yields an exponential adjustment of the surface velocity with respect to the equilibrium surface velocity uh,e, as follows:
| (247) |
The coefficients α1 and α2 have been found to depend on the local bottom slope with values determined by comparison to data from several experiments, and α3 takes into account lateral variations:
| (248) |
Equation 247 can be solved numerically by a Runge-Kutta method, with the surface velocity uh,0 as the boundary condition.
Application to coastal inlet studies
Longshore sediment transport forms the main input required for many coastal engineering projects such as dredging of inlet navigation channels, assessment of beach evolution in the vicinity of jetties and groins, and the evolution and stability of inlets, breaches, and estuaries. For coastal inlets, complex interactions occur among the longshore current, tidal current in the inlet, and waves, which may induce many types of phenomena related to sediment transport (Figure 2).
Validation of longshore sediment transport
To validate the present formula for the case of longshore sediment transport, two data sets were employed. Bayram et al. (2001) discussed the Sandy Duck experiments carried out at the U.S. Army Corps of Engineers Field Research Facility in Duck, NC (for a summary of the field experiments, see Miller 1998, 1999). During these experiments, the cross-shore distribution of the time-averaged longshore current and sediment concentration were measured, from which the transport rate could be estimated for six cases from 1996 to 1998. Wang et al. (2002) performed four sets of experiments in a large wave basin (Large-scale Sediment Transport Facility - LSTF) at the Coastal and Hydraulics Laboratory, Vicksburg, MS. The longshore sediment transport rate was recorded on a sandy beach exposed to random waves breaking at an incident wave angle, in one experiment as plunging breakers and in the other as spilling breakers. In the LSTF experiments, the hydrodynamics and concentration profiles were recorded at many locations across the profile. The beach profiles for the spilling breaker case were similar to the plunging case apart from the shape of the offshore bar, which was less pronounced for the spilling breaker case, implying less intensive wave breaking (and energy dissipation) in this region. Table 41 presents the main hydrodynamic conditions together with the median grain size for five of the experimental cases from Sandy Duck and the LSTF employed here for validating the sediment transport model. The main difference between the cases in the LSTF experiment was the breaker type, whereas the initial bathymetry was the same. For the Sandy Duck experiments, the bathymetry varied between the cases, where a clear bar was observed during the early cases and a terrace-shaped beach for later cases.
Table 41. Experiment conditions for studied cases on longshore sediment transport.
| Case | Characteristics | (-) |
d50 (mm) |
Hw '(m)' |
Tw '(s)' |
'w '(deg) |
| LSTF Case 1 | Spilling breakers | 0.30 | 0.2 | 0.25 | 1.5 | 30 |
| LSTF Case 6 | Plunging breakers | 0.75 | 0.2 | 0.19 | 3.0 | 30 |
| Sandy Duck 12/03/96 | Barred beach | 0.20 | 0.20 | 3.1 | 13 | 5 |
| Sandy Duck 31/03/97 | Barred beach | 0.15 | 0.18 | 1.4 | 8 | 5 |
| Sandy Duck 04/02/98 | Terrace beach | 0.20 | 0.18 | 2.3 | 13 | 5 |
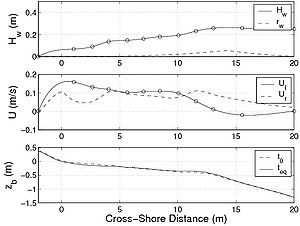
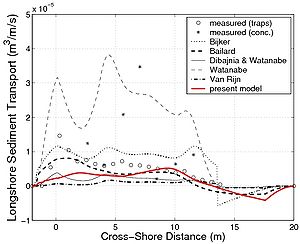
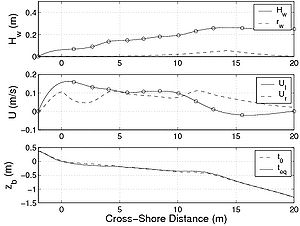
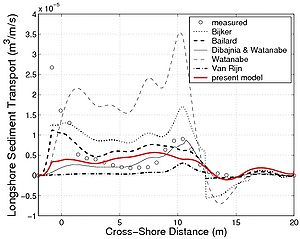
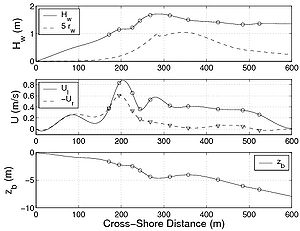
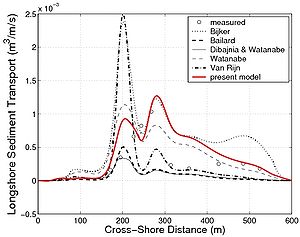
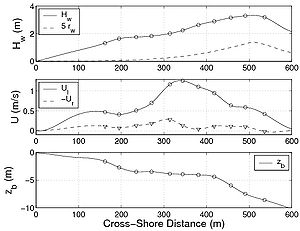
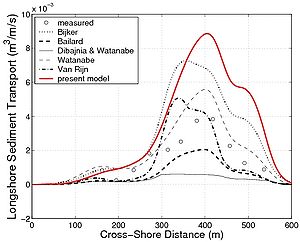
For these experiments, mainly the suspended load was estimated (the transport rate was derived from time-averaged sediment concentration and velocities). Furthermore, as the evolution of the wave asymmetry rw was not available, it was estimated using the formula by Dibajnia et al. (2001) (Figures 95(a), 96(a), 97(a) and 98(a); the first of the three plots in each figure). Similarly, for the LSTF data set, the cross-shore current (undertow) was not available, and it was estimated using the expression proposed by Svendsen (1984) (Figures 95(a), 96(a), 97(a), and 98(a); the second of the three plots in each figure). These calculations are a source of error in the estimation of the suspended load. The ripple characteristics were not measured, and they had to be estimated using a predictive formula. As previously discussed, this leads to large uncertainty in estimation of the Shields parameter. For the LSTF experiments, because it was performed at smaller scale, the Nielsen (1981) formulas were used, whereas for the Sandy Duck experiments the Van Rijn (1993) formulas were employed. To compare the proposed formula not only to the data, but also to other semi-empirical formulas, the calculation were carried out with the formulas by Bijker (1968), Bailard (1981), Van Rijn (1989), Watanabe and Isobe (1992), and Dibajnia and Watanabe (1992). These predictive formulas were chosen because they are widely used in depth-averaged models. It should be noted that the Bijker (1968), Bailard (1981), and Van Rijn (1989) formulas estimate the bed load and suspended load separately, whereas the Watanabe and Isobe (1992) formula and the Dibajnia and Watanabe (1992) formula estimate the total load. The Bailard (1981), Dibajnia and Watanabe (1992), and the present formula (Camenen and Larson 2007) take into account wave asymmetry on the total sediment transport, whereas the estimated transport rate from the measurements do not include this component. For the Dibajnia and Watanabe (1992) formula, the phase lag is taken into account, which again is not the case for the measurements. Thus, the formula taken to estimate the transport rates may introduce additional uncertainty affecting the comparison between these three formulas and the measurements. Figure 95 shows the result obtained for the LSTF experiment Case 1 presented (case with spilling breakers) for the longshore sediment transport. Apart from the Watanabe and Isobe (1992) formula, which largely overestimate the results, and the Van Rijn (1989) formula, which tends to underestimate the results, all studied formulas yields similar results that lie close to the observations. However, all formulas underestimate the sediment transport in the swash zone, which is a region not properly described by the formulas. The physical mechanisms for the longshore sediment transport in the swash zone is different compared to the surf zone, and other formulas are necessary to describe the sediment transport rates in this region. Figure 96 is the result obtained for the LSTF experimental Case 6 with plunging breakers. In the surf zone, most formulas tend to overestimate the transport rates although the location of the peak is well predicted. The Bailard (1981) formula and the present formula overall yield the correct magnitude, even if the peak of sediment transport in the zone of incipient breaking is underestimated and not as pronounced as in the measurements. Figures 97 and 98 are representative results obtained for the Sandy Duck experiments regarding the longshore sediment transport rate shown. The spread in calculations is larger than for the LSTF data because larger uncertainty exists in the measurements of the current profiles and especially in the estimation of the concentration profiles. It appears that the main difference between the formulas is the magnitude. If the present formula, the Bijker (1968) formula, and the Watanabe and Isobe (1992) formula tend to overestimate the suspended load, the Bailard formula and the Dibajnia and Watanabe (1992) formula tend to underestimate the rates. It appears that the Bijker (1968) and Van Rijn (1989) formulas are too sensitive to the current magnitude and tend to overestimate the sediment transport at the peak of the longshore current, even if the wave height is smaller than at the breaker line (Figure 97). Table 42 presents the statistical results for all the formulas and both data sets. The percentage of values obtained with an error less than factor 2 or 5 (designed as Px2 or Px5) as well as the mean value and the standard deviation of the function f(qss) = log (qss,pred/ qss,meas) are presented in the table. The Bailard (1981) formula gives the best results for the Sandy Duck data, but yields poorer results for the LSTF data. The Watanabe and Isobe (1992) formula yields good results for the Sandy Duck experiments, but poor agreement for the LSTF data. These two formulas as well as the Dibajnia and Watanabe (1992) formula seem to be sensitive to the scale of data collection. This is a result of the formulas not being functions of the total shear stress (which varies with the scale of the experiment), but only of the velocity profile (i.e., Dibajnia and Watanabe (1992) and Bailard 1981) formula) or are too simple to include all the parameters governing the bed load and suspended load (i.e., Watanabe and Isobe (1992) formula). For the cases studied here regarding longshore sediment transport, the Bijker (1968) and the present formula yield the overall best results. The Van Rijn (1989) formula generally underestimates the results and appears to be more sensitive to the steady current magnitude.
| (a) | |
| (b) |
Figure 95. Cross-shore variations in hydrodynamic parameters and beach profile for an LSTF experimental case (Test 1 - spilling breakers) together with (a) measured longshore suspended sediment transport, and (b) calculated transport using six studied formulas.
| (a) | |
| (b) |
Figure 96. Cross-shore variations in hydrodynamic parameters and beach profile for an LSTF experimental case (Test 6 - plunging breakers) together with (a) measured longshore suspended sediment transport, and (b) calculated transport using six studied formulas.
| (a) | |
| (b) |
Figure 97. Cross-shore variations in hydrodynamic parameters and beach profile for Sandy Duck experiment (31 March 1997) together with (a) measured longshore suspended sediment transport, and (b) calculated transport using six studied formulas.
| (a) | |
| (b) |
Figure 98. Cross-shore variations in hydrodynamic parameters and beach profile for Sandy Duck experiment (4 February 1998) together with (a) measured longshore suspended sediment transport, and (b) calculated transport using six studied formulas.
Table 42. Predictive capability of different transport formulas for longshore suspended load transport for LSTF and Sandy Duck experiments.
| Author(s) | Px'''2 (%) | Px'''5 (%) | Mean ('''f'''('''qss)) | Std ('''f'''('''qss)) |
| LSTF Data | ||||
| Bijker (1968) | 48 | 78 | 1.0 | 1.5 |
| Bailard (1981) | 60 | 77 | 0.35 | 1.7 |
| Van Rijn (1989) | 08 | 37 | -1.4 | 1.9 |
| Watanabe and Isobe (1992) | 11 | 60 | 1.4 | 1.3 |
| Dibajnia and Watanabe (1992) | 35 | 75 | -0.45 | 1.5 |
| Present formula | 55 | 75 | 0.10 | 1.7 |
| Sandy Duck Data | ||||
| Bijker (1968) | 33 | 85 | 0.8 | 0.5 |
| Bailard (1981) | 30 | 68 | -1.3 | 0.8 |
| Van Rijn (1989) | 20 | 56 | -1.3 | 1.1 |
| Watanabe and Isobe (1992) | 61 | 91 | 0.1 | 0.9 |
| Dibajnia and Watanabe (1992) | 17 | 64 | -1.4 | 0.6 |
| Present formula | 41 | 86 | 0.4 | 0.9 |
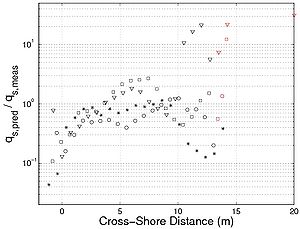
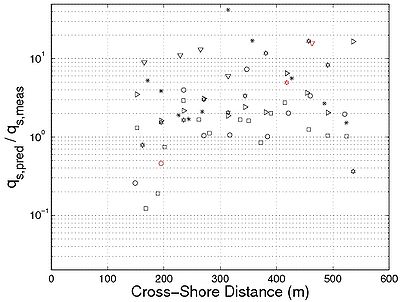
Figure 99 plots the predictive results of the longshore sediment transport rate across the beach profile for both experiments using the present formula. It confirms the underestimation in the swash zone observed for the LSTF data as well as a slight underestimation in the zone of incipient breaking. Because of a larger uncertainty in the measurements and calculations for the Sandy Duck data, a larger discrepancy is observed for these data. In general, the formula overestimates the transport rates, which may be due to an overestimation of the sediment diffusivity for waves at a large water depth, as previously pointed out.
Validation of cross-shore sediment transport
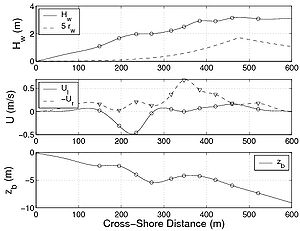
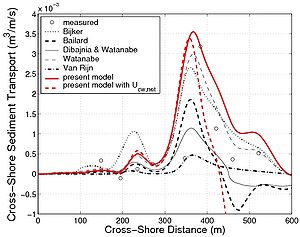
The cross-shore sediment transport rate could also be estimated for the Sandy Duck data. However, the sensitivity in the predictions by the formulas is much greater compared to the longshore transport rate. Figure 100 presents results obtained for one experimental case carried out on 12 March 1996. The Bijker (1968), Van Rijn (1989), and Watanabe and Isobe (1992) formulas induce a sediment transport that is in the same direction as the undertow, which means in the offshore direction. In contrast, the Bailard (1981), Dibajnia and Watanabe (1992) formulas, as well as the present formula, allows for transport in the opposite direction to the mean current if asymmetric waves are present. Thus, onshore sediment transport is often observed seaward of the surf zone. Because the transport rates derived from the measurements do not take into account the wave-induced sediment transport, it differs from the calculation results for the three latter formulas (for the other formulas, the estimated sediment transport rate is always in the direction of the mean current). The present formula appears to be sensitive to the balance between the undertow and wave asymmetry at the seaward end of the surf zone (compare results when Uc is used instead of Ucw,net for the suspended load; see Figure 100).
| (a) | (b) |
Figure 99. Predictive results for longshore sediment transport rate across beach profile using present formula for (a) LSTF data, and (b) Sandy Duck data.
Table 43 presents the statistical results for all the formulas compared regarding the Sandy Duck experiments on cross-shore transport. It appears for these cases that the predictive results are poorer than for the longshore sediment transport rate. The Watanabe and Isobe (1992) formula presents the best results, which is surprising because it was calibrated for longshore transport. However, as discussed previously, the measured suspended load includes transport by the mean current only, and other mechanisms are not included.
| (a) | |
| (b) |
Figure 100. Cross-shore variations in hydrodynamic parameters and beach profile for (a) Sandy Duck experimental case (12 March 1996) together with measured cross-shore suspended sediment transport, and (b) calculated transport using six studied formulas.
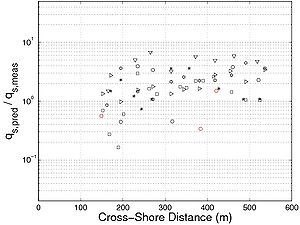
Figure 101 plots the prediction of the cross-shore sediment transport rate across the beach profile for the Sandy Duck experiments using the present formula with only the current-related suspended load included (Uc is used instead of Ucw,net). It confirms the general overestimation and dispersion previously observed for these data. If the wave-related sediment transport is included, the direction of the sediment transport is incorrectly estimated for several data points in the offshore. However, it may be a result of the formula including wave-related sediment transport, whereas the transport rates estimated from the measurements do not.
Table 43. Predictive capability of different transport formulas regarding suspended load transport in cross-shore direction for Sandy Duck experiments.
| Author(s) | Px'''2 (%) | Px'''5 (%) | Mean ('''f'''('''qss)) | Std ('''f'''('''qss)) |
| Bijker (1968) | 14 | 36 | 2.3 | 1.2 |
| Bailard (1981) | 23 | 50 | 0.05 | 1.6 |
| Van Rijn (1989) | 24 | 53 | 0.15 | 1.7 |
| Watanabe and Isobe (1992) | 47 | 68 | 0.8 | 1.0 |
| Dibajnia and Watanabe (1992) | 35 | 61 | 0.02 | 1.2 |
| Present formula | 33 | 65 | 1.1 | 1.1 |
An interesting data set was provided by Dohmen-Janssen and Hanes (2002). They measured bed load and suspended load transport in a large wave flume for sheet flow, and obtained results for the four cases presented in Table 44. Although a small undertow was present (opposite to the wave direction), the net sediment transport was directed onshore because of the asymmetric waves. The three formulas that assume the direction of the current to be the direction of the sediment transport (the Bijker (1968), Van Rijn (1989), and Watanabe and Isobe (1992) formulas) predict the wrong direction for the net total load. The Bailard (1981) formula predicts a correct direction for the sediment transport, but tends to overestimate the total load, especially the suspended load portion. Dohmen-Janssen and Hanes (2002) observed that, in case of sheet flow and nonbreaking waves, bed load was always dominant and only 10 percent of the total load was carried by the suspended load. The Bailard (1981) formula (as well as the Bijker (1968) formula) predicts that suspended load is dominant (qsb/qss = 0.11). The Dibajnia and Watanabe (1992) formula, as it was calibrated for sheet-flow conditions, yields good results. Finally, the present formula also yields good results, although it tends to overestimate the suspended load.
Figure 101. Comparison of cross-shore suspended load across profile line with present formula and Sandy Duck data.
Table 44. Predictive capability of total load sediment transport in cross-shore direction for sheet-flow experiments by Dohmen-Janssen and Hanes (2002).
| Author(s) | Px'''2 (%) | Px'''5 (%) | Mean ('''f'''('''qss)) | Std ('''f'''('''qss)) | qsb/'''qss |
| Bijker (1968) | 0* | 0* | -0.2 | 0.5 | 0.03 |
| Bailard (1981) | 0 | 0 | 2.4 | 0.07 | 0.11 |
| Van Rijn (1989) | 0 | 0* | -0.3 | 0.2 | 1.3 |
| Watanabe and Isobe (1992) | 0* | 0* | -0.4 | 0.4 | - |
| Dibajnia and Watanabe (1992) | 100 | 100 | -0.15 | 0.3 | - |
| Present Work | 75 | 100 | 0.5 | 0.3 | 0.4 |
| |||||
Comments on morphological evolution using total load formulas
Total load formulas (bed load and suspended load) are commonly used in numerical models of morphological evolution. Based on the predictions of the local transport at fixed grid points, the gradients are computed and the sediment volume conservation equation is employed to determine the change in bed elevation. This approach implies that the transport rate can be determined at a point without considering the conditions at neighboring points. Such a simplification might be applicable in many situations, although it depends on the hydrodynamic, sedimentologic, and topographic conditions. If there is strong coupling between neighboring points, which might be the case for finer sediment and larger waves, governing equations that take into account horizontal exchange of material should be applied. The advection-diffusion (AD) equation is often utilized to model the horizontal exchange processes. Typically, the vertical exchange of material is assumed to occur rapidly, so that a fixed vertical concentration profile can be employed in the AD equation. If not, the total load formulas discussed in this paper is not applicable, and three-dimensional transport equations for the sediment must be employed. With respect to the coastal inlet environment, experience has shown that several types of morphological behavior might be difficult to simulate without calculating with the AD equation.
| Chapter 4 - Suspended Load | Chapter 6 - Conclusions |


![{\displaystyle {\begin{aligned}&{{\theta }_{cw,onshore}}={\frac {1}{{T}_{wc}}}\int _{0}^{{T}_{wc}}{{\frac {1/2{{f}_{cw}}{{\left[{{u}_{w}}\left(t\right)+{{U}_{c}}{\text{cos}}\varphi \right]}^{2}}}{\left(s-1\right)g{{d}_{50}}}}dt}\\&{{\theta }_{cw,offshore}}=-{\frac {1}{{T}_{wt}}}\int _{{T}_{wc}}^{{T}_{w}}{{\frac {1/2{{f}_{cw}}{{\left[{{u}_{w}}\left(t\right)+{{U}_{c}}{\text{cos}}\varphi \right]}^{2}}}{\left(s-1\right)g{{d}_{50}}}}dt}\\\end{aligned}}}](https://en.wikipedia.org/api/rest_v1/media/math/render/svg/d8fc0c87c5ab338b5e195956172f469689b44d40)


![{\displaystyle {{\alpha }_{j}}={\frac {{{v}^{0.25}}U_{cw,j}^{0.5}}{{{W}_{s}}\ T_{j}^{0.75}}}\exp \left[-{{\left({\frac {{U}_{w,cr,sf}}{{U}_{cw,j}}}\right)}^{2}}\right]}](https://en.wikipedia.org/api/rest_v1/media/math/render/svg/269cb21dc9ac5c3a5e2fc01ee6189e217b03bd8c)
![{\displaystyle {\begin{aligned}&U_{cw,onshore}^{2}={\frac {1}{{T}_{wc}}}\int _{0}^{{T}_{wc}}{{{\left[{{u}_{w}}\left(t\right)+{{U}_{c}}{\text{cos}}\varphi \right]}^{2}}dt}\\&U_{cw,offshore}^{2}={\frac {1}{{T}_{wt}}}\int _{{T}_{wc}}^{{T}_{w}}{{{\left[{{u}_{w}}\left(t\right)+{{U}_{c}}{\text{cos}}\varphi \right]}^{2}}dt}\\\end{aligned}}}](https://en.wikipedia.org/api/rest_v1/media/math/render/svg/89df08e56653f52517f108ad66b91834eeabf32e)
![{\displaystyle \left\{{\begin{aligned}&{{q}_{ssw}}={{U}_{c,net}}\ {{c}_{R}}{\frac {\varepsilon }{{W}_{s}}}\left[1-\exp \left(-{\frac {{{W}_{s}}h}{\varepsilon }}\right)\right]\\&{{q}_{ssn}}={{U}_{c}}\sin \varphi \ {{c}_{R}}{\frac {\varepsilon }{{W}_{s}}}\left[1-\exp \left(-{\frac {{{W}_{s}}h}{\varepsilon }}\right)\right]\\\end{aligned}}\right.}](https://en.wikipedia.org/api/rest_v1/media/math/render/svg/053c531b934700c41d44877eed0cffe2e4c2a990)


![{\displaystyle {{d}_{*}}={\sqrt[{3}]{\left(s-1\right)g/{{v}^{2}}}}{{d}_{50}}}](https://en.wikipedia.org/api/rest_v1/media/math/render/svg/61f27ef2f7fe73bd2c62b26a0877140fa3089b08)



![{\displaystyle {\begin{aligned}&{{\alpha }_{1}}=0.28+0.11\tanh \left[6\left(dh/dx\right)-0.15\right]\\&{{\alpha }_{2}}=0.235+0.065\tanh \left[17\left(dh/dx-0.035\right)\right]\\&{{\alpha }_{3}}=0.1\tanh \left[10\left(dB/dx\right)\right]\\\end{aligned}}}](https://en.wikipedia.org/api/rest_v1/media/math/render/svg/bcdc6609d9cfb32db27b4bfdbd451a386c331105)
