Channel infilling under waves parallel to steady currents: Difference between revisions
(Created page with '== '''Setup''' == Normal 0 false false false MicrosoftInternetExplorer4 A laboratory experiment on the evolution of channel morphology under cro…') |
No edit summary |
||
| Line 1: | Line 1: | ||
== '''Setup''' == | == '''Setup''' == | ||
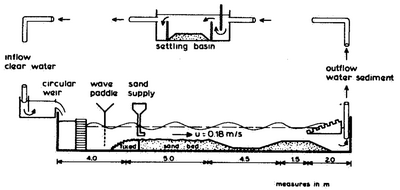
A laboratory experiment on the evolution of channel morphology under cross-channel flow with waves parallel to the channel axis was carried out in a wave-current flume by van Rijn (1986). The channel was approximately 4 m wide and 0.22 m deep, and had 1:10 side slopes (see Figure 1). The current speed at the inflow boundary was 0.245 m/s. Incident irregular waves (JONSWAP form) were parallel to the channel axis (90º with respect to the flow) and had a significant wave height of 0.105 m and peak wave period of 2.2 s. The initial bathymetric profile is shown in Figure 1. Manning’s coefficient n is calibrated as approximately 0.02 with the measured velocity profile. The bed slope coefficient is set to 2.0. The sediment median diameter is 0.1 mm. The transport grain size is set to, so that no hiding and exposure is considered. The sediment concentration at the inflow boundary is specified as the equilibrium concentration based on the Lund-CIRP transport equations. The total-load adaptation length calibrated as 0.75 m by comparing the calculated and measured morphology changes. | |||
[[Image:vanRijn_1986_Exp_Setup.png|thumb|left|400px| Figure 1. Experimental setup. ]] | |||
[[Image: | |||
<br style="clear:both" /> | <br style="clear:both" /> | ||
== '''Results''' == | == '''Results''' == | ||
Figure 1. The root-mean-squared error (RMSE) between measured and computed water depths is 0.01 m, which is less than 5% of the upstream flow depth. The relative-mean-absolute error (RMAE) is 2%. The model reproduces well the general trend of the morphology change including the upstream bank migration and downstream bank erosion. The small oscillations (on the order of 1 m in length) in the measured bathymetry are more likely to be large bed forms that cannot be simulated in the present model. | |||
[[Image: | [[Image:vanRijn_1986_Bed_Elevation.PNG|thumb|left|600px| Figure 2. Computed bed elevations and current velocities at t=4 hrs.]] | ||
<br style="clear:both" /> | <br style="clear:both" /> | ||
== '''References''' == | == '''References''' == | ||
van Rijn, L. C. (1986) “Sedimentation of dredged channels by currents and waves”, Journal of Waterway, Port, Coastal and Ocean Engineering, 112(5), 541-559. | |||
---- | ---- | ||
[[Test_Cases]] | [[Test_Cases]] | ||
Revision as of 19:37, 26 August 2010
Setup
A laboratory experiment on the evolution of channel morphology under cross-channel flow with waves parallel to the channel axis was carried out in a wave-current flume by van Rijn (1986). The channel was approximately 4 m wide and 0.22 m deep, and had 1:10 side slopes (see Figure 1). The current speed at the inflow boundary was 0.245 m/s. Incident irregular waves (JONSWAP form) were parallel to the channel axis (90º with respect to the flow) and had a significant wave height of 0.105 m and peak wave period of 2.2 s. The initial bathymetric profile is shown in Figure 1. Manning’s coefficient n is calibrated as approximately 0.02 with the measured velocity profile. The bed slope coefficient is set to 2.0. The sediment median diameter is 0.1 mm. The transport grain size is set to, so that no hiding and exposure is considered. The sediment concentration at the inflow boundary is specified as the equilibrium concentration based on the Lund-CIRP transport equations. The total-load adaptation length calibrated as 0.75 m by comparing the calculated and measured morphology changes.
Results
Figure 1. The root-mean-squared error (RMSE) between measured and computed water depths is 0.01 m, which is less than 5% of the upstream flow depth. The relative-mean-absolute error (RMAE) is 2%. The model reproduces well the general trend of the morphology change including the upstream bank migration and downstream bank erosion. The small oscillations (on the order of 1 m in length) in the measured bathymetry are more likely to be large bed forms that cannot be simulated in the present model.
References
van Rijn, L. C. (1986) “Sedimentation of dredged channels by currents and waves”, Journal of Waterway, Port, Coastal and Ocean Engineering, 112(5), 541-559.

