GenCade: Difference between revisions
| Line 74: | Line 74: | ||
=== Orientation and cell size === | === Orientation and cell size === | ||
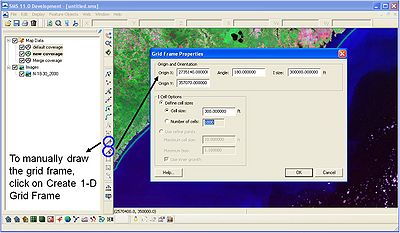
After merging the shoreline and regional contour into one coverage, the grid can be setup. If the user knows the what length grid to use, it is advisable to do this before adding any features to coverage. To manually draw the grid frame, click on the Create 2-D Grid Frame. The GenCade grid frame will be purple and have an arrow at one end. If a person was walking down the grid to the arrow, the water would be to the left and the land would be to the right. For example, if the GenCade grid arrow was pointing south, the water would be to the east (left) and the land would be to the west (right). The grid can be modified by clicking the Select 1-D Grid Frame and double-clicking on the square in the center of the purple grid line. The Grid Frame Properties window will open, and the Origin X, Origin Y, Angle, and I size can be modified (Figure 10). The I size is the length of the grid. The cell size can be constant or variable. If the user chooses to change the cell size under define cell sizes, the number of cells will change accordingly. | After merging the shoreline and regional contour into one coverage, the grid can be setup. If the user knows the what length grid to use, it is advisable to do this before adding any features to coverage. To manually draw the grid frame, click on the Create 2-D Grid Frame. The GenCade grid frame will be purple and have an arrow at one end. If a person was walking down the grid to the arrow, the water would be to the left and the land would be to the right. For example, if the GenCade grid arrow was pointing south, the water would be to the east (left) and the land would be to the west (right). The grid can be modified by clicking the Select 1-D Grid Frame and double-clicking on the square in the center of the purple grid line. The Grid Frame Properties window will open, and the Origin X, Origin Y, Angle, and I size can be modified (Figure 10). The I size is the length of the grid. The cell size can be constant or variable. If the user chooses to change the cell size under define cell sizes, the number of cells will change accordingly. | ||
[[Image:grid frame.jpg|400px|thumb|left|Figure 10. Grid frame properties]] | [[Image:grid frame.jpg|400px|thumb|left|Figure 10. Grid frame properties]] | ||
<br style="clear:both" /> | <br style="clear:both" /> | ||
Revision as of 20:45, 23 September 2010
GenCade
POCs: Ashley Frey <br\>Ashley.E.Frey@usace.army.mil <br\>601-634-2006 <br\>US Army Engineer Research and Development Center (ERDC) <br\>Coastal and Hydraulics Lab (CHL)
<br\>Nick Kraus <br\>Nicholas.C.Kraus@usace.army.mil <br\>601-634-2016 <br\>US Army Engineer Research and Development Center (ERDC) <br\>Coastal and Hydraulics Lab (CHL)
GenCade is a 1D model that combines GENESIS with Cascade. It is operated within the Surface-water Modeling System (SMS) interface. The first open release of GenCade is expected to occur in December 2010. A user guide, examples of simple cases, and applications will be posted here.
User Guide
Getting Started
This guide of GenCade was developed in September 2010. Most of the screenshots used in this guide were created with the July 29, 2010, build of the SMS. The August 25, 2010, build was used to create the screenshots for the Developing Alternatives and Time-dependent Wave Transmission sections. This guide refers to GenCade_v1_066.exe as the most recent executable. Developers are constantly upgrading the SMS and GenCade executables, so a future version may look slightly different from this user guide.
Setup GenCade in the SMS
GenCade is one model available in the SMS (Surface-water Modeling System) interface. To use GenCade, a working version of SMS 10.1 and executable for SMS 11.0 Development are necessary. The SMS 11.0 Development executable is copyrighted, so a registration code is necessary before using.
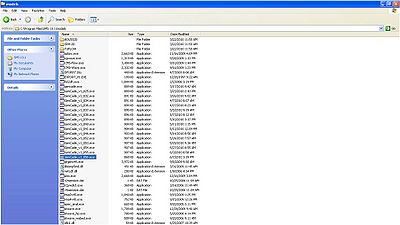
First, locate the GenCade executable on your machine. Drop the executable into the models folder under SMS 10.1 as shown in Figure 1.
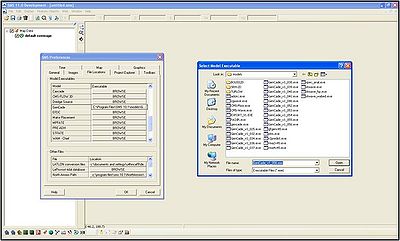
Once again, the capabilities of GenCade are only available in SMS 11.0 Development. If SMS 10.1 is already installed on the computer and a registration code for SMS 11.0 Development has been obtained, simply drag the SMS 11.0 executable into the SMS 10.1 folder (most likely in Program Files). Double-click on the SMS 11.0 executable to open SMS 11.0 Development. At this time, a prompt will open asking for the registration code. Before beginning to work in GenCade, go to Edit->Preferences. Select the tab File Locations and scroll down to GenCade under Model Executables. Click the button under Executable located directly to the right of GenCade. If GenCade has not been used previously, the button will most likely say BROWSE. After selecting this button, find the latest GenCade executable on the computer and select. The row to the right will specify the location of the executable which will be used to run GenCade (Figure 2).
Set the current projection
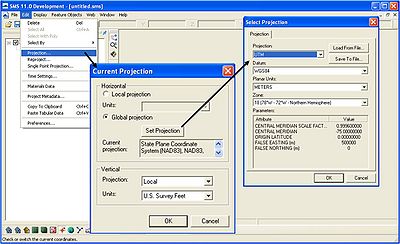
GenCade uses a real world coordinate system, so it is necessary to set up the current projection upon opening the SMS. Aerial photos, shorelines, and other georeferenced files can be opened in the SMS. Go to Edit->Projection and define the current projection (Figure 3). This will ensure all shorelines, structures, wave gages, and other important features are mapped correctly.
Reproject current projection
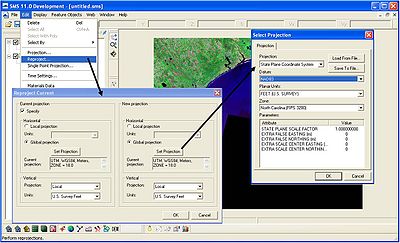
In some cases, the shorelines and the aerial photo may be in different coordinate systems. To change the projection, go to Edit->Reproject. A new window will open where the current projection and new projection can be specified (Figure 4).
Preparing Input Files
Initial shoreline
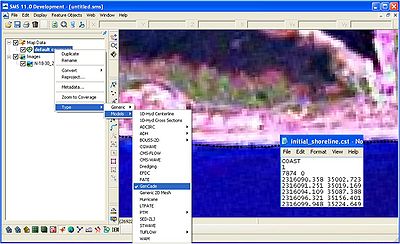
Before dragging a file into the SMS interface, right click on default coverage under Map Data in the left panel. Select Type->Models->GenCade. To bring in a shoreline or regional contour as a *.cst, the original text file must be modified. See Figure 5 for the required format. The first number in the third row represents the number of points in the file. The other numbers in the first three rows will remain the same.
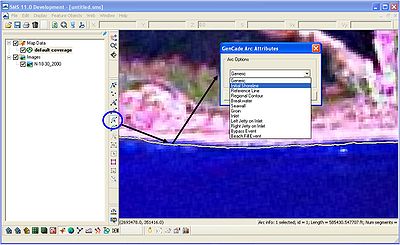
Once the shoreline is represented in the interface, click the Select Feature Arc button and double-click on the shoreline. The GenCade Arc Attributes will open. Select Initial Shoreline and click OK (Figure 6). Now the shoreline is defined.
Regional contour or additional shorelines
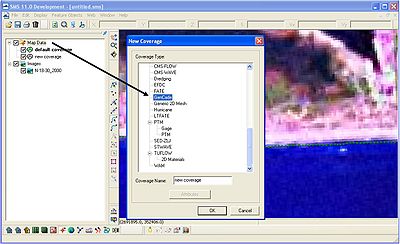
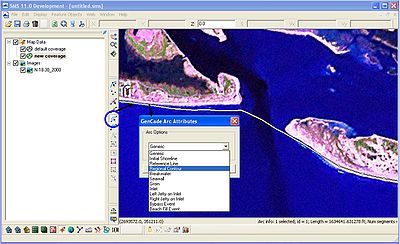
In some cases, it may be necessary to include a regional contour or additional shorelines. Right-click on Map Data and select New Coverage. A window will open; scroll down and select GenCade as the coverage type (Figure 7). Open the regional contour in the interface, and click on the Select Feature Arc button. After double-clicking on the regional contour, select Regional Contour as the Arc Option in the GenCade Arc Attributes window (Figure 8). Additional shorelines can be added in a similar fashion.
Merge coverages
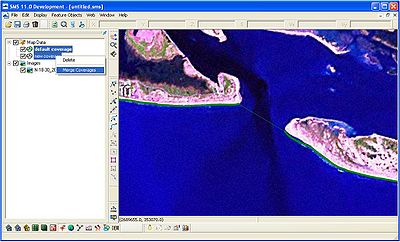
After the initial shoreline and regional contour have been loaded and defined in the SMS interface, it is necessary to merge the two lines in a single coverage. All structures, inlets, wave gages, and other features will be created in this single coverage. Highlight both the default coverage (initial shoreline) and the new coverage (regional contour). Right-click and select Merge Coverages (Figure 9). A window will open asking "Do you want to delete the coverages used to make the merged coverage?" By selecting no, the initial shoreline and regional contour will remain in the interface and if a problem occurs, these coverages can be merged again. It may be necessary to redefine the shoreline and regional contour in this new coverage.
Grid Setup
Orientation and cell size
After merging the shoreline and regional contour into one coverage, the grid can be setup. If the user knows the what length grid to use, it is advisable to do this before adding any features to coverage. To manually draw the grid frame, click on the Create 2-D Grid Frame. The GenCade grid frame will be purple and have an arrow at one end. If a person was walking down the grid to the arrow, the water would be to the left and the land would be to the right. For example, if the GenCade grid arrow was pointing south, the water would be to the east (left) and the land would be to the west (right). The grid can be modified by clicking the Select 1-D Grid Frame and double-clicking on the square in the center of the purple grid line. The Grid Frame Properties window will open, and the Origin X, Origin Y, Angle, and I size can be modified (Figure 10). The I size is the length of the grid. The cell size can be constant or variable. If the user chooses to change the cell size under define cell sizes, the number of cells will change accordingly.
