Nested Idealized Inlet: Difference between revisions
Jump to navigation
Jump to search
| Line 11: | Line 11: | ||
levels at the green point shown in the figure above. | levels at the green point shown in the figure above. | ||
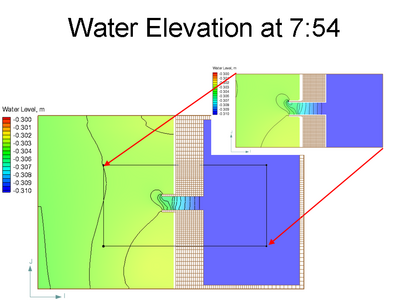
[[Image:Nested_wse_comp.PNG|thumb|left| | [[Image:Nested_wse_comp.PNG|thumb|left|400px|Results | alt=Results]] | ||
<br style="clear:both" /> | <br style="clear:both" /> | ||
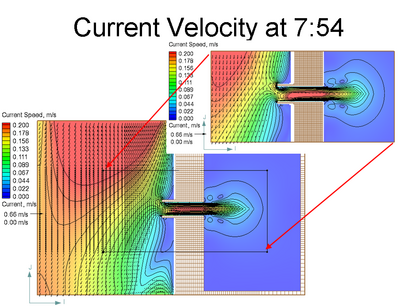
[[Image:Nested_velocity_comp.PNG|thumb|left| | [[Image:Nested_velocity_comp.PNG|thumb|left|400px|Results | alt=Results]] | ||
<br style="clear:both" /> | <br style="clear:both" /> | ||
---- | ---- | ||
[[Test_Cases]] | [[Test_Cases]] | ||
Latest revision as of 20:19, 12 May 2010
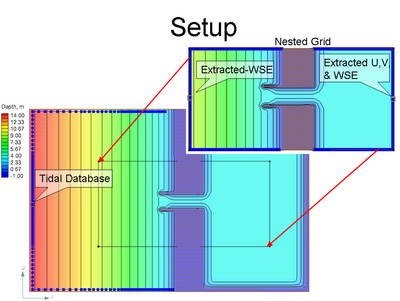
Setup
Results
The figure below shows a time series of water
levels at the green point shown in the figure above.


