Onslow Bay, NC, Lessons Learned
The Onslow Bay project began in 2009 in conjunction with the development of the very first draft code of GenCade. The project itself was the first application of GenCade and has served over the years as the go-to case to test any new features or capabilities with real-life scenarios. The Onslow Bay area has proven to be a very difficult area to model and in that sense has provided the GenCade development team an opportunity to test any changes to the code. This case has helped make GenCade more robust. The project was completed in July 2012, a few months after the official release of GenCade V1. This article will highlight the lessons learned and aspects of the project that were not discussed in the official documentation. The project was discussed in this CHETN and further detailed in this Journal article (not yet published). In addition the final presentation prepared for the Wilmington District provides more figures and hypothetical scenarios.
Background
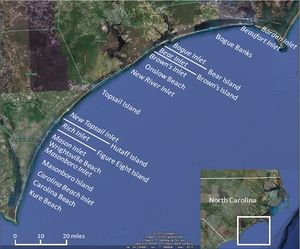
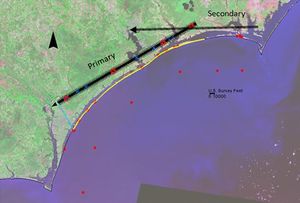
Onslow Bay in North Carolina, is a crescentic series of barrier islands covering more than 100 miles of beaches between Cape Lookout and Cape Fear (Figure 1). The curvature of the Bay is very pronounced resembling a quarter circle; the curvature was one of the first obstacles encountered during the setup of the model and is further discussed in the Multiple Grids chapter.
The narrow barrier islands are separated by 11 inlets, most of which are unstructured and migrating. The first step of the study was to conduct a literature review of the area; the process is further described in the Bookkeeping and Data Management chapter.
Of the 11 inlets, only Beaufort and Masonboro Inlets are structured. Beaufort Inlet, in northern Onslow Bay, is a large federally maintained deep draft channel supplying Morehead City Harbor. Because the area is well studied and politically sensitive, it has required special attention during the calibration process which will be further detailed in the Beaufort Inlet section.
The southern portion of the bay also had its fair share of challenges mostly due to the variation in the bottom geology. The strategy to overcome this issue is described in the Underlying Geology section.
Bookkeeping and Data Management
Before starting a GenCade project, it is essential that the modeler possesses a general feel for the transport direction and magnitude over the area and also a general knowledge of the data available (shorelines, engineering activities, etc). The first task was to look for existing transport studies and to hunt for repertories of beach nourishment and dredging activities. Although some areas were well studied and documented such as Bogue Banks to the north and Wrightsville Beach and Carolina Beach to the south, little was known for most of the central portion of the bay. To facilitate the bookkeeping of the data, it was decided to divide the project into three areas, the north, the central and the south portions. Once this was done, it became more manageable to research and document the data available.
Shorelines, wave data, berm height, and grain size are usually easy to find. However beach nourishment and dredging activities require special attention. It is recommended to keep an inventory of the engineering activities for the simulation period organized in a spreadsheet. For beach fills, column for dates, location and volume/width placement will be needed. Always list the reference next to the data. List all structures such as groins, seawalls, etc., with their characteristics including the date of construction. A separate tab should be dedicated to the inlets. Inventory dredging activities for each inlet with date and volume as well as the morphological feature dredged (ebb shoal, bypassing bars, etc.). If many inlets are present in the domain, it can be useful to have all the known and unknown information regarding the shoals volume listed (equilibrium and initial). Lastly during the literature process, it is useful to keep a summary of the key points of a particular report. Information such as estimated bypassing rate, observed erosion/accretion rate, transport direction/rate, inlet migration, and ebb shoal volume should be logged in a document (with references). During the validation of results, it is very convenient to have all of the information in one place. A well organized dataset will facilitate the work of teammates that might come in later on the project, minimize the risk of omitting important aspects, and make documentation much easier.
Multiple Grids
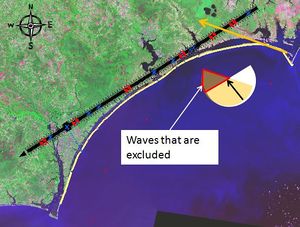
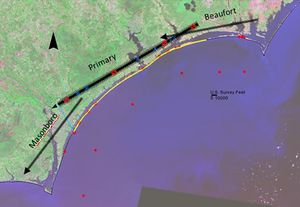
It became evident early on in the project that the large curvature of the bay would make modeling the entire domain with a single grid a challenge. One issue comes from the fact that internally the wave direction used by the GenCade executable must be in the shore-normal convention. The conversion from meteorological convention to shore-normal is made by the interface. Because of the large variation in shoreline orientation, the grid azimuth is used to provide the baseline to perform the conversion. After conversion, the waves really are oriented “grid-normal” and any waves exceeding +/-90 degrees are not considered. When using a single grid oriented NE-SW for the entire Bay, the angle between the grid and the shoreline can become up to 40 degrees at the extremities (Figure 2). This means that waves coming in a certain angle are not considered which affect the transport direction. Test runs made with a single grid produced unrealistic transport direction because the waves coming from the west that would be impacting the northern portion of the bay were omitted. However the biggest issue was the instabilities arising from having waves coming at the steep angle with the shoreline at the northern extremities.
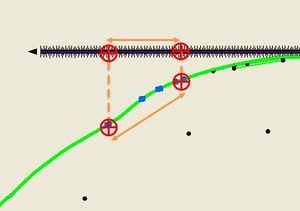
Another issue is how skewed the longshore distances become. In the process of making a GenCade grid, feature such as inlets, beach fills and structures will be translated from their real world location to the GenCade 1D grid system by moving them following a perpendicular line to the grid. When the grid does not follow the shoreline orientation, the distance between objects appears closer on the grid (Figure 3). For example the distance between Bogue and New River Inlets would be 2.3 miles shorter on a horizontal grid than in reality.
To remedy this problem, it was decided to create two or more smaller grids so that the orientation of the grid is closer to the one of the shoreline. Several configurations were tested, always making sure the grids overlapped for at least one inlet and over one wave gauge. It was found that the longshore transport calculated for each grid would be slightly different in the overlapped area. The transport would show the same pattern but would be either smaller or larger from one grid to another. The more the shoreline deviated from the grid at the extremities, the greater the shift between the results obtained with the two grids. Two grids created too much deviation at the extremities, so it was decided to use three grids.
Beaufort Inlet
Although almost 1 million cubic yards of material are annually dredged from Beaufort Inlet, it is only stabilized by a small terminal groin built on the west side of the inlet. Following the deepening of the channel in 1994, complaints from residents and communities on the west side of the inlet surged which eventually lead to a Section 111 study.
Critical use of the regional contour
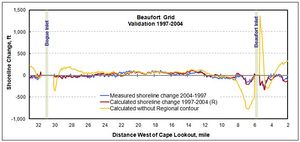
Thanks to several studies that were undertaken over the years, there is a good understanding of the sand movement around the inlet. Average net transport on Bogue Banks (west side of Beaufort Inlet) and transport on Shackelford Banks (east side of Beaufort Inlet) is locally directed toward the inlet. This condition is created by the natural alignment of the barrier island surrounding the inlet (Figures 1 and 6). It was essential that the model captures this elbow shaped shoreline to properly calculate transport direction and magnitude. For this particular case, the regional contour is a valuable tool. Without the regional contour the shoreline change near Beaufort Inlet is unrealistically large (-800 to +1300ft in 7 years). The same simulation with the regional contour turned on produced results similar to the observed shoreline change. This area was a great example to show how critical the use of the regional contour is for shorelines that are not perfectly straight.
Use of external wave model over complex bathymetry
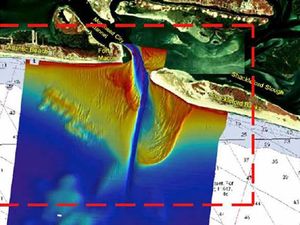
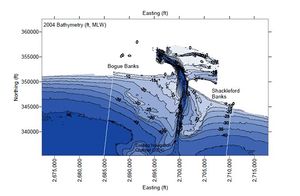
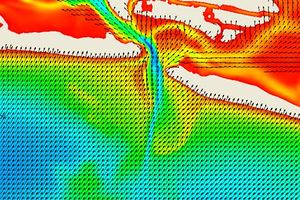
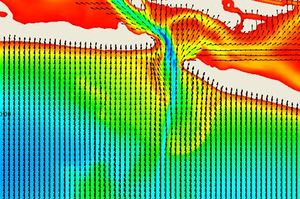
One of the basic assumptions of one-line models like GenCade is that the beach profile moves parallel to itself. In GenCade the offshore contour used for the calculation of the wave transformation is a smoothed version of the shoreline. However in certain area such as near inlets, the offshore contour is not parallel to the shoreline. Beaufort Inlet has a very large ebb shoal complex that totals near 37 million cubic yards of material (Figures 6 a and b). In the early stages of the project, there was concern that the internal wave model of GenCade might not be adequate for the complex bathymetry at Beaufort Inlet. It was decided to compare the GenCade results obtained with an external wave model.
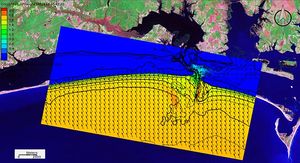
CMS-Wave was used to calculate the wave transformation over the shoal complex. Then, wave characteristics were extracted at nearshore locations to use as input in GenCade. The CMS grid was very large and it was difficult to run the model for a very long simulation period. Therefore, it was decided to run the external wave model for a year that would be representative of the 20 year simulation period. Net and gross transport of all 20 years between 1980 and 1999 were plotted against the 20 year average. The 1983 year was very similar to the 20 year average and was chosen to be used for the CMS-Wave simulation.
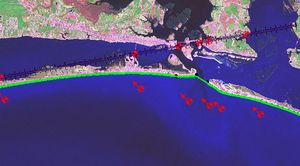
The CMS-Wave grid was constructed using the 2004 survey and covers the area around Beaufort Inlet (Figure 7). Two WIS stations (274 and 276) were used as forcing and run for an entire year. At the end of the simulation, two sets of six wave gauges were extracted, one set following the 15ft contour and the other the 30ft (Figure 8). The six wave gauges around Beaufort Inlet and one WIS station located near Bogue Inlet were used as forcing for a GenCade simulation.
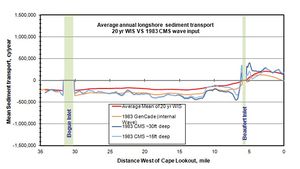
It was found that the use of the external wave model provides more detail on the transport magnitude near the inlet. In general, the transport within one mile of the inlet increased and is still directed toward the inlet on both sides (Figure 9). Although the results obtained with the external wave model resemble the one calculated with the internal waves it can provide valuable insight to the project. However, because external wave models are more computationally complex, their use is limited to a smaller simulation period. In the context of a regional scale and multi-decadal project like Onslow Bay, it was decided to use the internal model.
Underlying Geology
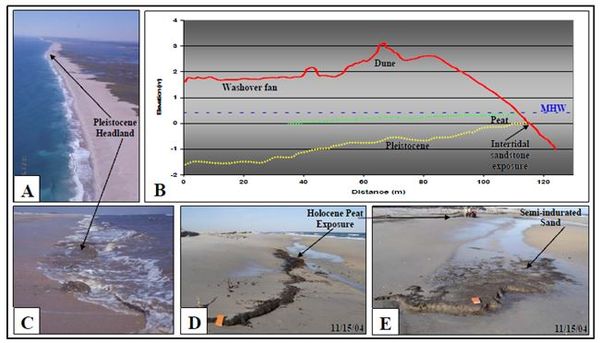
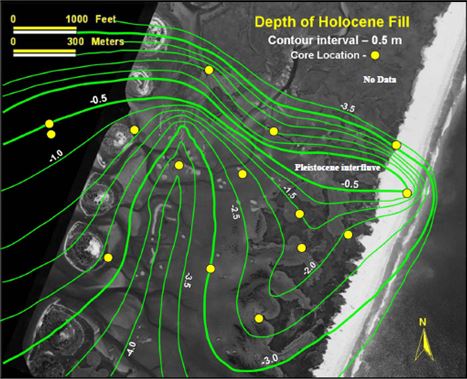
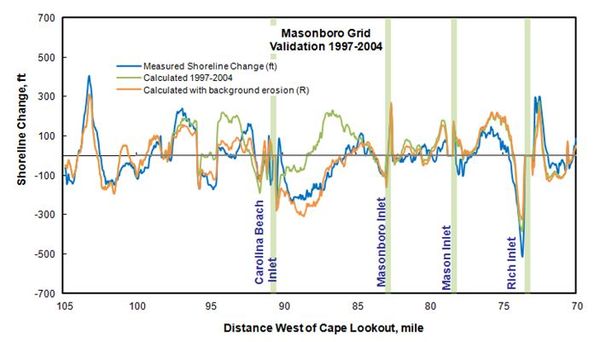
Another basic assumption of the on-line model like GenCade is that the bottom is made of smooth uniform offshore contours and consists of uniform sand. In reality it is not always the case. During the calibration process, the calculated shoreline between Carolina Beach and Masonboro Inlet always showed accretion while in reality it was severely eroding (Figure 13). Further review of the literature indicates that the underlying geology might play a role in the erosion pattern of the area. A study performed by Doughty (2006) identifies several potential reasons that might contribute to the measured erosion. He argues that the major contribution comes from the modification of the neighboring inlets namely the opening and dredging of Carolina Beach Inlet and the construction of the Masonboro jetties. However, including dredging events and the Masonboro jetties in the model was not sufficient to account for all the sand lost. Doughty (2006) also states the presence of a small Pleistocene headland underlying the beach (Figure 11). Large hurricanes in the early 90’s exposed the headland and created a small erosion resistant protuberance onto the shoreline (Figure 12 A and C). The rocky protuberance might have locally disturbed the wave field and limited the quantity of sand available for transport. In addition to the exposed rock bottom, peat and organic deposits are also exposed on the southern portion of the island (Figure 12 D and E). Doughty (2006) also describe how the dunes south of the headland are lower in elevation. Major storms impacted the island in the 50’s and 60’s and effectively lowered the barrier island making it susceptible to overwash. Large volumes of sand have been transported into the estuary during the active hurricane period of the 90’s. The combine effect of the underlying headland, the reduced availability of sand and the large overwash episodes contributed to the sand volume deficit.
There is not a direct way to include the effect of cross-shore processes and geology in GenCade. However it is possible to account for it by applying a background erosion rate. Over the southern half of Masonboro Island a background erosion rate of -115 m3/hr was applied. Including this erosion rate greatly improved the 2004 calculated shoreline for the secondary-west grid.
