Sudden Expansion: Difference between revisions
(→Setup) |
|||
| Line 22: | Line 22: | ||
== Model Setup == | == Model Setup == | ||
[[Image:Sudden_Expansion_Grid_V2.png|thumb|right|600px| Figure 1. Computational grid.]] | [[Image:Sudden_Expansion_Grid_V2.png|thumb|right|600px| Figure 1. Computational grid.]] | ||
The computational domain is | The computational domain is 18 m long and 1.2 m wide and has a constant grid resolution of 0.1 m. A flux boundary condition is specified at the inflow boundary and a constant water level boundary condition is applied to the downstream boundary. An adaptive time between 0.1-10 seconds is applied. | ||
<br style="clear:both" /> | <br style="clear:both" /> | ||
Revision as of 15:31, 15 December 2010
UNDER CONSTRUCTION
Experimental Setup
The flume experiment consisted of a rectangular section with a sudden expansion. The experiment parameters are shown in Table 1.
Table 1. General Settings for Flow over a Bump
| Parameter | Value |
| Discharge | x m^3/s |
| Downstream water level | x m |
| Bottom friction | 0.02 |
Model Setup
The computational domain is 18 m long and 1.2 m wide and has a constant grid resolution of 0.1 m. A flux boundary condition is specified at the inflow boundary and a constant water level boundary condition is applied to the downstream boundary. An adaptive time between 0.1-10 seconds is applied.
Results
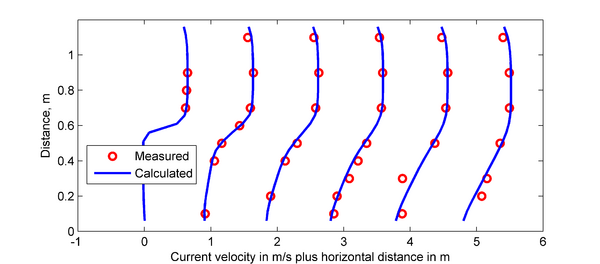
A comparison between the analytical solution for water levels is compared to the calculated water levels in Figure 2. As shown in the goodness of fit statistics, the model results agree well with the analytical solution. The minimum water level is captured well, however there is a small shift in the location of the water level drop over the bump toward the downstream direction.
Table 2. Goodness of fit statistics for the water elevation
| Statistic | Value |
| RMSE | 0.0074 m |
| RMAE | 0.0068 m |
| R^2 | 0.991 |
| Bias | 0.0017 m |
References
- Caleffi, V., Valiani, A., and Zanni, A. (2003). "Finite volume method for simulating extreme flood events in naturalchannels," Journal of Hydraulic Research, 41(2), 167-177.

