Field Experiment Wave Validation Case 1
Matagorda Bay
Matagorda Bay is located on the north-central coast of Texas. The surface area of the bay is approximately 930 km2 with the depth between 2 to 4 m. The tidal prism of the bay is large because of the large bay surface area, despite having a modest tidal range of about 0.33 m in the bay. The bay is separated from the Gulf of Mexico by Matagorda Island and Matagorda Peninsula. Freshwater discharge, which originates mainly from the Colorado River and the Lavaca River, is less than 10 percent of the daily tidal exchange through the two inlets with Gulf of Mexico. Local wind is the dominant forcing for wave generation in the bay (Kraus et al. 2006).
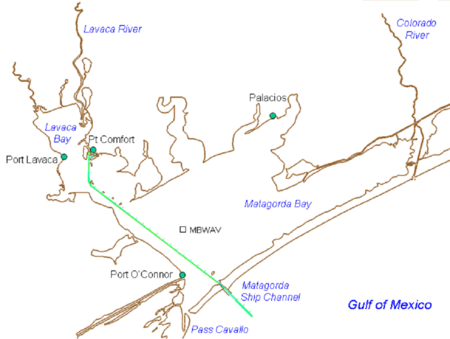
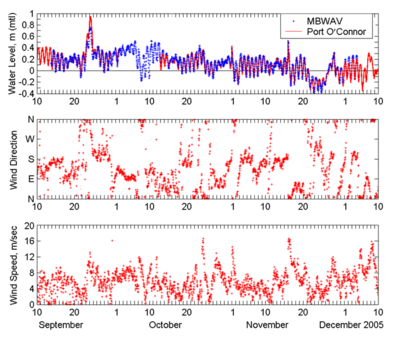
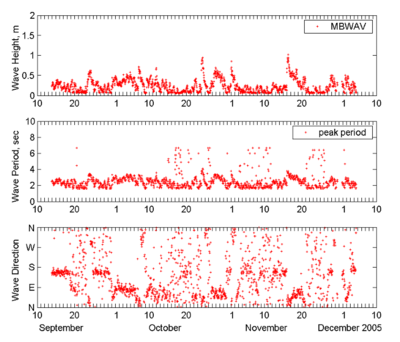
Directional wave and water level data were collected by a bottom-mounted Acoustic Doppler Profiler (ADP) in 3.8 m of water for September to December 2005, at a middle bay location. The coordinates of this wave measurement station, MBWAV, are 28°31.285'N, 96°24.423'W. Local wind and tide data are available from NOAA sta 87737011 at Port O'Connor (28°26.8'N, 96°23.8'W) in the southwest corner of the bay. Figure 1 shows the wind, tide, and wave data-collection locations. Figures 2 and 3 show the hourly wind, tide, and wave data collected in September-December 2005. Water level data collected from MBWAV and Port O'Connor show that the spatial variation of water level in the bay can be significant under the passage of a front system and strong wind.
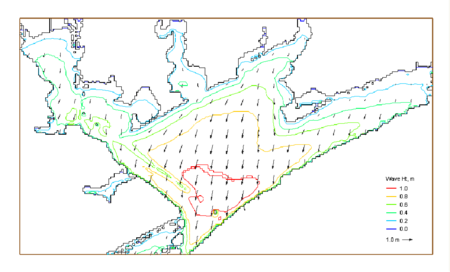
Waves generated by the wind are overall small to moderate in the middle of the bay during the data-collection period. Four large-wave events of interest observed in the data were produced by relatively strong wind, greater than 10 m/sec. Large waves were generated on 24 September 2005 under the strong wind of Hurricane Rita. The other three large wave events that occurred on 24 October, 1 November, and 15 November 2005, were produced by cold fronts. These large waves were generated by a wind directed between north and north-northeast. CMS-Wave simulations were performed for these events on a rectangular domain covering the entire bay (Figure 1). The numerical grid consisted of 128 223 cells with cell size of 300 m 300 m. Wave generation and propagation were computed on a spectral grid of 30 frequency bins (0.167 to 0.4 Hz with 0.008-Hz increment) and 35 direction bins (covering a half-plane with 5 deg spacing). Measured wind and tidal elevation were input to the model, and a constant bottom friction coefficient (cf) of 0.005 was specified. Figure 82 shows an example of the wave field generated for 24 October 2005. Table 1 presents measured and calculated significant wave height, spectral peak period, and mean wave direction for the four large-wave events simulated. Calculated waves agree well with the measurements. The calculated spectral peak wave period is slightly underestimated, probably because the model does not calculate the nonlinear wave energy transfer that is more pronounced in shallow water than in deep water.
| Date | Time (GMT) | Wind Speed (m/sec) / Wind Direction (deg) |
Depth, mtl (m) | Measured Wave ht (m) / Period (sec) / Direction (deg) |
Calculated Wave ht (m) / Period (sec ) / Direction (deg) |
| 9/24/2005 | 03:00 | 10.5 / 5 | 3.95 | 0.62 / 3.2/ 15 | 0.67 / 2.9 / 10 |
| 10/24/2005 | 08:00 | 15.5 / 10 | 3.95 | 0.95 / 4.0/ 25 | 0.97 / 3.1 / 15 |
| 11/1/2005 | 02:00 | 14.0 / 10 | 3.85 | 0.85 / 3.4/ 20 | 0.88 / 3.1 / 15 |
| 11/16/2005 | 09:00 | 16.5 / 15 | 3.85 | 1.02 / 3.6/ 20 | 1.01 / 3.1 / 20 |
Table 1. Comparison of measured and calculated waves at MBWAV.


