Galveston
written by Rob Thomas, Research Hydraulic Engineer, Coastal and Hydraulics Laboratory
Physical Setting and Description
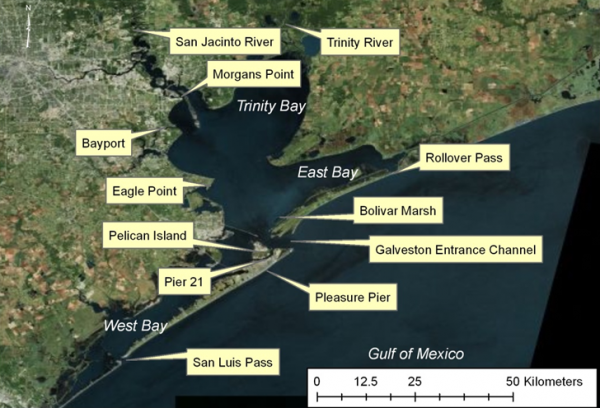
CMS was applied to model circulation in Galveston Bay, Texas. Measured data, described below, was compared to model results to calibrate and verify the model. Circulation in Galveston Bay is heavily dependent on wind forcing, providing an opportunity to test the capability of CMS to simulate these conditions. Galveston Bay is located on the upper Texas coast adjacent the Houston metroplex with 3 inlets to the Gulf of Mexico (Figure 1) and a federal deep draft navigation channel from the Galveston Entrance Channel to the Port of Houston in the upper bay. There are numerous tide and meteorological stations across the bay, providing data for model forcing and verification.
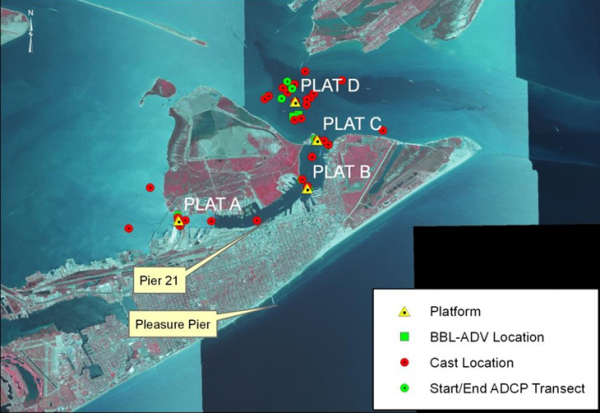
Hydrodynamic data were collected near the Galveston Entrance Channel in 2010 over two time periods; the first was February – March, the second was in late June.
Figure 2 shows data collection stations for the February – March time period (described in URS 2010). Measurements at platforms A – D included currents, waves, and turbidity (calibrated to measure total suspended solids). Additional data measured included passing vessel wake, sediment erodibility, cross-channel ADCP transects, sidescan and mulitbeam surveys, and other point measurements of hydrodynamics and sediments.
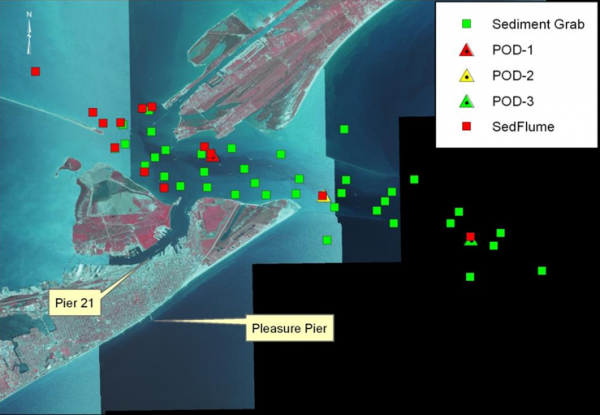
Data collection stations for the June deployments are shown in Figure 3. ADCP’s capable of measuring currents and waves were deployed on in-strument pods (labeled pod 1 – 3). Complications during data collection caused the loss of both pod 1 and 2, therefore only pod 3 data are available for model verification. Additional data collected included sediment erodibility, cross-channel ADCP transects, mulitbeam surveys, and point measurements of suspended sediment concentration and surficial bottom grain size distribution. Data applied during this modeling effort are located at the Navigation Gateway (http://operations.usace.army.mil/nav/mcnp.cfm?Option=Main).
Model Setup
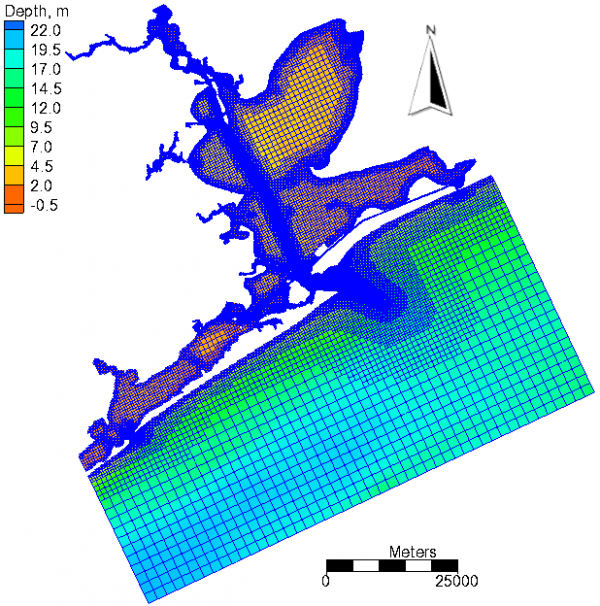
The computational grid and bathymetry for CMS-Flow is shown in Figure 4. The grid has 121,581 cells with variable resolution from 30 to 1,920 m. A list of basic model setup parameters are shown in Table 1. The implicit code was used for this study. Spatially constant water level measured at Pleasure Pier was applied on the ocean boundary. Temporally varying and spatially constant wind forcing, measured at Eagle Point, was applied. Comparison of winds at Eagle Point, Pleasure Pier, and Morgan’s Point was conducted for the modeled time periods to verify this assumption. A wall boundary condition was used at all boundaries inside the bay. The Manning’s coefficient was the only parameter varied for calibration in this study. Freshwater inflow from the two rivers was neglected, because both time periods investigated coincided with low river flows.
Table 1. CMS-Flow general model parameter settings.
| Parameter | Value |
| Hydrodynamic timestep | 360 s |
| Simulation duration | 83, 576 hr |
| Ramp period | 0.25 day |
| Manning's coefficient | 0.015 1/s^(1/3) |
Results and Discussion
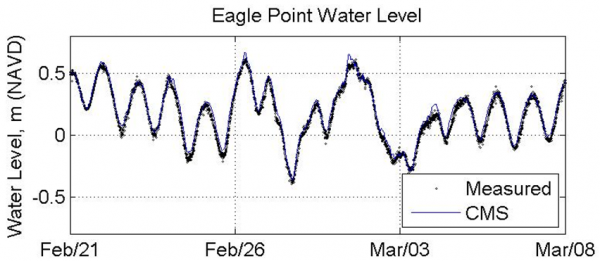
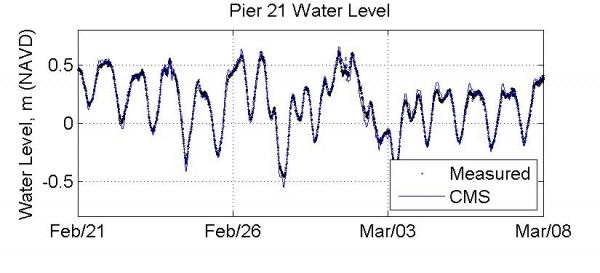
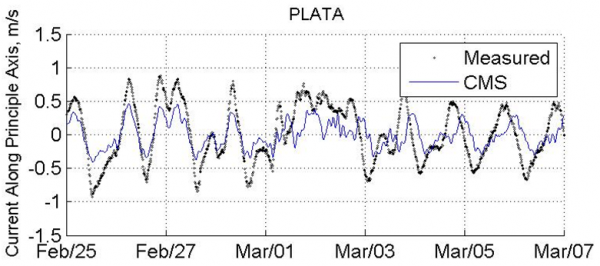
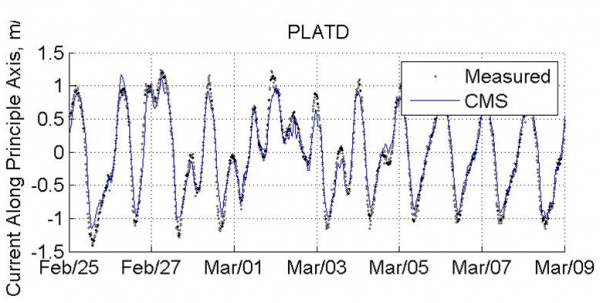
Comparison between measured and calculated water level and currents are presented for model validation at Galveston Bay, Texas. Four goodness of fit statistics are used to assess the model performance. Results were analyzed in Matlab and SMS. Calibration Results (Feb. – Mar. 2010) CMS was calibrated over a period of about 2 weeks between February – March 2010 using data previously described. Calibration was achieved by varying Manning’s n until error between model results and measurements was minimized (n=0.015 s/m1/3 was the best fit). Figures 5 and 6 compare NOAA measured and CMS water level at Eagle Point and pier 21, respectively. Figures 7 – 8 plot measured and modeled currents along the principle axis at two selected data collection platforms (location shown in Figure 2). Statistics representing goodness of fit for currents at the data collection platforms and water level at Pier 21 and Eagle Point are listed in Table 2. Overall, the model represents circulation very well, as shown, except for currents between Galveston and Pelican Islands.
The flow direction was well captured in the entrance channel, but less so in the channel between the islands. Some of measurements in Galveston channel showed the presence of two principle components while the computed velocities showed only one principle component indicating complex local flow patterns due to local topography. Errors in current direction are usually associated with errors in the bathymetry and lack of grid resolution. In the Galveston channel, the bathymetry is complicated by the shape of the berthing facilities and the presence of large vessels.
Table 2. Goodness-of-fit statistics for currents and water level for calibration.
| Station | NRMSE, % | NMAE, % | R | Bias |
| PLAT A | 36 | 30 | 0.63 | -0.01 m/s |
| PLAT B | 39 | 28 | 0.45 | 0.01 m/s |
| PLAT C | 39 | 32 | 0.26 | 0.01 m/s |
| PLAT D | 7 | 5 | 0.98 | 0.00 m/s |
| Eagle Point | 4 | 3 | 0.99 | 0.03 m |
| Pier 21 | 3 | 3 | 0.99 | 0.00 m |
Validation Results (June 2010)
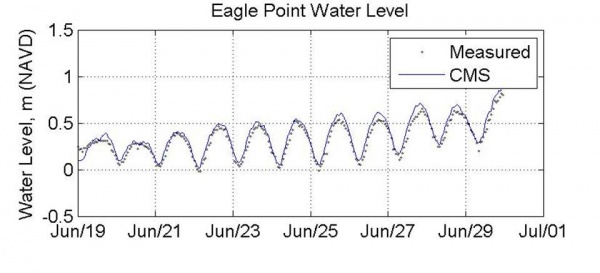
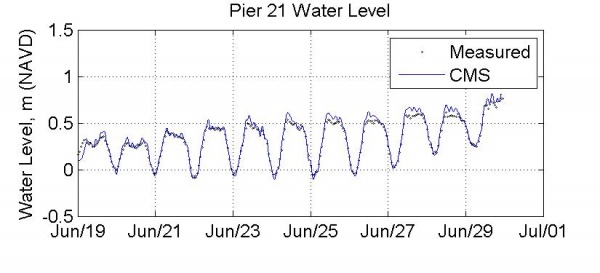
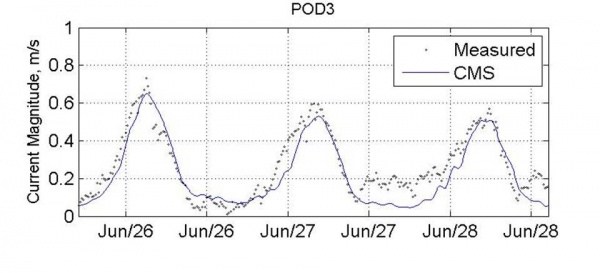
Measurements in June, 2010 were used for validation. Figures 9 and 10 show measured and modeled water level at Eagle Point and Pier 21, respectively. Measured current speed at pod 3 was compared to model results in Figure 11, showing good agreement. Current direction was not well measured making it difficult to make velocity comparisons along the principle axis. Goodness-of-fit statistics for currents at pod 3 and water levels at Pier 21 and Eagle Point are presented in Table 3.
Table 3. Goodness-of-fit statistics for verification.
| Station | NRMSE, % | NMAE, % | R | Bias |
| POD 3 | 12 | 10 | 0.92 | -0.04 m/s |
| Eagle Point | 19 | 15 | 0.58 | 0.01 m |
| Pier 21 | 17 | 14 | 0.80 | 0.04 m |
Conclusions
Data collected during two time periods in 2010 were applied to validate the CMS for circulation. Measurements of water level and currents were compared with CMS results at multiple locations including the Galveston Entrance Channel, the channel between Galveston and Pelican Islands, mid bay, and the Gulf of Mexico outside the inlet. CMS was run using default settings. A spatially constant Manning’s coefficient was calibrated to field measurements to n = 0.015 s/m1/3. Water level was well represented at all measurement locations as quantified in Tables 2 and 3. Measured currents compare well to modeled currents (quantified in Tables 2 and 3), except within the channel between Galveston and Pelican Islands. Between the islands, magnitude of current speed is well captured; however, flow direction and phase are not. Increased resolution in the channel, accounting for the presence of large vessels, may improve results in this area.
Recommendations for Practical Applications
The following recommendations are offered based on lessons learned during this model application:
- Spatially constant wind forcing may be applied over bay-scale domains, even when it is an important process. Although not specifically demonstrated for this case, it is important to test this assumption for each time period by comparing observed winds at multiple stations across the domain. Model results will be less accurate as the winds become less constant in space.
- Poor resolution over complex topography could result in locally less accurate results; however, lower resolution is often necessary away from the area of interest to increase computational speed.
- Manning’s n was varied for calibration. In general, the value for this parameter should always be based on comparison of model results to measurements.
References
- URS. (2010). “Implementation of Bathymetric Survey Plan and Sampling and Monitoring Plan,” Report to USACE Galveston District. 4/20/2010.
