CR-07-1:Chapter3: Difference between revisions
No edit summary |
No edit summary |
||
| Line 1: | Line 1: | ||
__TOC__ | |||
===Introduction=== | |||
Accurate prediction of sediment transport rates is an essential element in morphological studies of coastal, marine, and river environments. Sediment transport mainly occurs in two modes: bed load and suspended load. The bed load is the part of the total load that is traveling directly above the bed and is supported by intergranular collisions rather than fluid turbulence (Wilson 1966). The suspended load, on the other hand, is the part of the load which is primarily supported by the fluid turbulence (Fredsøe and Deigaard 1994). Thus, bed load includes mainly sediment transport for coarse materials (saltation) or fine material on plane beds (saltation at low shear stresses and sheet flow at high shear stresses), although both types of transport can occur together and the limit is not always easy to define. The earliest formulas (models) proposed to estimate bed-load transport were mainly based on the concept that the sediment transport rate can be related to the bottom shear stress (Meyer-Peter and Müller 1948; Einstein 1950) and these formulas were valid for steady, unidirectional flows. In coastal and marine environments, the process of sediment transport becomes increasingly complex due to the presence of oscillatory flows, and the interaction between steady and oscillatory flows. For example, in longshore sediment transport, the influence of the short waves is expressed through wave-induced sediment stirring that increases the bed shear stress (Bijker 1967, 1968; Watanabe 1982; Van Rijn 1993). | |||
However, in the case of cross-shore sediment transport, a wave-averaged approach is not adequate because of the dominant role of the time-dependent oscillatory orbital motion near the sea bed, induced by the short waves. For example, the residual cross-shore transport of sand due to short-wave asymmetry is generally described using an intrawave model concept, resolving the unsteady transport process through the wave cycle. Bagnold (1966) developed an "energetics transport model" in which the instantaneous transport through the wave cycle is related to the instantaneous energy dissipation rate due to bottom friction. Bagnold's (1966) approach has formed the basis for several bed-load transport models (Bailard and Inman 1981; Ribberink 1998) as well as total load transport models (Bailard 1981; Madsen and Grant 1976). These models use the bed-shear stress concept for river flow, and time-dependent transport through the wave cycle is treated in a quasi-steady way. That is, time-history effects from previous phases of the wave cycle or from previous wave cycles are neglected. | |||
The development of practical sediment transport models still has a strong empirical character and relies on physical insights and quantitative data obtained in laboratory and field studies. The objective of this study is to develop a reliable, robust, and general formula for predicting bed-load transport for a wide range of coastal, marine, and river conditions. Many data sets are incorporated in the model development including steady and unsteady (oscillatory) flows. | |||
For the bed-shear stress concept, a major problem is to estimate the total shear stress at the bottom. As a first step in this study, only conduit, flume, and river data for steady flows over a plane bed were examined to implement the bed-load formula. For these kinds of experimental studies, the bed shear stress may be estimated from energy slope measurements. Then, the formula was generalized to oscillatory flows and combined steady and oscillatory flows. However, for these more complex flows, the bed shear stress cannot be estimated directly from the measurements, but the stress must be calculated from theoretical models of the bed roughness. Thus, comparisons with experimental data were made by means of the skin friction as proposed by Soulsby (1997) and a semi-empirical function to estimate the bottom roughness in the sheet flow regime from Wilson (1989a). | |||
===Previous studies on bed-load transport under wave and current interaction=== | |||
The bed-load transport corresponds to the net flux near the bottom, which then includes bed load and sheet-flow transport. Many studies (analytic and experimental) have been performed for bed-load and sheet-flow transport, which are often related to the bottom shear stress. | |||
This section presents several sediment transport formulas that include both current and wave effects. | |||
1. The Bijker (1968) and Van Rijn (1984a, b, 1989) formulas. The formulation of bed-load transport comes from a method used in the river environment and adapted to the coastal environment. | |||
2. The Bailard (1981) bed-load formula, which involves an energetics description of sediment transport due to waves. | |||
3. The Dibajnia and Watanabe (1992) sheet-flow formula, which is based on the instantaneous velocity taking into account wave and current interaction and the associated induced movement of sediment (calibrated with experiments on sheet-flow transport). | |||
4. The Ribberink (1998) formula. Bed-load transport rate is estimated by integrating the instantaneous bed-load rate ''q''<sub>''sb''</sub>(''t'') over a wave period. | |||
====Bijker formula==== | |||
One of the first formulas for bed-load transport that is still often applied was proposed by Bijker (1967, 1968). It was derived from the Frijlink (1952) formula for current only with a modification of the bottom shear stress using a wave-current model. The direction of sediment fluxes is always that of the current because this formula is proposed to estimate the longshore transport rate. The Bijker formula is written: | |||
<math>{{q}_{sb}}={{C}_{b}}\,d\sqrt{\frac{{{\mu }_{c}}{{\tau }_{c}}}{\rho }}\exp \left[ -0.27\frac{\left( {{\rho }_{s}}-\rho \right)gd}{{{\mu }_{c}}{{\tau }_{cw}}} \right]</math> | |||
:(59) | |||
where ''q''<sub>''sb''</sub> is the sediment volume flux for bed load, ''C''<sub>''b''</sub> a breaking wave parameter, <sub>''c''</sub> the ripple parameter, τ<sub>''c''</sub> the shear stress due to current only, and τ<sub>''cw''</sub> the shear stress including the wave-current interaction. | |||
The ripple parameter introduced by Bijker (1968) is defined by the following equation: | |||
<math>{{\mu }_{c}}={{\left( \frac{{{f}_{ct}}}{{{f}_{c}}} \right)}^{3/2}}</math> | |||
:(60) | |||
where ''f''<sub>''ct''</sub> is the total friction coefficient due to the current and ''f''<sub>''c''</sub> the skin friction coefficient due to the current. The breaking wave coefficient is defined by the following relationships: | |||
<math>\begin{align} | |||
& {{C}_{b}}=2\quad \quad \quad \quad \quad \quad \quad \quad \text{ }\ \text{if}\quad {{H}_{w}}/h<0.05 \\ | |||
& \quad \ =2+3\left( {{H}_{w}}/h-0.05 \right)\quad \text{if}\quad 0.05<{{H}_{w}}/h<0.4 \\ | |||
& \quad \ =5\quad \quad \quad \quad \quad \quad \quad \quad \text{ }\ \text{if}\quad 0.4<{{H}_{w}}/h \\ | |||
\end{align}</math> | |||
:(61) | |||
where ''H''<sub>''w''</sub> is the wave height. The shear stress arising from the wave-current interaction is computed following the method proposed by Bijker (1968) where the effect of the waves is described through a stirring factor: | |||
<math>{{\tau }_{cw}}=\left[ 1+0.5{{\left( {{\xi }_{B}}\frac{{{U}_{w}}}{{{U}_{c}}} \right)}^{2}} \right]{{\tau }_{c}}</math> | |||
:(62) | |||
where | |||
<math>{{\xi }_{B}}=\sqrt{{{f}_{wt}}/{{f}_{ct}}}</math> | |||
is a parameter for wave-current interaction and ''f''<sub>''wt''</sub> the total friction coefficient due to waves. | |||
====Bailard formula==== | |||
Bagnold (1966) introduced an energetics model for sediment transport, where the main idea is that the solid flux is proportional to the energy flux (local rate of energy dissipation): | |||
<math>{{q}_{sb}}\quad \propto \quad \Omega </math> | |||
:(63) | |||
<math>\Omega =\frac{1}{2}\,\rho \,{{f}_{cw}}\ \left| \overrightarrow{u(t)}\left| ^{3} \right. \right.</math> | |||
:(64) | |||
where Ω is the energy flux from waves and currents, ''f''<sub>''cw''</sub> the friction coefficient due to the waves and current combined, ''u''(''t'') the instantaneous velocity vector, in which ''u''(''t'') = ''U''<sub>''c''</sub> + ''u''<sub>''w''</sub>(''t'') with ''U''<sub>''c''</sub> being the current velocity averaged over the depth and ''u''<sub>''w''</sub>(''t'') the instantaneous wave velocity. | |||
The Bailard and Inman (1981) formula was derived from Bagnold (1966) model concepts. It can take into account the effect of the instantaneous velocity profile from waves and current combined. For a horizontal bed, the formula can be written as a vector yielding the sediment volume transport: | |||
<math>{{\vec{q}}_{sb}}= & \frac{1}{2}\frac{{{f}_{cw}}}{g\left( s-1 \right)}\frac{{{\varepsilon }_{b}}}{\tan \varphi }\left. < \right|{{\left. {\vec{u}} \right|}^{2}}\vec{u}></math> | |||
:(65) | |||
where <sub>''b''</sub> is the bed-load efficiency, and < > represents the average over several wave periods. The bed-load efficiency is slightly different from the one given by Bagnold (1966). Bailard (1981) suggested based on calibration against field data that <sub>''b''</sub> = 0.1. | |||
One difficulty concerning the formula is to estimate the friction coefficient for waves and current combined. Bailard did not specify any expression for the friction coefficient. Indeed, friction coefficients due to a current or to waves only display considerably different values (''f''<sub>''w''</sub>/''f''<sub>''c''</sub> 10 - 100). Madsen and Grant (1976) suggested the following relationship for the combined friction factor: | |||
<math>{{f}_{cw}}=Y\ {{f}_{c}}+\left( 1-Y \right){{f}_{w}}\quad \text{with}\quad Y=\frac{{{\theta }_{c}}}{{{\theta }_{c}}+{{\theta }_{w}}}</math> | |||
:(66) | |||
where θ<sub>''c''</sub> and θ<sub>''w''</sub> are the Shields parameters due to current and waves, respectively. | |||
====Van Rijn formula==== | |||
The Van Rijn (1989) formula is defined in the same way as the Bijker (1967, 1968) formula, and the bed-load transport rate is written as follows: | |||
<math>{{q}_{sb}}=0.25\ {{d}_{50}}\ d_{*}^{-0.3}{{\left( \frac{{{\tau }_{ct}}}{\rho } \right)}^{0.5}}{{\left( \frac{{{\tau }_{cw}}-{{\tau }_{cr}}}{{{\tau }_{cr}}} \right)}^{1.5}}</math> | |||
:(67) | |||
where | |||
<math>{{\tau }_{ct}}={{\mu }_{f}}\ {{\alpha }_{cw}}\ {{\tau }_{c}}</math> | |||
the total shear stress due to current only (taking into account the influence of bed forms and waves), τ<sub>''cr''</sub> the critical shear stress for sediment transport, | |||
<math>{{\mu }_{f}}={{f}_{c}}/{{f}_{ct}}</math> | |||
the shape factor, and α<sub>''cw''</sub> a coefficient due to the presence of waves (which can affect the mean shear stress). | |||
====Dibajnia and Watanabe formula==== | |||
Similar to the formulas of Bailard and Ribberink (discussed next), the Dibajnia and Watanabe (1992; see also Dibajnia 1995) formula divides the sediment transport into two half-cycles due to the presence of waves (Figure 18). During the first half-cycle, sediment moves in the direction of wave propagation, and then it moves in the opposite direction during the second half-cycle. An advantage of the formula is that it takes into account a possible quantity of sand still in suspension after each half-cycle that moves in the opposite direction. This phenomenon is referred to as a "phase lag," introduced by Dohmen-Janssen (1999). Another advantage is that the formula (similar to the Bailard (1981) and Ribberink (1998) formulas) allows for the description of nonlinear waves. | |||
[[Image:CR-07-1_Chapter3_02_16.png|framed|none]] | |||
'''Figure 18. Definition of (a) wave and current directions, and (b) horizontal time-dependent velocity variation at bottom in direction of wave propagation <br>(after Dibajnia and Watanabe 1992).''' | |||
The solid volume flux is given by the following equation: | |||
<math>{{\vec{q}}_{sb}}={{A}_{dw}}\ {{W}_{s}}\ d\frac{{\vec{\Gamma }}}{\Gamma }{{\Gamma }^{{{B}_{dw}}}}</math> | |||
:(68) | |||
where the coefficients of calibration are ''A''<sub>''dw''</sub> = 0.001 and ''B''<sub>''dw''</sub> = 0.55, and: | |||
{|border="0" cellspacing="2" width="100%" | |||
| | |||
| | |||
[[Image:CR-07-1_Chapter3_03_301.png|framed|none]] | |||
|align = "right"|(69) | |||
|} | |||
in which ''T''<sub>''w''</sub>, ''T''<sub>''wc''</sub>, ''T''<sub>''wt''</sub> are the period and half-periods, respectively, of the wave taking into account the influence of the current (see Figure 18), <sub>''c''</sub> and <sub>''t''</sub> the amount of sand entrained and settled during the half-period ''T''<sub>''wc''</sub> of the wave crest and ''T''<sub>''wt''</sub> of the wave trough, respectively, | |||
<math>{{{\Omega }'}_{c}}</math> | |||
and | |||
<math>{{{\Omega }'}_{t}}</math> | |||
the amount of suspended sand remaining from the positive (crest) and the negative (trough) half-cycle, respectively, and ''u''<sub>''wc''</sub> and ''u''<sub>''wt''</sub> the quadratic velocity (wave and current combined) over each half-period calculated from: | |||
<math>u_{wj}^{2}=\frac{2}{{{T}_{wj}}}\int_{t}^{t+{{T}_{wj}}}{{{u}^{2}}\left( t \right)}dt+2\ U_{c}^{2}{{\sin }^{2}}\varphi </math> | |||
:(70) | |||
where ''j'' can be ''c'' or ''t'', | |||
<math>u(t)={{U}_{c}}\cos \varphi +{{u}_{w}}(t)</math> | |||
, with ''u''<sub>''w''</sub>(''t'') being the instantaneous wave orbital velocity, and the angle between the wave and current directions (Figure 18). The nondimensional quantities in Equation 69 are defined as: | |||
<math>\begin{align} | |||
& \text{if }{{\omega }_{j}}\le {{\omega }_{cr}}\quad \text{then}\quad {{\Omega }_{j}}={{\omega }_{j}}\frac{2\ {{W}_{s}}\ {{T}_{wj}}}{d} \\ | |||
& \ \ \ \ \quad \quad \quad \quad \quad \text{and}\quad \ \ {{{{\Omega }'}}_{j}}=0, \\ | |||
& \text{if }{{\omega }_{j}}\ge {{\omega }_{cr}}\quad \text{then }\quad {{\Omega }_{j}}=\frac{2\ {{W}_{s}}\ {{T}_{wj}}}{d}{{\omega }_{cr}} \\ | |||
& \ \quad \quad \quad \quad \quad \text{ and}\quad \ \ {{{{\Omega }'}}_{j}}=\left( {{\omega }_{j}}-{{\omega }_{cr}} \right)\frac{2\ {{W}_{s}}\ {{T}_{wj}}}{d} \\ | |||
\end{align}</math> | |||
:(71) | |||
with: | |||
<math>{{\omega }_{j}}=\frac{u_{wj}^{2}}{2\left( s-1 \right)g\ {{W}_{s}}\ {{T}_{wj}}}</math> | |||
:(72) | |||
where ''j'' can be ''c'' or ''t'' as before. | |||
The parameter ω<sub>''cr''</sub> characterizes the ripples (a function of the total shear stress including waves and current): | |||
<math>\begin{align} | |||
& {{\omega }_{cr}}=0.03\quad \quad \quad \quad \quad \quad \quad \quad \quad \quad \quad \ \ \ \,\text{if}\quad {{\theta }_{cw,\max }}\le 0.2 \\ | |||
& \quad \ \,=1-0.97{{\left[ 1-{{\left( \frac{{{\theta }_{cw,\max }}-0.2}{0.4} \right)}^{2}} \right]}^{0.5}}\text{if}\quad 0.2<{{\theta }_{cw,\max }}<0.6 \\ | |||
& \quad \ \,=1\quad \quad \quad \quad \quad \quad \quad \quad \quad \quad \quad \quad \,\quad \ \,\,\text{if}\quad 0.6<{{\theta }_{cw,\max }} \\ | |||
\end{align}</math> | |||
:(73) | |||
where θ<sub>''cw,max''</sub> is the maximum Shields parameter due to waves and current combined (following Soulsby 1997, pp. 87-95). | |||
====Ribberink formula==== | |||
Ribberink (1998) proposed a model for the quasi-steady bed-load transport for which the instantaneous solid flux is assumed to be a function of the difference between the actual time-dependent bed shear stress and the critical bed shear stress (Figure 19). This formula has been calibrated against flume data for waves and current combined in the plane-bed mode (suspended load negligible), as well as for field data for unidirectional flow in rivers. | |||
[[Image:CR-07-1_Chapter3_04.jpg|framed|none]] | |||
'''Figure 19. Time variation of bottom velocity (a) in wave direction, and (b) induced shear stress for waves and current combined (after Ribberink 1998).''' | |||
Thus, Ribberink (1998) proposed the following transport formula: | |||
<math>{{\vec{q}}_{sb}}={{m}_{Rib}}\sqrt{\left( s-1 \right)g\ {{d}^{3}}}<{{\left( \overrightarrow{\left| \theta \right.\left( t \right)}\left| -{{\theta }_{cr}} \right. \right)}^{{{n}_{Rib}}}}\frac{\left[ \overrightarrow{\theta \left( t \right)} \right]}{\left| \theta \left. \left( t \right) \right| \right.}</math> | |||
:(74) | |||
where | |||
<math>\vec{\theta }\left( t \right)=0.5\ {{f}_{cw}}\left| u\left( t \right) \right|\vec{u}\left( t \right)/\left[ \left( s-1 \right)\ g\ d \right]</math> | |||
is the time-dependent Shields parameter (Figure 19) with the instantaneous velocity | |||
<math>\vec{u}\left( t \right)={{\vec{U}}_{c}}+{{\vec{u}}_{w}}\left( t \right)</math> | |||
, the wave-current friction factor ''f''<sub>''cw''</sub> computed according to Madsen and Grant (1976), θ<sub>''cr''</sub> the critical Shields parameter, < > the time-average over several wave periods, and ''m''<sub>''Rib''</sub> = 11, ''n''<sub>''Rib''</sub> = 1.65 calibration coefficients. Ribberink (1998) proposed to compute the total roughness from | |||
<math>{{k}_{st}}=\max \left\{ {{k}_{s}}\text{;}d\left[ 1+6\left( <\left| \theta \left( t \right) \right|>/{{\theta }_{cr}}-1 \right) \right] \right\}</math> | |||
, where ''k''<sub>''s''</sub> is the Nikuradse skin roughness. | |||
===Bed-load transport by currents=== | |||
Here, bed load refers mainly to the rolling, sliding, and jumping grains in almost continuous contact with the bed. Also, it follows the ideas of Wilson (1966) about upper-regime transport where a layer with a thickness of several grain diameters is transported and where intergranular collision is important (sheet flow). | |||
====Existing formulas==== | |||
The bed-load transport is often represented by the following non-dimensional parameter: | |||
<math>\Phi =\frac{{{q}_{sb}}}{\sqrt{\left( s-1 \right)g\ {{d}_{50}}^{3}}}</math> | |||
:(75) | |||
where ''q''<sub>''sb''</sub> is the volumetric bed-load sediment transport rate per unit time and width. Some authors have also proposed to use the parameter | |||
<math>{{\Phi }_{b}}={{q}_{sb}}/\left( {{W}_{s}}{{d}_{50}} \right)</math> | |||
. If ''d''<sub>50</sub> > 10<sup>−3</sup> mm, <sub>''b''</sub> because the settling velocity is proportional to the square-root of the median diameter (according to Van Rijn 1984a), whereas for ''d''<sub>50</sub> < 10<sup>−3</sup> mm, Φ<sub>''b''</sub> becomes smaller than Φ, implying that Φ<sub>''b''</sub> introduces a characterization of the sediment transport rate that is more sensitive for fine sediments. | |||
Several relationships for estimating the bed-load sediment transport under a steady current have been proposed where the rate is related to the dimensionless bottom shear stress or Shields parameter: | |||
<math>{{\theta }_{c}}=\frac{{{\tau }_{c}}}{\left( {{\rho }_{s}}-\rho \right)g{{d}_{50}}}=\frac{\frac{1}{2}{{f}_{c}}U_{c}^{2}}{\left( s-1 \right)g{{d}_{50}}}</math> | |||
:(76) | |||
Here, τ<sub>''c''</sub> is the shear stress at the bottom due to the current. Three commonly applied formulas were investigated in this study: | |||
<math>\text{Meyer-Peter }\!\!\And\!\!\text{ }\text{M }\!\!\ddot{\mathrm{u}}\!\!\text{ ller (1948)}\quad \Phi =8{{\left( {{\theta }_{c}}-{{\theta }_{cr}} \right)}^{3/2}}</math> | |||
:(77) | |||
<math>\text{Nielsen (1992)}\quad \Phi =12\ \theta _{c}^{0.5}\left( {{\theta }_{c}}-{{\theta }_{cr}} \right)</math> | |||
:(78) | |||
<math>\text{Ribberink (1998)}\quad \Phi =11{{\left( {{\theta }_{c}}-{{\theta }_{cr}} \right)}^{1.65}}</math> | |||
:(79) | |||
where θ<sub>''cr''</sub> is the critical Shields parameter. The formula for θ<sub>''cr''</sub> proposed by Soulsby and Whitehouse (1997; see also Soulsby (1997), p. 104-110) was used in the present study (Equation 49). | |||
====Comparison with data==== | |||
To investigate bed-load transport formulas, available data sets on sediment transport covering a wide range of unidirectional steady currents were compiled and analyzed, including both laboratory and field data. Table 5 summarizes these data sets with the type of flow motion and sediment properties listed. It may be noted that many data sets come from the compilation made by Brownlie (1981), where limited information was given about the type of sediment transport (bed load and/or suspended load), although comments on the presence of bed forms were provided. From these data, only plane-bed cases were selected, where bed load should prevail. Typically, for fine sediment, suspended load is not negligible if bed forms appear. Thus, bed-load transport in the presence of bed forms was not investigated. The data base compiled covers a wide range of median grain sizes, many of them considerably coarser than what would be found at a coastal inlet, but the range provides an informative test on the limits of the formulas. Also, the currents included in the data base covered a broad range. Figures 20a and 20b display histograms of the median grain size and mean current speed for the data base employed. | |||
The existing formulas selected for comparison with the data relate the sediment transport rate to the bed shear stress, and they were developed for bed-load transport. In the employed database, it is uncertain what the ratio was between bed load and suspended load in each individual case. For the cases with coarser sediment, bed load must have dominated, with the grains moving through rolling, sliding, and jumping for lower shear stresses or in a sheet-flow layer for higher shear stresses. Even where suspended load might have been significant, experience with the Watanabe (1989) formula shows that the total load can often be related to the bed shear stress. This implies that the tested formulas may have some predictive potential in such a situtation, although it is in principle outside their range of applicability. | |||
---- | |||
'''Table 5. Data base compiled to study bed-load sediment transport in steady current (plane bed cases only). ''' | |||
{|border="2" cellspacing="0" cellpadding="4" width="100%" align="center" | |||
|'''Author(s)''' | |||
|'''Flow Type''' | |||
|'''Number''' | |||
|'''Material''' | |||
|'''''S''''' | |||
|'''''D'''''<sub>'''50</sub> ''''''(mm)''' | |||
|- | |||
|Gilbert (1914) | |||
|Steady uniform flow, flume, plane bed | |||
|250 | |||
|Sand | |||
|2,65 | |||
|0.3-4.9 | |||
|- | |||
|U.S. Army Engineer Waterways Experiment Station (1935-1936)<br>(in Brownlie 1981) | |||
|Steady uniform flow, flume, plane bed | |||
|162 | |||
|Sand | |||
|2.65 | |||
|0.18-4.1 | |||
|- | |||
|Willis et al. (1972) | |||
|Flume, plane bed | |||
|43 | |||
|Sand | |||
|2.65 | |||
|0.1 | |||
|- | |||
|Brownlie (1981) | |||
|Various experimental data <br>Plane bed | |||
|297 | |||
|Plastic<br>Sand | |||
|1.30-1.41<br>2.49-2.67 | |||
|2.2-20.2<br>0.088-20 | |||
|- | |||
|Brownlie (1981) | |||
|Various field data, plane bed | |||
|40 | |||
|Sand | |||
|2.65 | |||
|0.84-7.0 | |||
|- | |||
|Smart (1984, 1999 with Nikora and Smart 1997) | |||
|Exp. for steep channels and field data, plane bed | |||
|140 | |||
|Sand<br>Gravel | |||
|2.65<br>2.65 | |||
|2.0-10.5<br>53-200 | |||
|- | |||
|Nnadi & Wilson (1992) | |||
|Pressurized closed conduit | |||
|105 | |||
|Bakelite<br>Sand<br>Nylon | |||
|1.55<br>2.67<br>1.14 | |||
|0.67-1.05<br>0.70<br>3.94 | |||
|}<br clear="all"> | |||
{|border="2" cellspacing="0" cellpadding="4" width="100%" align="center" | |||
|align = "center"| | |||
[[Image:CR-07-1_Chapter3_05.jpg|framed|none]] | |||
|align = "center"| | |||
[[Image:CR-07-1_Chapter3_06.jpg|framed|none]] | |||
|- | |||
|align = "center"|'''(a)''' | |||
|align = "center"|'''(b)''' | |||
|}<br clear="all"> | |||
'''Figure 20. Distribution of median grain size and mean current speed for database compiled on sediment transport under steady current.''' | |||
Figure 21 illustrates a comparison between the sediment transport rate calculated with the Meyer-Peter and Müller (1948) formula and the compiled database. The other studied formulas yield similar agreement and exhibit the same general behavior, although the Nielsen (1992) formula showed slightly less agreement with the data. From Figure 21, two observations can be made: (1) for the Willis et al. (1972) data, the formulas underpredict the transport rate, which is probably due to the fine sediment used in the experiment and probable significant transport in suspension that the formulas fail to accurately quantify; and (2) for small transport rates, close to θ<sub>''cr''</sub>, the formulas overpredict the transport rate. With regard to the latter observation, it should be noted that all individual cases where the predictions implied a zero transport because θ<sub>''c''</sub> < θ<sub>''cr''</sub> were not plotted in the figure because of the log-log scale. | |||
[[Image:CR-07-1_Chapter3_07.jpg|framed|none]] | |||
'''Figure 21. Comparison between Meyer-Peter and Müller formula and compiled database on sediment transport rates.''' | |||
Because marked uncertainties exist in the measurements of the bed-load sediment transport (especially for field measurements), a prediction within a factor 2 of the measurements is considered to be a satisfactory result. In Table 6, the percentage of predicted values included within a factor of 2 or a factor of 5 deviation is presented (Px2 and Px5, respectively), as well as the root-mean-square error defined as: | |||
<math>{{E}_{rms}}=\frac{1}{n}\sum {{\left[ \text{Log}\left( \frac{{{q}_{sb,pred}}}{{{q}_{sb,meas}}} \right) \right]}^{2}}</math> | |||
:(80) | |||
To avoid any distortion in the calculation of ''E''<sub>''rms''</sub> for low transport rates (where ''q''<sub>''sb'',''pred''</sub> or ''q''<sub>''sb'',''meas''</sub> could be found equal to zero), a minimum value for ''q''<sub>''sb'',''pred''</sub> and ''q''<sub>''sb'',''meas''</sub> was specified (''q''<sub>''sb'',''min''</sub> = 10<sup>-8</sup>m<sup>2</sup>/sec). It appears that the Meyer-Peter and Müller (1948) formula, which was originally calibrated with coarse sediment data, gives fairly good results in comparison to the measurements, even for large shear stresses and fine sediment. An underestimation is, however, observed for the Willis et al. (1972) data, but as sediment used in this experiment was very fine (0.1 mm), some suspended transport probably occurred. The three formulas studied show similar behavior for large shear stresses with a slightly better prediction skill for the Ribberink (1998) formula. For smaller Shields parameter (θ<sub>''c''</sub> close to θ<sub>''cr''</sub>, where θ<sub>''cr''</sub> is estimated using the Soulsby and Whitehouse (1997) formula), all formulas tend to overestimate the bed-load rate with errors up to one order of magnitude for the Nielsen (1992) formula, which significantly increases the ''E''<sub>''rms''</sub> value. Thus, it seems that the use of the critical Shields parameter as a limit for specifying no transport is not sufficiently accurate for the existing formulas. | |||
'''Table 6. Prediction of bed-load transport rate within factor of 2 and 5 of measured values and root-mean-square errors using current only data. ''' | |||
{|border="2" cellspacing="0" cellpadding="4" width="100%" align="center" | |||
|rowspan = "2"|'''Author(s)''' | |||
|align = "center" colspan = "5"|'''All Data''' | |||
|align = "center"|'''All Data Except Willis et al.''' | |||
|- | |||
|'''Px2 (%)''' | |||
|'''Px5 (%)''' | |||
|'''''E'''''<sub>'''''rms'''''</sub> | |||
|'''Px2 (%)''' | |||
|'''Px5 (%)''' | |||
|'''''E'''''<sub>'''''rms'''''</sub> | |||
|- | |||
|Meyer-Peter & Müller | |||
|62 | |||
|83 | |||
|0.34 | |||
|66 | |||
|87 | |||
|0.30 | |||
|- | |||
|Nielsen | |||
|54 | |||
|72 | |||
|0.48 | |||
|57 | |||
|75 | |||
|0.46 | |||
|- | |||
|Ribberink | |||
|66 | |||
|85 | |||
|0.28 | |||
|69 | |||
|89 | |||
|0.25 | |||
|- | |||
|Equation 81 | |||
|73 | |||
|89 | |||
|0.19 | |||
|78 | |||
|93 | |||
|0.15 | |||
|}<br clear="all"> | |||
====New formula for bed-load transport==== | |||
To better understand the influence of the critical value of the Shields parameter on the sediment transport, Φ-values from the measurements are plotted versus the ratio θ<sub>''c''</sub>/θ<sub>''cr''</sub> in Figure 22. The studied formulas are also plotted with a constant value for θ<sub>''cr</sub> ''= 0.04 (mean value for the data set). | |||
[[Image:CR-07-1_Chapter3_08.jpg|framed|none]] | |||
'''Figure 22. Effect of critical Shields parameter on bed-load transport rate: comparison between data and studied formulas.''' | |||
All the predictive formulas are in fairly good agreement with the data if θ<sub>''c''</sub> > 5 θ<sub>''cr''</sub>, but they tend to slightly overestimate Φ when θ<sub>''cr''</sub> < θ<sub>''c''</sub> < 5 θ<sub>''cr''</sub>. For this range of values, the Meyer-Peter and Müller (1948) and Ribberink (1998) formulas exhibit a better behavior than the Nielsen (1992) formula. However, if | |||
<math>{{\theta }_{c}}\underset{\raise0.3em\hbox{$\smash{\scriptscriptstyle\thicksim}$}}{<}{{\theta }_{cr}}</math> | |||
, significant deviations in the predictions occur. All these formulas predict no sediment transport, although small sediment transport is often observed. The prediction of the critical Shields parameter is obviously associated with marked uncertainty (so is the sediment transport estimation for these low values). Thus, to avoid such errors, a new approach is introduced by including an exponential relationship for the effect of the critical Shields parameter, which allows low sediment transport rates if <sub>''cr''</sub>. Calibration against the measurements led to the following bed-load formula: | |||
<math>\Phi =12\ {{\theta }_{c}}^{1.5}\exp \left( -4.5\frac{{{\theta }_{cr}}}{{{\theta }_{c}}} \right)</math> | |||
:(81) | |||
Cheng (2002) proposed a formula similar to Equation 81, but without taking into account the effect of a varying critical Shields parameter. The Cheng (2002) formula seems to include a constant value of <sub>''cr''</sub> 0.05. The effect of a varying critical value of the Shields parameter is, however, not negligible as observed by Meyer-Peter and Müller (1948). | |||
Figures 22, 23, and 24 indicate that this new approach of describing the effect of the critical Shields parameter significantly improves the prediction skill for weak shear stresses. Predictions within a factor-2 deviation reach 70 percent (even 80 percent without the Willis et al. (1972) data), which increase the agreement by 10 percent compared to previous formulas (Table 6). The new relationship tends to overestimate the transport rate if | |||
<math>{{\theta }_{c}}</math> | |||
is much smaller than | |||
<math>{{\theta }_{cr}}</math> | |||
(see Figure 22), but reproduces trends well for small measured rates. | |||
[[Image:CR-07-1_Chapter3_09.jpg|framed|none]] | |||
'''Figure 23. Influence of critical Shields parameter on bed-load transport rate illustrated through data and Equation 81 (for different values on θ'''<sub>'''''cr'''''</sub>''').''' | |||
Figure 24 plots measured and calculated transport rate values for the database using the new formula (Equation 81). The plot confirms the improvement in the prediction of the bed-load transport. | |||
[[Image:CR-07-1_Chapter3_10.jpg|framed|none]] | |||
'''Figure 24. Comparison between bed-load transport for current only predicted <br>by new formula (Equation 81) and measurements.''' | |||
===Bed-load transport by waves=== | |||
====Existing formulas==== | |||
Several relationships for bed-load transport by waves have been proposed that relate the transport rate to the wave orbital velocity at the bottom ''U''<sub>''w''</sub> or the wave Shields parameter θ<sub>''w''</sub> defined as: | |||
<math>{{\theta }_{w}}=\frac{\frac{1}{2}{{f}_{w}}U_{w}^{2}}{\left( s-1 \right)g{{d}_{50}}}</math> | |||
:(82) | |||
where ''f''<sub>''w''</sub> is the dimensionless wave friction factor. Assuming that the rough turbulent regime is fully developed, the friction factor can be estimated, for example, with the formula suggested by Swart (1974) (see Equation 25). | |||
Transport formulas have been employed to estimate the wave half-cycle sediment transport Φ<sub>1/2 </sub>(Madsen and Grant 1976; Soulsby et al. 1993; Soulsby 1997). The net transport can then be calculated as the difference between the half-cycle transport beneath the crest and beneath the trough (the shear stress is calculated using the maximum and minimum values of the wave velocity at the bottom, ''u''<sub>''w'',''max''</sub> and ''u''<sub>''w'',''min''</sub>, respectively, instead of the wave orbital velocity ''U''<sub>''w''</sub>). In some other studies (Bailard and Inman 1981; Ribberink 1998), a relationship based on the instantaneous wave velocity was introduced for the bed load Φ(''t'') that can be integrated over a wave period. The following formulas are among the most common ones for calculating sediment transport under waves: | |||
<math>\text{Madsen }\!\!\And\!\!\text{ Grant (1976)}\quad {{\Phi }_{1/2}}=12.5\frac{{{W}_{s}}}{\sqrt{\left( s-1 \right)g\ {{d}_{50}}}}\theta _{w}^{3}</math> | |||
:(83) | |||
<math>\text{Bailard }\!\!\And\!\!\text{ Inman (1981)}\quad \Phi \left( t \right)=\frac{{{\varepsilon }_{b}}{{f}_{w}}}{{{\left( s-1 \right)}^{2}}{{g}^{2}}\tan \phi {{d}_{50}}}\left| {{u}_{w}}\left( t \right)\left| ^{2}\ {{u}_{w}}\left( t \right) \right. \right.</math> | |||
:(84) | |||
<math>\text{Dibajnia }\!\!\And\!\!\text{ Watanabe (1992)}\quad \Phi =0.001\frac{{{W}_{s}}}{\sqrt{\left( s-1 \right)g\ {{d}_{50}}}}{{\Gamma }^{0.55}}\frac{\Gamma }{\left| \Gamma \right|}</math> | |||
:(85) | |||
<math>\text{Soulsby (1997)}\quad {{\Phi }_{1/2}}=5.1{{\left( {{\theta }_{w}}-{{\theta }_{cr}} \right)}^{3/2}}</math> | |||
:(86) | |||
<math>\text{Ribberink (1998)}\quad \Phi \left( t \right)=11{{\left( \left| {{\theta }_{w}}\left( t \right) \right|-{{\theta }_{cr}} \right)}^{1.65}}\frac{{{\theta }_{w}}\left( t \right)}{\left| {{\theta }_{w}}\left( t \right) \right|}</math> | |||
:(87) | |||
It should be noted that Madsen and Grant (1976) as well as Dibajnia and Watanabe (1992) used the parameter Φ<sub>''b''</sub> instead of the parameter Φ (see previous discussion), which explains the coefficient | |||
<math>{{W}_{s}}/\sqrt{\left( s-1 \right)g\ {{d}_{50}}}</math> | |||
in their formulas. Bailard and Inman (1981) proposed a coefficient value of (<sub>''b''</sub> = 0.13, and ( is the internal friction angle of the sediment (( ( 30 deg). Dibajnia and Watanabe (1992) defined Γ as a function of the half periods ''T''<sub>''wc''</sub> and ''T''<sub>''wt''</sub> and the amount of sediment entrained that settle in each half-period, because some of the sediment might still be in suspension from the previous half-period (see also Camenen and Larroudé 2003). | |||
====Development of new formula==== | |||
As Madsen (1991) and Ribberink (1998) proposed, the instantaneous sediment transport rate may be related to the instantaneous shear stress in the same manner as for the steady case. Following the idea of Dibajnia and Watanabe (1992), a simplified velocity variation at the bottom may be considered to estimate the effect of the wave asymmetry on the sediment transport. Thus, the net sediment transport over a wave period is estimated for each half-period using a characteristic value for the quadratic velocity, or equivalently on the shear stress (if the friction coefficient is assumed to be constant). Thus, the mean value of the instantaneous shear stress over half a period may be used (Figure 25): | |||
<math>\begin{align} | |||
& {{\theta }_{w,onshore}}=\frac{1}{{{T}_{wc}}}\int_{0}^{{{T}_{wc}}}{{{\theta }_{w}}\left( t \right)dt} \\ | |||
& {{\theta }_{w,offshore}}=\frac{1}{{{T}_{wt}}}\int_{{{T}_{wc}}}^{{{T}_{w}}}{{{\theta }_{w}}\left( t \right)dt} \\ | |||
\end{align}</math> | |||
:(88) | |||
where ''T''<sub>''wc''</sub> and ''T''<sub>''wt''</sub> (= ''T''<sub>''w</sub> ''- ''T''<sub>''wc''</sub>) are the half periods where the instantaneous velocity ''u''<sub>''w''</sub>(''t'') (or instantaneous Shields parameter) is onshore (''u''<sub>''w''</sub>(''t'') > 0) or offshore (''u''<sub>''w''</sub>(''t'') < 0), respectively, and the instantaneous shear stress is defined as follows: | |||
<math>{{\theta }_{w}}\left( t \right)=\frac{\frac{1}{2}{{f}_{w}}\left| {{u}_{w}}\left( t \right) \right|{{u}_{w}}\left( t \right)}{\left( s-1 \right)g{{d}_{50}}}</math> | |||
:(89) | |||
[[Image:CR-07-1_Chapter3_11_1024.png|framed|none]] | |||
'''Figure 25. (a) Typical wave velocity variation, and (b) instantaneous Shields parameter variation over wave period in direction of wave propagation.''' | |||
Figure 25 presents a typical velocity variation and the associated instantaneous Shields parameter variation over a wave period. In the case of an asymmetric wave, a maximum in the shear stress occurs during onshore flow (in the direction of the wave propagation) that is larger than the minimum during offshore flow, which induces a net sediment transport in the direction of the waves. | |||
A constant value on the friction coefficient over the wave period was assumed in calculating the Shields parameter (Equation 89). Drake and Calantoni (2001) and Antunes Do Carmo et al. (2003) showed that the wave friction coefficient depends also on the acceleration of the fluid near the bottom. This dependence was previously noted by Trowbridge and Madsen (1984a, b), who made an analytical study of the turbulent wave boundary layer, highlighting the contribution of a time-varying eddy viscosity. However, it is assumed here that the predictions of the shear stresses using a constant friction factor are sufficiently accurate for application in practical sediment transport calculations. | |||
Using the same approach as for the steady current, an equation for the net sediment transport under waves may be derived similar to Equation 81. The net sediment transport under waves is expressed as: | |||
<math>\Phi ={{a}_{w}}\sqrt{{{\theta }_{w\text{,}onshore}}+{{\theta }_{w\text{,}offshore}}}{{\theta }_{w\text{,}m}}\ \exp \left( -{{b}_{w}}\frac{{{\theta }_{cr}}}{{{\theta }_{w}}} \right)</math> | |||
:(90) | |||
where ''a''<sub>''w''</sub> and ''b''<sub>''w''</sub> are coefficients | |||
<math>\left( \left| {{\theta }_{w\text{,}onshore}} \right| \right.</math> | |||
is always supposed to be larger than | |||
<math>\left. \left| {{\theta }_{w\text{,}offshore}} \right| \right)</math> | |||
and | |||
<math>{{\theta }_{w\text{,}m}}=<\left| {{\theta }_{w}}\left( t \right) \right|></math> | |||
is the time-averaged absolute value of the instantaneous Shields parameter. | |||
A conceptual model that supports this type of formulation would be based on the following assumptions: | |||
* The transport in the bottom layer is the product of the typical speed of the layer and the layer thickness, where the former is denoted ''U''<sub>''s''</sub> and the latter <sub>''m''</sub>. | |||
* The speed ''U''<sub>''s''</sub> is assumed proportional to the net shear velocity over a wave period, which gives a dependence on | |||
* <math>{{\left| {{\theta }_{w\text{,}onshore}}+{{\theta }_{offshore}} \right|}^{1/2}}</math> | |||
* | |||
* <math>\left( {{u}_{*}}\propto {{\theta }^{1/2}} \right)</math> | |||
* . | |||
* <sub>''m''</sub> is assumed proportional to the mean wave shear stress, which gives the dependence on θ<sub>''w'',''m''</sub>. | |||
The overall effect of the critical shear stress on the sediment transport over a wave period is estimated using the same approximation as for a steady current. However, because Soulsby (1997, pp. 104-106) proposed to compute the critical shear stress based on the maximum shear stress, the maximum Shields parameter is used in Equation 90. | |||
A difficulty encountered in applying the formula (and any other formulas based on the shear stress) is to estimate the total Shields parameter (or total friction coefficient) for the sheet flow mode. The work by Wilson (1989a) on wave-induced sheet-flow roughness was employed in this study, where he proposed to use the same equation as for steady current, but with the maximum wave-induced Shields parameter (''k''<sub>''s''</sub> = ''k''<sub>''s'',sfw</sub> = 5 θ<sub>''w ''</sub>''d''<sub>50</sub>). Because most of the results presented by Ribberink (1998) were based on the skin friction, to be consistent, two computations were made, first using the skin friction (''k''<sub>''s''</sub> = 2''d''<sub>50</sub>) and then the Wilson formula (Equation 41). It should be noted that the Wilson formula requires an iterative approach in solving for ''k''<sub>''s''</sub>. | |||
====Comparison with experimental data==== | |||
To investigate bed-load transport under waves only, a wide range of existing data sets was compiled and analyzed. Table 7 summarizes these data sets, in which the type of experiment, sediment properties, and wave properties are listed. It can be observed that most of the data are from oscillating water tunnels (OWT). The OWT experiments have two advantages for this type study: large orbital velocities can be achieved, and bed-load transport prevails. Previously, experimental studies were often carried out using an oscillating tray (OT: oscillating bed in a tank of still water; Manohar 1955; Kalkanis 1964; Abou-Seida 1965; and Sleath 1978). More recently, Dohmen-Janssen and Hanes (2002) carried out an experiment in a large wave flume (LWF). | |||
'''Table 7. Data summary for bed-load sediment transport experiments carried out in oscillatory flow with and without current. ''' | |||
{|border="2" cellspacing="0" cellpadding="4" width="100%" align="center" | |||
|'''Author(s)''' | |||
|'''Exp. Facil.''' | |||
|'''Cycle''' | |||
|'''Number''' | |||
|'''''s''''' | |||
|'''''d'''''<sub>'''50<br>'''</sub>'''(mm)''' | |||
|'''''U'''''<sub>'''''c''</sub> ''''''(m/sec)''' | |||
|'''''U'''''<sub>'''''w,max<br>'''''</sub>'''(m/sec)''' | |||
|'''''T'''''<sub>'''''w''</sub><br>''''''(sec)''' | |||
|- | |||
|Kalkanis (1964) | |||
|OT | |||
|Half | |||
|25 | |||
|2.63 | |||
|1.68-2.82 | |||
|0 | |||
|0.28-0.71 | |||
|3.2-6.2 | |||
|- | |||
|Abou Seida (1965) | |||
|OT | |||
|Half | |||
|34<br>9 | |||
|2.65<br>2.23 | |||
|0.14-2.61<br>0.70 | |||
|0<br>0 | |||
|0.35-1.28<br>0.41-0.80 | |||
|1.7-5.1<br>2.0-4.8 | |||
|- | |||
|Sleath (1978) | |||
|OT | |||
|Half | |||
|22<br>12 | |||
|2.60<br>1.138 | |||
|1.89, 4.24<br>3.04 | |||
|0<br>0 | |||
|0.20-0.68<br>0.07-0.17 | |||
|0.5-2.7<br>1.3-9.0 | |||
|- | |||
|Horikawa et al. (1982) | |||
|OWT | |||
|Half | |||
|6 | |||
|2.66 | |||
|0.2 | |||
|0 | |||
|0.76-1.27 | |||
|2.6-6.0 | |||
|- | |||
|Sawamoto & Yamashita (1986) | |||
|OWT | |||
|Half | |||
|22 | |||
|1.58<br>2.65 | |||
|1.5<br>0.2-1.8 | |||
|0<br>0 | |||
|0.74-1.25<br>0.46-1.25 | |||
|3.8<br>3.8 | |||
|- | |||
|Ahilan & Sleath (1987) | |||
|OWT | |||
|Half | |||
|5<br>4 | |||
|1.137<br>1.44 | |||
|4.0<br>4.3 | |||
|0<br>0 | |||
|0.3-0.5<br>1.1-1.2 | |||
|3.6-3.7<br>4.7-4.9 | |||
|- | |||
|Watanabe & Isobe (1990) | |||
|OWT | |||
|Full | |||
|11<br>65 | |||
|2.65<br>2.65 | |||
|0.18, 0.87<br>0.18, 0.87 | |||
|0<br>-0.3-0.25 | |||
|0.27-0.43<br>0.27-0.52 | |||
|3.0, 6.0<br>3, 6 | |||
|- | |||
|King (1991) | |||
|OWT | |||
|Half | |||
|178 | |||
|2.65 | |||
|0.1-1.1 | |||
|0 | |||
|0.3-1.2 | |||
|2.0-12.0 | |||
|- | |||
|Dibajnia & Watanabe (1992) | |||
|OWT | |||
|Full | |||
|25<br>76 | |||
|2.65<br>2.65 | |||
|0.20<br>0.20 | |||
|0<br>-0.26-0.22 | |||
|0.6-1.0<br>0.61-1.24 | |||
|1.0-4.0<br>1-4 | |||
|- | |||
|Ribberink & Chen (1993) | |||
|OWT | |||
|Full | |||
|4 | |||
|2.65 | |||
|0.128 | |||
|0 | |||
|0.6-1.2 | |||
|6.5 | |||
|- | |||
|Ribberink & Al Salem (1994) | |||
|OWT | |||
|Full | |||
|10 | |||
|2.65 | |||
|0.21 | |||
|0 | |||
|0.7-1.4 | |||
|5.0-12.0 | |||
|- | |||
|Delft Hydraulics (1993-1999; see Van Rijn et al. 2001) | |||
|OWT | |||
|Full | |||
|52 | |||
|2.65 | |||
|0.13-0.24 | |||
|<nowiki>-</nowiki>0.45-0.56 | |||
|0.37-1.49 | |||
|5, 12 | |||
|- | |||
|Dohmen-Janssen (1999) | |||
|OWT | |||
|Full | |||
|27 | |||
|2.65 | |||
|0.13-0.32 | |||
|0.23-0,45 | |||
|0.46-1.85 | |||
|4-12 | |||
|- | |||
|Dohmen-Janssen & Hanes (2002) | |||
|LWF | |||
|Full | |||
|4 | |||
|2.65 | |||
|0.21 | |||
|<nowiki>-</nowiki>0.05 - -0.03 | |||
|0.88-1.5 | |||
|6.5, 9.1 | |||
|- | |||
|Ahmed & Sato (2003) | |||
|OWT | |||
|Full | |||
|15 | |||
|2.65 | |||
|0.21-0.74 | |||
|0 | |||
|1.16-1.85 | |||
|3.0 | |||
|}<br clear="all"> | |||
Figure 27 shows the calculated and measured bed-load transport for the studied experiments using values on the empirical coefficients of ''a''<sub>''w''</sub> = 6 and ''b''<sub>''w''</sub> = ''b'' = 4.5 (see Figure 26 for the calibration of ''a''<sub>''w''</sub>). This new fit shows that if the effect of the critical Shields parameter on the mean sediment transport rate over a wave period is similar to steady flow, the total net rate is a function of the Shields parameter to the power 1.5 with a smaller value on the coefficient ''a'' than for steady current. Soulsby (1997) found similar results using the Meyer-Peter and Müller (1948) equation (Equations 77 and 86 include the coefficient values 8 and 5.1, respectively). This lower value is partly due to the time averaging. It may also contain contributions owing to a phase lag between instantaneous sediment concentration and the velocity at the bottom. | |||
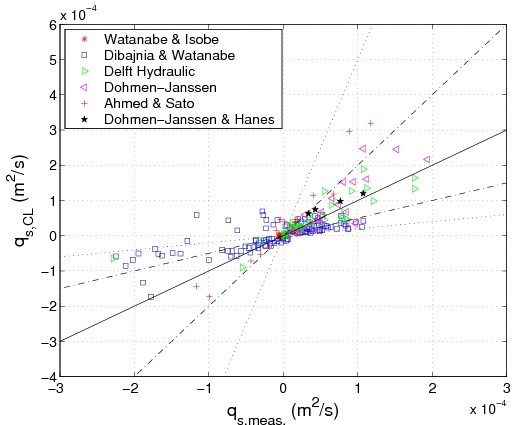
In Figure 27(a), the predicted bed load using Equation 90 is plotted versus the measurements encompassing waves only. Even if some scatter occurs, the obtained results are seen to be good. Around 60 percent of the cases are predicted within a factor of 2 of the measured values. An additional difficulty in comparing the transport formula with the wave measurements is that no shear stress may be derived from the measurements, but the shear stress has to be calculated based on an estimate of the bed roughness. This introduces an extra element of uncertainty in the calculations of the sediment transport rates. The formulas proposed by Wilson (1966, 1989a, b) were employed to calculate the Nikuradse roughness: | |||
<math>\frac{{{k}_{s,sfc}}}{{{d}_{50}}}=5\ {{\theta }_{c}}</math> | |||
:(91) | |||
<math>\frac{{{k}_{s,sfw}}}{{{d}_{50}}}=5\ {{\theta }_{w}}</math> | |||
:(92) | |||
Both equations require an iterative method in solving for the Nikuradse roughness. An underestimation for the Ahilan and Sleath (1987) data set and an overestimation for the Sawamoto and Yamashita (1986) data set is observed. One explanation could be that large uncertainties are induced by this kind of iterative formula (Bayram et al. 2003; Camenen et al. 2006). Using the Nikuradse skin roughness shows better agreement for the Sawamoto and Yamashita (1986) data set, but worse agreement for the Ahilan and Sleath (1987) data set (Figure 27(b)). Finally, it may be noted that Equation 90 slightly underestimates the sediment transport rate for the Kalkanis (1964) data set and overestimates the rate for the Abou-Seida (1965) and the Sleath (1978) data sets. Thus, it appears that the OT set-up does not yield the same behavior concerning the sediment transport as the OWT set-up. | |||
[[Image:CR-07-1_Chapter3_12.jpg|framed|none]] | |||
'''Figure 26. Calibration of coefficient ''''''''a'''''<sub>'''''w''</sub> ''''''using all experimental data with waves only (Nikuradse roughness calculated using Wilson (1989a) formula).''' | |||
---- | |||
{|border="2" cellspacing="0" cellpadding="4" width="100%" align="center" | |||
|align = "center"|(a) | |||
| | |||
[[Image:CR-07-1_Chapter3_13.jpg|framed|none]] | |||
|- | |||
|align = "center"|(b) | |||
| | |||
[[Image:CR-07-1_Chapter3_14.jpg|framed|none]] | |||
|}<br clear="all"> | |||
'''Figure 27. Comparison between bed-load transport predicted by Equation 90 and experimental data with waves (a) where ''''''''k'''''<sub>'''''s''</sub> ''''''is calculated using Wilson (1989a) formula, and (b) where ''''''''k'''''<sub>'''''s''</sub> ''''''= 2''''''''d'''''<sub>'''50'''</sub>'''.''' | |||
Table 8 lists the percentages of predicted values within a factor of 2 deviation or a factor of 5 deviation and the root-mean-square error for the six studied formulas and all the data, as well as for the data encompassing complete wave cycles, using the Wilson (1989a) formula to compute the Nikuradse roughness (''k''<sub>''s''</sub> = ''k''<sub>''s'',''sfw''</sub>). The same calculations were also performed for all the data with the skin friction (''k''<sub>''s''</sub> = 2''d''<sub>50</sub>) to compute the Shields parameter. | |||
'''Table 8. Predictive capability of bed-load transport rate within factor of 2 and 5 of measured values and root-mean-square errors, data from waves only. ''' | |||
{|border="2" cellspacing="0" cellpadding="4" width="100%" align="center" | |||
|rowspan = "2"|'''Author(s)''' | |||
|align = "center" colspan = "7"|'''All Data<br>(''''''''k'''''<sub>'''''s</sub> ''''''''''= k'''''<sub>'''''s,sfw'''''</sub>''')''' | |||
|align = "center"|'''Full Cycle Data<br>(''''''''k'''''<sub>'''''s</sub> ''''''''''= k'''''<sub>'''''s,sfw'''''</sub>''')''' | |||
|align = "center"|'''All Data<br>(''''''''k'''''<sub>'''''s</sub> ''''''''''= ''''''''2''''''''d'''''<sub>'''50'''</sub>''')''' | |||
|- | |||
|'''Px2 (%)''' | |||
|'''Px5 (%)''' | |||
|'''''E'''''<sub>'''''rms'''''</sub> | |||
|'''Px2 (%)''' | |||
|'''Px5 (%)''' | |||
|'''''E'''''<sub>'''''rms'''''</sub> | |||
|'''Px2 (%)''' | |||
|'''Px5 (%)''' | |||
|'''''E'''''<sub>'''''rms'''''</sub> | |||
|- | |||
|Madsen & Grant | |||
|37 | |||
|64 | |||
|1.25 | |||
|06 | |||
|14 | |||
|5.22 | |||
|45 | |||
|75 | |||
|0.99 | |||
|- | |||
|Bailard & Inman | |||
|47 | |||
|75 | |||
|0.92 | |||
|38 | |||
|57 | |||
|3.81 | |||
|45 | |||
|73 | |||
|0.93 | |||
|- | |||
|Dibajnia & Watanabe | |||
|36 | |||
|75 | |||
|0.49 | |||
|49 | |||
|85 | |||
|0.79 | |||
|36 | |||
|75 | |||
|0.49 | |||
|- | |||
|Soulsby (coef. 2.5) | |||
|36 | |||
|75 | |||
|0.98 | |||
|20 | |||
|52 | |||
|3.92 | |||
|39 | |||
|76 | |||
|0.97 | |||
|- | |||
|Ribberink | |||
|29 | |||
|73 | |||
|1.08 | |||
|20 | |||
|46 | |||
|4.14 | |||
|36 | |||
|76 | |||
|1.03 | |||
|- | |||
|Equation 90 | |||
|59 | |||
|86 | |||
|0.77 | |||
|34 | |||
|58 | |||
|3.84 | |||
|57 | |||
|86 | |||
|0.78 | |||
|}<br clear="all"> | |||
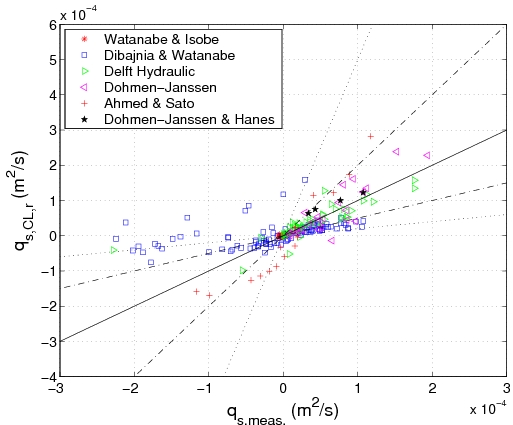
Equation 90 yields the best overall results. For the full cycle data, because the phase lag is not taken into account, the agreement is not as good, and the scatter is larger (''E''<sub>''rms''</sub> = 3.8). The Madsen and Grant (1976) formula tends to overestimate the sediment transport for large values of the shear stress. This formula is proportional to the Shields parameter to the power 3 and calibrated with lower shear stress data. Soulsby (1997) suggested to use the maximum shear stress in his formula, which causes a large overestimation of the transport rates. Replacement of a coefficient value of 2.5 instead 5.1 improves the results (results in Table 8), but it still indicates an overestimation of the sediment transport for low shear stresses. If the mean shear stress is used instead of the maximum shear stress (with the coefficient 5.1), results are better and similar to those given by Equation 90, except for data with low sediment transport rates, which are typically overestimated. The Bailard and Inman (1981), Dibajnia and Watanabe (1992), and Ribberink (1998) formulas also overestimate the weak sediment transport rate data. This means that the effect of the critical Shields parameter is not taken into account properly (not included in the Bailard and Inman (1981) and Dibajnia and Watanabe (1992) formulas). | |||
The Ribberink (1998) formula typically overestimates the sediment transport rate. Using the coefficient values (7.9, 1.97) instead of (11, 1.65) or using ''k''<sub>''s''</sub> = ''d''50, as Ribberink (1998) proposed, improves the results. However, this is not in accordance with the formula originally proposed for a steady current (Equation 79) or with physical values of the Nikuradse roughness. The Dibajnia and Watanabe (1992) formula, because it takes the phase lag into account, allows the sediment transport to be in the opposite direction to the waves for fine sediment. Thus, it presents the overall best results for the full cycle data and a much lower scatter (''E''<sub>''rms''</sub> < 1). On the other hand, it yields poor results for the half-cycle data. Finally, it should be noted that results from the OT data are typically more scattered. This may be a result of the shear stresses being close to the critical shear stress, inducing additional randomness, as well as uncertainty in the measurements. | |||
The main theoretical difference between the Ribberink (1998) relationship (Equation 87) and Equation 90 is that the former equation is a mean value of the instantaneous sediment transport over the wave period, whereas the latter calculates the sediment transport from the mean shear stress. Using the mean value over the wave period of the instantaneous sediment transport induces a sediment transport rate 20 percent larger than using the same equation with the mean shear stress over the period. Moreover, as was observed previously, phase-lag effects seem to be non-negligible, even for relatively small wave orbital velocities. This may explain the overestimation observed for the Ribberink formula. | |||
Another remark to be made (Figure 28) is that the direction of the net sediment transport may be opposite to the direction of the waves. Ribberink and Chen (1993) and Dibajnia and Watanabe (1992) observed this phenomenon for highly asymmetric waves and fine sediment (''d''<sub>50</sub> 0.2 mm). It is caused by the phase lag in the response of the sand to the fluid motion. The quantity of sediment in suspension depends not only on the instantaneous velocity, but also on the settling velocity. In the case of oscillatory flow, not all the sand grains put into suspension during the first half-period settle during the same half-period. The proportion still in suspension is then carried away in the opposite direction during the second half-period. Dohmen-Janssen (1999) and Dohmen-Janssen and Hanes (2002) introduced a parameter to describe the phase lag. | |||
<math>{{p}_{pl}}=\frac{2\pi \ {{\delta }_{s}}}{{{W}_{s}}{{T}_{w}}}</math> | |||
:(93) | |||
where δ<sub>''s''</sub> is the thickness of the sheet-flow layer. Following Asano (1992) and Dohmen-Janssen and Hanes (2002), δ<sub>''s''</sub> = 10 ''d''<sub>50</sub> <sub>''w''</sub>. They observed that phase-lag effects occur if ''p''<sub>''pl''</sub> > 0.3-0.4. Figure 28 plots the cases where strong phase lag occurs (circles). These data points correspond to an overestimation (and/or wrong direction) of the predicted values using Equation 90. Thus, it appears that the proposed formula is mainly restricted to cases without significant phase lag. This phenomenon is not included in Equation 90, but could be approximated by adding a correction factor (Dohmen-Janssen 1999; Dohmen-Janssen and Hanes 2002; Camenen and Larroudé 2003). | |||
[[Image:CR-07-1_Chapter3_15.jpg|framed|none]] | |||
'''Figure 28. Comparison between bed-load transport predicted by Equation 90 and experimental data over full wave cycle (''''''''k'''''<sub>'''''s''</sub> ''''''calculated using Wilson (1989a) formula, <br>''''''''k'''''<sub>'''''s''</sub> ''''''= ''''''''k'''''<sub>'''''s,sfw'''''</sub>''').''' | |||
Bed-load transport by waves and currents | |||
Stirring by waves in the presence of a steady current tends to increase the total sediment transport significantly. Also, as shown in the previous section, asymmetric waves can transport sediment. Thus, to generalize the proposed formula to encompass both waves and current, a modification of the formula is proposed including the total shear stress obtained from the interaction between waves and current. | |||
====Development of new formula==== | |||
The conceptual model proposed for the case of waves only (Equation 90) can be extended to the interaction between waves and current. Assuming that ''U''<sub>''s''</sub> is proportional to the shear velocity at the bottom, a dependence on | |||
<math>{{\left| {{\theta }_{cw,onshore}}+{{\theta }_{cw,offshore}} \right|}^{1/2}}</math> | |||
may be assumed for ''U''<sub>''s''</sub>, where the interaction between waves and current is taken into account. The representative shear stresses θ<sub>''cw'',''onshore''</sub> and θ<sub>''cw'',''offshore''</sub> are defined based on the instantaneous Shields parameter in the direction of the wave for positive and negative values of θ<sub>''cw''</sub>(''t''), respectively (Figure 29). For an arbitrary angle ( between the waves and the current, this yields the same equations as Equation 88, where θ<sub>''w''</sub> is replaced by θ<sub>''cw''</sub>, and ''T''<sub>''wc''</sub> and ''T''<sub>''wc''</sub> are the half-periods where the instantaneous velocity | |||
<math>u\left( t \right)={{U}_{c}}\cos \varphi \ +{{u}_{w}}\left( t \right)</math> | |||
(or instantaneous Shields parameter) is onshore (''u''(''t'') > 0) or offshore (''u''(''t'') < 0), respectively (Figure 29). The representative shear stresses θ<sub>''cw,onshore''</sub> and θ<sub>''cw'',''offshore''</sub> are defined as quadratic values of the instantaneous Shields parameter in the direction of the wave for positive and negative values of θ<sub>''cw''</sub>(''t''), respectively (Figure 29). For an arbitrary angle ( between the waves and the current, this yields: | |||
<math>{{\theta }_{cw,onshore}}=\frac{1}{{{T}_{wc}}}\int_{0}^{{{T}_{wc}}}{{{\theta }_{cw}}\left( t \right)dt}</math> | |||
:(94) | |||
<math>{{\theta }_{cw,offshore}}=\frac{1}{{{T}_{wt}}}\int_{{{T}_{wc}}}^{{{T}_{w}}}{{{\theta }_{cw}}\left( t \right)dt}</math> | |||
:(95) | |||
where ''T''<sub>''wc''</sub> and ''T''<sub>''wt''</sub> are the half-periods where the instantaneous velocity ''u'' = ''U''<sub>''c''</sub> cos + ''u''<sub>''w''</sub>(''t'') (or instantaneous Shields parameter) is onshore (> 0) or offshore (< 0), respectively. The instantaneous Shields parameter is defined as follows: | |||
<math>{{\theta }_{cw}}\left( t \right)=\frac{\frac{1}{2}{{f}_{cw}}\left| {{U}_{c}}\cos \varphi +{{u}_{w}}\left( t \right) \right|\left( {{U}_{c}}\cos \varphi +{{u}_{w}}\left( t \right) \right)}{\left( s-1 \right)g{{d}_{50}}}</math> | |||
:(96) | |||
where ''f''<sub>''cw''</sub> is the friction coefficient for an interaction between wave and current. This coefficient is assumed to be constant over the wave period as a first approximation but, as already noted, a temporal variation exists. Madsen and Grant (1976) suggested that ''f''<sub>''cw''</sub> could be obtained as a linear combination of the current-related (''f''<sub>''c''</sub>) and wave-related (''f''<sub>''w''</sub>) friction coefficients according to Equation 66. | |||
{|cellspacing="0" cellpadding = "10" style="border-style:solid; border-color:black; border-width:1px;" | |||
|(a) (b) <br> | |||
<br> | |||
|} | |||
[[Image:CR-07-1_Chapter3_01.gif]] | |||
[[Image:CR-07-1_Chapter3_16.jpg|framed|none]] | |||
'''Figure 29. Definition sketches for (a) wave and current interaction, and (b) typical velocity variation over wave period in direction of wave propagation including effect of steady current.''' | |||
Appendix B compiles analytical expressions for θ<sub>''cw'',''onshore''</sub> and θ<sub>''cw'',''offshore''</sub> for different wave theories or approximations. | |||
The assumption that the moving sediment layer thickness Δ<sub>''s''</sub> is proportional to the total mean bottom shear stress gives a dependence on θ<sub>''cw,m''</sub> for the transport rate (the stirring at the bottom by the waves and current together is mobilizing the layer). For an arbitrary angle between the waves and the current, the mean and maximum combined Shields parameters at the bottom θ<sub>''cw'',''m''</sub> and θ<sub>''cw''</sub>, respectively, are written: | |||
<math>{{\theta }_{cw,m}}={{\left( \theta _{c}^{2}+\theta _{w,m}^{2}+2\ {{\theta }_{w,m}}\ {{\theta }_{c}}\ \cos \varphi \right)}^{1/2}}</math> | |||
:(97) | |||
<math>{{\theta }_{cw}}={{\left( \theta _{c}^{2}+\theta _{w}^{2}+2\ {{\theta }_{w}}\ {{\theta }_{c}}\ \cos \varphi \right)}^{1/2}}</math> | |||
:(98) | |||
where the magnitude of the mean (maximum) shear stresses from the waves and current were added (vector addition). A more sophisticated approach would include the time variation of the waves in this addition. | |||
In the derivation of a transport formula where waves contribute to the transporting velocity, it is convenient to determine the transport rate parallel and perpendicular to the direction of wave propagation. Then, for an arbitrary angle between the waves and the current, Equation 81 can be written in the following manner. | |||
<math>\left\{ \begin{align} | |||
& {{\Phi }_{w}}={{a}_{w}}\frac{{{\theta }_{cw,onshore}}+{{\theta }_{offshore}}}{\sqrt{\left| {{\theta }_{cw,onshore}}+{{\theta }_{offshore}} \right|}}{{\theta }_{cw,m}}\ \exp \left( -b\frac{{{\theta }_{cr}}}{{{\theta }_{cw}}} \right) \\ | |||
& {{\Phi }_{n}}={{a}_{n}}\frac{{{\theta }_{cn}}}{\sqrt{\left| {{\theta }_{cn}} \right|}}{{\theta }_{cw,m}}\ \exp \left( -b\frac{{{\theta }_{cr}}}{{{\theta }_{cw}}} \right) \\ | |||
\end{align} \right.</math> | |||
:(99) | |||
where ''w'' and ''n'' correspond, respectively, to the wave direction and the direction normal to the wave direction, | |||
<math>{{\theta }_{cn}}=\frac{1}{2}{{f}_{c}}U_{c}^{2}\sin \varphi \left| \sin \varphi \right|/\left( \left( s-1 \right)g{{d}_{50}} \right)</math> | |||
, and ''a''<sub>''w''</sub>, ''a''<sub>''n''</sub>, and ''b'' are empirical coefficients as before. The same value ''b'' = 4.5 is retained. For consistency with previous results obtained for current only and waves only, the following relationship is proposed for the coefficient ''a''<sub>''w''</sub>: | |||
<math>{{a}_{w}}=6+6Y\text{ with }Y=\frac{{{\theta }_{c}}}{{{\theta }_{c}}+{{\theta }_{w}}}</math> | |||
:(100) | |||
Also, we take ''a''<sub>''n''</sub> = 12. | |||
The overall effect of the critical shear stress on the sediment transport over a wave period may be estimated using the same approximation as for the steady current. However, because Soulsby (1997, pp. 104-106) proposed to compute the critical shear stress based on the maximum shear stress, the maximum Shields parameter θ<sub>''cw''</sub> is used. | |||
For = 90 deg and | |||
<math>{{\theta }_{w}}\gg {{\theta }_{c}}</math> | |||
, | |||
<math>{{\theta }_{cw}}\approx {{\theta }_{w}}</math> | |||
, that is, the waves are perpendicular to the current and control the stirring of the sediment. If θ<sub>''c''</sub> = 0 (no current) with sinusoidal waves, θ<sub>''cw''</sub> = θ<sub>''w''</sub> and θ<sub>''cw'',''onshore''</sub> + θ<sub>''cw'',''offshore''</sub> = 0, which gives no bed load unless wave asymmetry is included. | |||
====Comparison with experimental data==== | |||
To investigate bed-load transport where waves and current are interacting, several existing data sets were compiled and analyzed (Table 7). Most of the data are from OWT experiments implying large orbital velocities with prevailing bed-load transport. More recently, Dohmen-Janssen and Hanes (2002) carried out experiments in a large-scale wave flume (LWF). For nonbreaking waves, they found that the bed-load sediment transport represents around 90 percent of the total load. These experiments showed that results are consistent with those observed in oscillating water tunnels (OWTs), although differences in the suspended sediment concentration and the total sediment transport rate are apparent. Net transport rates under waves were found to be about a factor 2.5 larger than in uniform horizontal oscillatory flows. They explained this by referring to the differences between boundary layer flows in OWT sand under free surface gravity waves. This difference may partly be attributed to the onshore-directed boundary layer streaming that is present under waves and is absent in horizontal oscillatory flow. | |||
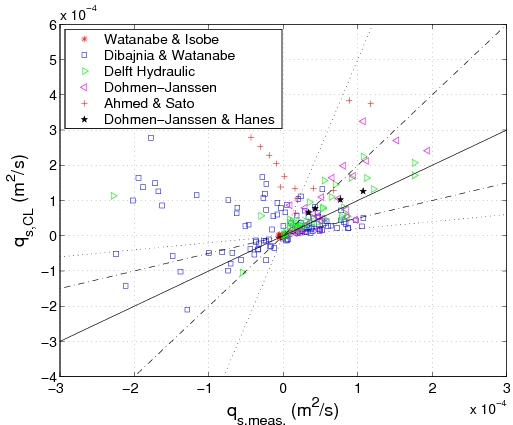
Figure 30(a) plots the bed-load transport predicted by Equation 99 against experimental data for current and waves interacting (with ''U''<sub>''c''</sub> > 0.02 m/sec). Good agreement is observed, and more than 50 percent of the data points are predicted within a factor of 2 of the measured values. A major part of the discrepancy (''E''<sub>''rms''</sub> 2, see Table 9) can be explained by the difficulty in predicting roughness values for oscillatory sheet flow (no measured values available) and because phase-lag effects are not included in the formula (some large overestimations or even incorrect transport directions are observed if strong phase lag occurs, as indicated in Figure 28). The sediment transport rates for the Delft Hydraulic data set are slightly overestimated if the Wilson formula is used and better predicted using the Nikuradse skin roughness (Figure 30(b)). On the other hand, the sediment transport rates for the Dibajnia and Watanabe (1992) data set are underestimated if the skin friction is used and better predicted if the Wilson formula is employed. The four data points from the large wave flume experiment are well predicted (within a factor of 2 of the measured values). | |||
It seems that the differences observed by Dohmen-Janssen and Hanes (2002) between the LWF and OWT experiments for the linear relationship between the net transport rates and the third-power velocity moment are reduced by inclusion of the friction coefficient (within the Shields parameter). Finally, contrary to comparisons with other formulas, good agreement is observed for the Watanabe and Isobe (1990) data set, corresponding to small wave orbital velocities and periods. This means that the effect of the critical Shields parameter is well described. It should be noted that for this data set, ripples were sometimes observed, which induced stronger suspension and phase-lag effects. Appearance of ripples may explain the opposite direction of the sediment transport observed for some of the data points as pointed out by Dibajnia and Watanabe (1992). | |||
====Comparison with existing formulas for waves and current==== | |||
Only the Bailard and Inman (1981), Dibajnia and Watanabe (1992), and Ribberink (1998) formulas include the effects of a current. Table 9 lists the percentage of predicted values, within a factor of 2 or a factor of 5 deviation from the measurements, for the four studied formulas presented for all the data where a mean current is present using the Wilson relationship (''k''<sub>''s''</sub> = ''k''<sub>''s'',''sfw''</sub>) or the skin friction (''k''<sub>''s''</sub> = 2''d''<sub>50</sub>) to compute the Nikuradse roughness. | |||
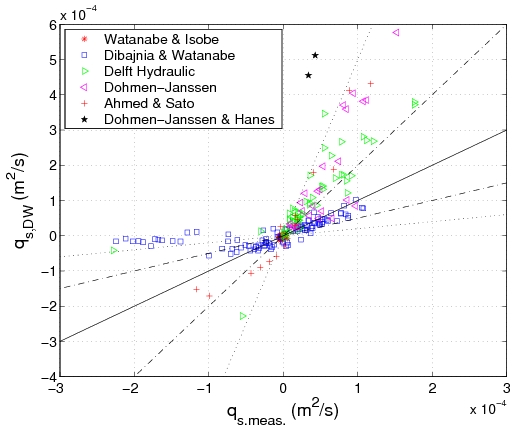
As seen in Table 9, a larger discrepancy exists compared to the steady current data, because the total shear stress has to be estimated instead of using measured values. Equation 99 still yields the best overall results. The Bailard and Inman (1981) formula overestimates the sediment transport rate for low shear stresses (e.g., the Watanabe and Isobe (1990) data set), and underestimates the rate for the Dibajnia and Watanabe (1992) data set and for all the cases where strong phase lag occurs. Nevertheless, it gives good overall agreement with the data. As already observed, the Ribberink (1998) formula overestimates the transport rates when waves are present. Results are improved using the Nikuradse skin roughness, but they remain poor compared to the other predictive formulas. Finally, although the Dibajnia and Watanabe (1992) formula shows good overall results, it overestimates the data from Delft Hydraulics and seems not to be adequately sensitive to the bottom shear stress. | |||
{|border="2" cellspacing="0" cellpadding="4" width="100%" align="center" | |||
|align = "center"|(a) | |||
| | |||
[[Image:CR-07-1_Chapter3_17.jpg|framed|none]] | |||
|- | |||
|align = "center"|(b) | |||
| | |||
[[Image:CR-07-1_Chapter3_18.jpg|framed|none]] | |||
|}<br clear="all"> | |||
'''Figure 30. Comparison between bed-load transport predicted by Equation 99 and experimental data with current (''''''''U'''''<sub>'''''c''</sub> ''''''> 0.02 m/sec) (a) where ''''''''k'''''<sub>'''''s''</sub> ''''''is calculated using Wilson (1989a) formula, and (b) where ''''''''k'''''<sub>'''''s''</sub> ''''''= 2''''''''d'''''<sub>'''50'''</sub>'''.''' | |||
'''Table 9. Prediction of bed-load transport rate within factor of 2 and 5 of <br>measured values and root-mean-square errors using data on waves <br>and current combined (''''''''U'''''<sub>'''''c''''''''</sub><sub>'</sub>''' > 0.02 m/sec). ''' | |||
{|border="2" cellspacing="0" cellpadding="4" width="84%" align="center" | |||
|rowspan = "2"|'''Author(s)''' | |||
|align = "center" colspan = "5"|'''All Data<br>(''''''''k'''''<sub>'''''s</sub> ''''''''''= k'''''<sub>'''''s'''''''',''''''''sfw'''''</sub>''')''' | |||
|align = "center"|'''All Data<br>(''''''''k'''''<sub>'''''s</sub> ''''''''''= ''''''''2''''''''d'''''<sub>'''50'''</sub>''')''' | |||
|- | |||
|'''Px2 (%)''' | |||
|'''Px5 (%)''' | |||
|'''''E'''''<sub>'''''rms'''''</sub> | |||
|'''Px2 (%)''' | |||
|'''Px5 (%)''' | |||
|'''''E'''''<sub>'''''rms'''''</sub> | |||
|- | |||
|Bailard & Inman | |||
|47 | |||
|70 | |||
|2.07 | |||
|41 | |||
|68 | |||
|2.10 | |||
|- | |||
|Dibajnia & Watanabe | |||
|41 | |||
|72 | |||
|1.74 | |||
|41 | |||
|72 | |||
|1.74 | |||
|- | |||
|Ribberink | |||
|18 | |||
|44 | |||
|4.13 | |||
|32 | |||
|52 | |||
|4.01 | |||
|- | |||
|Equation 99 | |||
|54 | |||
|77 | |||
|2.03 | |||
|46 | |||
|74 | |||
|2.05 | |||
|}<br clear="all"> | |||
===Phase-lag effects on sediment transport in sheet flow=== | |||
====Introduction==== | |||
Manohar (1955) performed one of the first studies on the inception of sheet flow (disappearance of the wave ripples) by using an oscillatory tray facility. In more recent times, sheet flow processes have typically been studied in oscillating water tunnels because field measurements close to the bed are not possible during storms, when sheet flow should prevail (e.g., Horikawa et al. 1982; Sawamoto and Yamashita 1986; King 1991; Asano 1992; Dibajnia and Watanabe 1992; Ribberink and Chen 1993; Ribberink and Al-Salem 1994; Li and Sawamoto 1995; Zala Flores and Sleath 1998; Dohmen-Janssen 1999; and Dohmen-Janssen et al. 2002). These studies considerably improved knowledge on the thickness of the sheet-flow layer, the time-dependent concentration profile inside the sheet-flow layer, and the resulting sediment transport rates. | |||
Ribberink (1998) showed that a quasi-steady formula based on the Meyer-Peter and Müller (1948) concept successfully describes the net sediment transport rates with the exception of relatively fine sands (''d''<sub>50</sub> < 0.2 mm) and short wave periods (''T''<sub>''w''</sub> < 3 sec). Dibajnia and Watanabe (1992) carried out experiments with short period waves and found that in many cases a quasi-steady transport model failed to describe the magnitude and the direction of the net transport rate. They hypothesized that the phase lag between velocity and concentration was responsible for this discrepancy. Similar observations were made by Ribberink and Chen (1993) with fine sediment (''d''<sub>50</sub> = 0.13 mm) and large asymmetric waves. Dohmen-Janssen et al. (2002) extended the data set on net transport rates and time-dependent velocities and concentrations under sheet-flow conditions during sinusoidal oscillatory flow combined with a net current for sand with different grain sizes (i.e., ''d''<sub>50</sub> = 0.13, 0.21, and 0.32 mm). They suggested that this limitation of quasi-steady models may be due to a phase lag, such as delayed entrainment and settling of sand grains, and proposed a simple model to take these effects into account. The lag between the sediment concentration and the flow was characterized by the ratio between the fall time of the sediment particle (which may be represented by the ratio between the sheet-flow layer thickness and the settling velocity) and the wave period. | |||
Although knowledge on phase lag in sheet flow has improved recently, only a few models allow for a quantitative description of this phenomenon. The formula proposed by Dibajnia and Watanabe (1992) appears to be the only one that shows a correct behavior in the sheet-flow regime (Camenen and Larroudé 2003). More recently, Dohmen-Janssen et al. (2002) proposed a correction of the sediment transport (based on the Ribberink (1998) formula if a phase lag occurs that allows for improved estimates of the net bed-load transport rate. | |||
Because sheet flow sediment transport occurs near the bed, it is often assumed that the response time of the sediment is much shorter than the wave period. However, in practice, a certain delay exists for the sand to respond to the fluid. Thus, the quantity of sediment in suspension is primarily related to the instantaneous velocity, but it also depends on the settling velocity. In oscillating flow, not all sand grains put into suspension during the first half-period are transported and settle during this period. The proportion still in suspension is then carried away in the opposite direction during the second half-period. | |||
====A simple conceptual model==== | |||
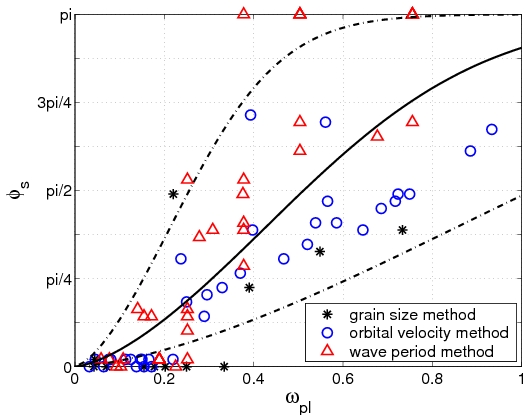
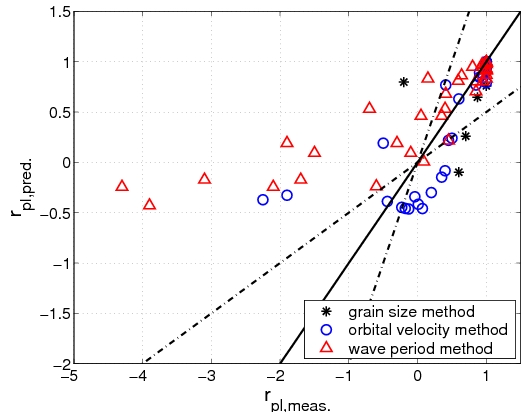
A simple conceptual model was introduced by Dohmen-Janssen (1999) to include the phase lag in sediment transport: the instantaneous bed-load transport is assumed to be proportional to the instantaneous sediment concentration at the bottom (taken constant over the sheet-flow layer) multiplied by the instantaneous horizontal velocity at the bottom. Assuming that the instantaneous sediment concentration is a function of the instantaneous velocity to the power 2, but with a possible phase lag <sub>s</sub>, the effect of this phase lag on the sediment transport may be estimated. For a sinusoidal wave, the sediment transport reduction due to a phase lag may be expressed as follows: | |||
<math>\begin{align} | |||
& {{r}_{pl1}}=\frac{{{q}_{s,net}}}{{{q}_{s,net,{{\phi }_{s}}=0}}}=\frac{\int_{0}^{{{T}_{w}}}{\left( {{r}_{u}}+\cos \omega t \right){{\left[ {{r}_{u}}+\cos \left( \omega t+{{\phi }_{s}} \right) \right]}^{2}}dt}}{\int_{0}^{{{T}_{w}}}{{{\left( {{r}_{u}}+\cos \omega t \right)}^{3}}dt}} \\ | |||
& \quad \,\ \,=\frac{r_{u}^{2}+1/2+X}{r_{u}^{2}+3/2} \\ | |||
\end{align}</math> | |||
:(101) | |||
where ''r''<sub>''u''</sub> = ''U''<sub>''c''</sub>/''U''<sub>''w''</sub>, in which ''U''<sub>''c''</sub> is the mean current averaged over the depth, and ''X'' = cos <sub>s</sub>. | |||
An analytical solution also exists for a second-order wave assuming ''u''<sub>''w''</sub>(cos ''t'' + ''r''<sub>''w''</sub> 2t) (see also Figure 33): | |||
<math>\begin{align} | |||
& {{r}_{pl2}}=\frac{\int_{0}^{{{T}_{w}}}{\left( {{r}_{u}}+\cos \omega t+{{r}_{w}}\cos 2\omega t \right)}{{\left[ {{r}_{u}}+\cos \left( \omega t+{{\phi }_{s}} \right)+{{r}_{w}}\cos 2\left( \omega t+{{\phi }_{s}} \right) \right]}^{2}}dt}{\int_{0}^{{{T}_{w}}}{{{\left( {{r}_{u}}+\cos \omega t+{{r}_{w}}\cos 2\omega t \right)}^{3}}dt}} \\ | |||
& \quad \ \,\,=\frac{r_{u}^{3}+{{r}_{u}}\left[ 1/2+X+r_{w}^{2}\left( 2{{X}^{2}}-1/2 \right) \right]+{{r}_{w}}\left( {{X}^{2}}+X-1/2 \right)/2}{r_{u}^{3}+3/2{{r}_{u}}\left( 1+r_{w}^{2} \right)+3/4\ {{r}_{w}}} \\ | |||
\end{align}</math> | |||
:(102) | |||
Equations 101 and 102 are functions only of the wave profile (i.e., of the coefficients ''r''<sub>''u''</sub> and ''r''<sub>''w''</sub>) and the phase lag of the sediment suspension <sub>''s''</sub>. Figure 31 shows the effect of the coefficients ''r''<sub>''u''</sub> and <sub>''s''</sub> in Equation 101 (''r''<sub>''w''</sub> = 0) displayed. As observed by Ribberink and Chen (1993) and Ahmed and Sato (2003), sediment transport in the direction opposite to the waves is possible for large values on <sub>s</sub> and if | |||
<math>{{r}_{u}}<\sqrt{2}/2</math> | |||
(sinusoidal waves) or | |||
<math>r_{u}^{3}+{{r}_{u}}\left( 3r_{w}^{2}-1 \right)/2-1/4{{r}_{w}}<0</math> | |||
(second-order wave). | |||
It should be noted that Equation 102 does not have a solution if the denominator | |||
<math>Den=r_{u}^{3}+3/2\ {{r}_{{}}}\left( 1+r_{w}^{2} \right)+3/4\ {{r}_{w}}=0</math> | |||
(the net sediment transport rate equals zero if no phase lag is assumed). The asymmetry factor ''r''<sub>''w''</sub> modifies the results significantly, particularly if ''Den'' is close to zero where the function diverges (Figure 32). If Equation 101 yields a minimum value for ''r''<sub>''pl''</sub> equal to -0.35, Equation 102 produces much smaller values on ''r''<sub>''pl''</sub> if the mean current is relatively weak (min(''r''<sub>''pl''</sub>) ( 0.5 when ''r''<sub>''u''</sub> = 0) and opposite to the waves (''r''<sub>''pl''</sub> ( -1.1, if ''r''<sub>''u''</sub> = 0.05, ''r''<sub>''w''</sub> = 0.20 and ''X'' = cos (<sub>''s''</sub> ( (/2). Furthermore, Equation 102 is not a symmetric function of ''r''<sub>''u''</sub> and ''r''<sub>''pl''</sub>, and it may be greater than 1 if ''Den'' < 0 and close to zero (Figure 32). | |||
{|border="2" cellspacing="0" cellpadding="4" width="100%" align="center" | |||
|align = "center"|(a) | |||
|align = "center"|(b) | |||
|- | |||
| | |||
[[Image:CR-07-1_Chapter3_19.jpg|framed|none]] | |||
| | |||
[[Image:CR-07-1_Chapter3_20.jpg|framed|none]] | |||
|}<br clear="all"> | |||
'''Figure 31. Phase-lag effect on sediment transport for sinusoidal wave with superimposed current when phase lag '''<sub>'''''s''</sub> ''''''is introduced for concentration at bottom: (a) instantaneous variation in velocity, concentration, and bed-load rate for ''''''''U'''''<sub>'''''c'''''</sub>'''/''''''''U'''''<sub>'''''w''</sub> ''''''= 0.2 and '''<sub>'''''s</sub> ''''''''''''= -0.2, <br>and (b) effect on sediment transport for varying '''<sub>'''''s''</sub> ''''''and ratio ''''''''U'''''<sub>'''''c'''''</sub>'''/''''''''U'''''<sub>'''''w'''''</sub>'''.''' | |||
{|border="2" cellspacing="0" cellpadding="4" width="100%" align="center" | |||
|align = "center"|(a) | |||
|align = "center"|(b) | |||
|- | |||
| | |||
[[Image:CR-07-1_Chapter3_21.jpg|framed|none]] | |||
| | |||
[[Image:CR-07-1_Chapter3_22.jpg|framed|none]] | |||
|}<br clear="all"> | |||
'''Figure 32. Phase-lag effects on sediment transport for second-order Stokes wave with (a) positive, or (b) negative, and adding current introducing phase lag '''<sub>'''''s</sub> ''''''''''''for concentration at bottom and with ''''''''r'''''<sub>'''''w''</sub> ''''''= 0.2.''' | |||
Dohmen-Janssen (1999) and Dohmen-Janssen et al. (2002) proposed a more complex model where the sediment concentration varies over the sheet-flow layer following an exponential law. The solution obtained is similar to Equation 101 (or Equation 102, if a 2<sup>nd</sup> order Stokes wave is used) in which ''X'' = cos <sub>''s''</sub> is replaced by a function of the phase-lag parameter ''p''<sub>''pl''</sub> defined as in Equation 93. However, the model does not allow for small values on ''r''<sub>''pl''</sub> (nor negative values) for large phase lag (the minimum value of ''r''<sub>''pl''</sub> is 0.35 for a sinusoidal wave, and it is 0.0 for a second-order Stokes wave), but may indicate a possible relationship between <sub>''s''</sub> and ''p''<sub>''pl''</sub>. | |||
====Dibajnia and Watanabe formula==== | |||
Dibajnia and Watanabe (1992) proposed a sediment transport model that accounts for the phase lag. They considered the amount of sand that is entrained during a positive half-wave cycle. They determined the part that will be transported directly by the positive velocity during the first half cycle and the part that will still be in suspension as the flow reverses and therefore transported by the negative velocity during the following half cycle (see Figure 33). The same concept was proposed for the negative half cycle. | |||
[[Image:CR-07-1_Chapter3_23.jpg|framed|none]] | |||
'''Figure 33. Notation for colinear wave and current interaction.''' | |||
Dibajnia and Watanabe (1992) assumed that phase-lag effects occur as soon as sheet flow appears. Thus, following the criterion for the inception of sheet flow developed by Dibajnia (1991, Equation 55), they proposed to use the parameter ω<sub>''pl''</sub> (Equation 54) for each half period: | |||
<math>{{\omega }_{pl,j}}=\frac{\frac{1}{2}U_{wj}^{2}}{\left( s-1 \right)g{{W}_{s}}{{T}_{wj}}}</math> | |||
:(103) | |||
where ''U''<sub>''wj''</sub> is the representative velocity for the positive or negative half period ''T''<sub>''wj''</sub>, and the subscript ''j'' should be replaced either by onshore (direction of the wave) or offshore (opposite direction to the wave). Dibajnia and Watanabe (1992) assigned the indices ''c'' for crest and ''t'' for trough, instead of onshore and offshore, respectively. According to their data, sheet flow occurs as soon as ω<sub>''pl'',''j''</sub> > 1. If no phase lag occurs, their formula is proportional to the mobility parameter for both half periods Ψ<sub>''j''</sub> (where ''U''<sub>''w''</sub> is replaced by ''U''<sub>''wj''</sub>) as Ω<sub>''j</sub> ''= ''W''<sub>''s''</sub>''T''<sub>''j''</sub>/''d''<sub>50</sub> and | |||
<math>{{{\Omega }'}_{j}}=0</math> | |||
. For the case where sheet flow is reached during both half periods, the phase-lag effects may thus be quantified as follows: | |||
<math>{{r}_{pl,DW}}={{\left[ \frac{{{T}_{wc}}{{U}_{wc}}\left( \Omega _{c}^{3}+{\Omega }'_{t}^{\,3} \right)-{{T}_{wt}}{{U}_{wt}}\left( \Omega _{t}^{3}+{\Omega }'_{c}^{\,3} \right)}{{{T}_{wc}}{{U}_{wc}}\Psi _{c}^{3}-{{Y}_{wt}}{{U}_{wt}}\Psi _{t}^{3}} \right]}^{0.55}}</math> | |||
:(104) | |||
where subscript ''c'' indicates crest and ''t'' trough, and: | |||
<math>{{\Omega }_{J}}=\max \left( {{\omega }_{pl,j}},1 \right)\frac{{{W}_{s}}{{T}_{j}}}{{{d}_{50}}}\text{ and }{{{\Omega }'}_{j}}=\left( {{\omega }_{pl,j}}-1 \right)\frac{{{W}_{s}}{{T}_{j}}}{{{d}_{50}}}</math> | |||
:(105) | |||
Dibajnia and Watanabe (1992) slightly modified their formula to take into account the phase lag occurring in the ripple regime by introducing the parameter ω<sub>''cr''</sub>. Thus, phase lag occurs if ω<sub>''pl'',''j''</sub> > ω<sub>''cr''</sub>, where ω<sub>''cr</sub> ''= 1 for the sheet-flow regime, and ω<sub>''cr''</sub> = 0.03 for the ripple regime. | |||
====Modification of Camenen and Larson formula for phase lag==== | |||
Following Dibajnia and Watanabe (1992), a modification of the Camenen and Larson (2005a, b) formula is proposed to take the phase lag into account. This formula is based on the "bed-shear stress concept" (function of the Shields parameter) and allows sediment transport in the direction of the wave using characteristic values on the Shields parameter for both half periods: θ<sub>''cw'',''onshore''</sub> (> 0) and θ<sub>''cw'',''offshore''</sub> (< 0). These parameters correspond to the mean value of the instantaneous Shields parameter | |||
<math>{{\theta }_{cw}}\left( t \right)=1/2{{f}_{cw}}\left( {{U}_{c}}\cos \varphi +{{u}_{w}}\left( t \right) \right)\left| {{U}_{c}}\cos \right.\varphi +{{u}_{w}}\left( t \right)\left| /\left( \left( s-1 \right)g{{d}_{50}} \right) \right.</math> | |||
over each half period where ( ''i''s the angle between the wave and current directions, and ''f''<sub>''cw''</sub> is obtained using the Madsen and Grant (1976) relationship (Equation 96). Thus, the net sediment transport depends on the factor θ<sub>''cw'',''net''</sub> = θ<sub>''cw'',''onshore''</sub> + θ<sub>''cw'',''offshore''</sub>. In the wave direction, the bed-load sediment transport may be expressed as follows (compare with Equation 99): | |||
<math>{{\Phi }_{w}}={{a}_{w}}\frac{{{\theta }_{cw,net}}}{\sqrt{\left| {{\theta }_{cw,net}} \right|}}{{\theta }_{cw,m}}\exp \left( -b\frac{{{\theta }_{cr}}}{{{\theta }_{cw}}} \right)</math> | |||
:(106) | |||
where ''a''<sub>''w''</sub> and ''b'' are coefficients, and θ<sub>''cw'',''m''</sub>, θ<sub>''cw''</sub>, and θ<sub>''cr''</sub> are the mean values of the absolute instantaneous Shields parameter, the maximum Shields parameter, and the critical Shields parameter for the inception of motion, respectively. | |||
The sediment phase lag is introduced in the formula by assuming that values of the Shields parameter for both half periods are modified due to this effect. A decrease in θ<sub>''cw'',''onshore''</sub> and an increase in θ<sub>''cw'',''offshore''</sub> appear if the critical velocity for inception of sheet flow is reached: | |||
<math>{{\theta }_{cw,net}}=\left( 1-{{\alpha }_{pl,b}} \right){{\theta }_{cw,onshore}}+\left( 1+{{\alpha }_{pl,b}} \right){{\theta }_{cw,offshore}}</math> | |||
:(107) | |||
in which <sub>''pl,b''</sub> = <sub>''onshore''</sub> - <sub>''offshore''</sub> and: | |||
<math>{{\alpha }_{j}}=\frac{{{\nu }^{0.25}}U_{wj}^{0.5}}{{{W}_{s}}{{T}_{j}}^{0.75}}\exp \left[ -{{\left( \frac{{{U}_{w,cr,sf}}}{{{U}_{cwj}}} \right)}^{2}} \right]</math> | |||
:(108) | |||
where ''U''<sub>''cwj''</sub> is the root-mean-square value of the velocity (waves and current combined) over the half period ''T''<sub>''wj''</sub>, and the subscript ''j'' should be replaced either by ''onshore'' or ''offshore''. The effect of the main parameters (i.e., ''U''<sub>''cwj''</sub>, ''T''<sub>''j''</sub>, and ''W''<sub>''s''</sub>) was examined, and they were calibrated based on the compiled data set. The exponential function, describing the effect of the critical velocity on the inception of sheet flow, is proposed to allow a possible error in the estimation of ''U''<sub>''w,cr'',''sf''</sub> (''U''<sub>''w,cr,sf''</sub> is calculated following Equation 57), i.e., | |||
<math>{{\alpha }_{j}}\ne 0</math> | |||
even if ''U''<sub>''cwj''</sub> is slightly lower than ''U''<sub>''w,cr'',''sf''</sub>. Strictly, ''U''<sub>''w,cr'',''sf''</sub> should be compared to a maximum value of the velocity and not to a quadratic mean value. However, the results would only be modified by a constant factor in the exponential function, changing the fit of the empirical function α<sub>''j''</sub>. Thus, the coefficient quantifying the phase lag may be written as follows: | |||
<math>{{r}_{pl,CL}}={{\left[ \frac{\left( 1-{{\alpha }_{pl,b}} \right){{\theta }_{w,onshore}}+\left( 1+{{\alpha }_{pl,b}} \right){{\theta }_{w,offshore}}}{{{\theta }_{w,onshore}}+{{\theta }_{w,offshore}}} \right]}^{0.5}}</math> | |||
:(109) | |||
====Experimental data==== | |||
To investigate phase-lag effects on bed-load transport under waves and current, data sets from OWT experiments covering a wide range in values were compiled and analyzed. This kind of experiment has several advantages for the present study: large orbital velocities can be reached, bed-load transport prevails, and a strong phase lag is often observed. Table 10 summarizes the data sets employed, where the type of experiment, sediment characteristics, and wave properties are listed. | |||
'''Table 10. Summary of data on bed-load sediment transport in full-cycle oscillatory flow. ''' | |||
{|border="2" cellspacing="0" cellpadding="4" width="100%" align="center" | |||
|'''Author(s)''' | |||
|'''Number''' | |||
|'''''s''''' | |||
|'''''d'''''<sub>'''50<br>(mm)'''</sub> | |||
|'''''U'''''<sub>'''''c<br>'''''</sub>'''(m/sec)''' | |||
|'''''U'''''<sub>'''''w,max''</sub><br>''''''(m/sec)''' | |||
|'''''T'''''<sub>'''''w''</sub> <br>''''''(sec)''' | |||
|- | |||
|Watanabe & Isobe (1990) | |||
|65 | |||
|2.65 | |||
|0.18, 0.87 | |||
|<nowiki>-</nowiki>0.3 - 0.25 | |||
|0.27-0.52 | |||
|3.0, 6.0 | |||
|- | |||
|Dibajnia & Watanabe (1992) | |||
|76 | |||
|2.65 | |||
|0.20 | |||
|<nowiki>-</nowiki>0.26 - 0.22 | |||
|0.61-1.24 | |||
|1.0-4.0 | |||
|- | |||
|Ribberink & Chen (1993) | |||
|4 | |||
|2.65 | |||
|0.128 | |||
|< 0.05 | |||
|0.6-1.2 | |||
|6.5 | |||
|- | |||
|Ribberink & Al Salem (1994) | |||
|30 | |||
|2.65 | |||
|0.21 | |||
|<nowiki>-</nowiki>0.11 - 0.56 | |||
|0.37-1.37 | |||
|5.0-12.0 | |||
|- | |||
|Delft Hydraulics (1994-1999; see Van Rijn et al. 2001) | |||
|22 | |||
|2.65 | |||
|0.13-0.24 | |||
|<nowiki>-</nowiki>0.45 - 0.47 | |||
|0.46-1.49 | |||
|4.0-12.0 | |||
|- | |||
|Dohmen-Janssen (1999) | |||
|27 | |||
|2.65 | |||
|0.13-0.32 | |||
|0.23-0.45 | |||
|0.46-1.85 | |||
|4.0-12.0 | |||
|- | |||
|Ahmed & Sato (2003) | |||
|15 | |||
|2.65 | |||
|0.21-0.74 | |||
|<nowiki>-</nowiki> | |||
|1.16-1.85 | |||
|3.0 | |||
|}<br clear="all"> | |||
====Calibration of conceptual model==== | |||
Calibration of the conceptual model is not as easy as the modification of the Camenen and Larson (2005a, b) formula. Indeed, it is difficult to estimate what the sediment transport rate would have been without phase-lag effects. Three methods are proposed to estimate ''r''<sub>''pl''</sub> following Camenen and Larroudé (2003) by using a sensitivity analysis of the different parameters. Thus, as soon as no phase lag occurs, bed load might be: | |||
* Independent of median grain size. | |||
* Independent of wave period. | |||
* Proportional to velocity moment to the power 3. | |||
Using experimental data where all the parameters are fixed except the median grain size (or the wave period), it is possible to estimate ''r''<sub>''pl''</sub> assuming ''r''<sub>''pl''</sub> = 1 for larger values of ''d''<sub>50</sub> (or ''T''<sub>''w''</sub>), i.e., | |||
<math>{{q}_{s,net}}={{q}_{s,net,{{\phi }_{s}}}}=0</math> | |||
. For the third method, the relationship between the bed-load rate and the velocity moment to the power 3 is assumed exact, if ''U''<sub>''w''</sub> is small. A curve proportional to | |||
<math><{{u}^{3}}></math> | |||
is fitted to the experimental value of ''q''<sub>''s'',''net''</sub> where the measured value of ''U''<sub>''w''</sub> is the smallest, and compared to the other experimental values of ''q''<sub>''s'',''net''</sub> where ''U''<sub>''w''</sub> is higher (and where phase-lag effects are expected). | |||
In total, 85 data values were derived using these three methods. It should be noted that several values do not have a solution by Equation 102; the estimated value of ''r''<sub>''pl''</sub> was found to be smaller than the minimum value obtained by the model (min (''r''<sub>''pl''</sub>) -0.5 when ''r'' = 0). In these cases, the <sub>''s''</sub> value corresponding to the minimum of ''r''<sub>''pl''</sub> was used. This illustrates the limitations of the conceptual model. However, these errors may also be induced by some limitations in the experimental set-up. Indeed, for some data from the Dibajnia (1991) experiment, ''r''<sub>''pl''</sub> reaches -5. As discussed previously, the piston generated additional vortices for the shortest wave periods that induced more suspension, and thus artificially increased the phase-lag effect. | |||
It seems that <sub>''s''</sub> is well described by the parameter ω<sub>''pl'' </sub>(Equation 54) introduced by Dibajnia (1991), using ''U''<sub>''w''</sub> and ''T''<sub>''w''</sub> instead of ''U''<sub>''wj''</sub> and ''T''<sub>''wj''</sub>. The following empirical relationship is proposed (curve in Figure 34(a)): | |||
<math>{{\phi }_{s}}=\pi \tanh \left( 1.5\omega _{pl}^{1.5} \right)</math> | |||
:(110) | |||
{|border="2" cellspacing="0" cellpadding="4" width="100%" align="center" | |||
|align = "center"|(a) | |||
|align = "center"|(b) | |||
|- | |||
| | |||
[[Image:CR-07-1_Chapter3_24.jpg|framed|none]] | |||
| | |||
[[Image:CR-07-1_Chapter3_25.jpg|framed|none]] | |||
|}<br clear="all"> | |||
'''Figure 34. Calibration of conceptual model against data.''' | |||
Figure 34(a) plots the points obtained for <sub>''s''</sub> from the three different methods against ω<sub>''pl''</sub>. Although significant scatter is observed, most of the data are correctly predicted by Equation 110 (solid line; the dashed lines correspond to Equation 110 with | |||
<math>{{{\omega }'}_{pl}}</math> | |||
= 0.5 ω<sub>''pl''</sub> and 2ω<sub>''pl''</sub>). Figure 34(b) shows a comparison between the observed and predicted values on ''r''<sub>''pl''</sub> from the experiment (using Equations 102 and 110). The factor ''r''<sub>''pl''</sub> is generally well predicted; it should be remembered that large uncertainties are induced through the calculation of ''r''<sub>''pl''</sub>. Even if large underestimation occurs for extreme cases (from the wave period method) where ''r''<sub>''pl''</sub> < -0.5, the general tendency obtained by Equations 102 and 110 is encouraging. | |||
====Influence of median grain size==== | |||
Strong phase-lag effects were first observed for fine sand (''d''<sub>50</sub> = 0.2 mm, Dibajnia 1991; ''d''<sub>50</sub> = 0.13 mm, Ribberink and Chen 1993), where a net sediment transport opposite to the direction of the waves (and mean current) was observed. The specific study on grain-size influence on sediment transport in oscillatory sheet flow by Dohmen-Janssen (1999) clearly showed that the finer the sand is the larger the phase lag might be. The phase-lag parameter (''p''<sub>''pl''</sub>, Equation 93) is inversely related to the settling velocity. An increasing sediment transport rate with increasing grain size is clearly observed in Figure 35(a). Bed-load formulas are in general not sensitive to the grain size, with a slight proportionality for coarser sand (see also Camenen and Larroudé 2003). The effect of the phase lag is significant for both the Dibajnia and Watanabe (1992) and the modified Camenen and Larson (2005b) formulas when ''d''50 < 0.3 mm. The previous study by Watanabe and Isobe (1990) showed similar results for smaller wave periods (''T''<sub>''w''</sub> = 3 sec). For coarser grain size, the Dibajnia and Watanabe (1992) formula predicts a decrease in bed-load transport (induced by the varying ω<sub>''cr''</sub>) that is not observed experimentally. | |||
The effect of grain size on the phase lag was introduced in the Camenen and Larson (2005b) formula through the settling velocity of the coefficients α<sub>''j''</sub> were found to be proportional to | |||
<math>W_{s}^{-1.0}</math> | |||
. | |||
[[Image:CR-07-1_Chapter3_26_1024.png|framed|none]] | |||
'''Figure 35. Influence of grain size on bed load sediment transport (details of input parameters for cases a and b are given in Table 11).''' | |||
'''Table 11. Experimental conditions for studied cases on median grain size effect. ''' | |||
{|border="2" cellspacing="0" cellpadding="4" width="93%" align="center" | |||
|'''Case''' | |||
|'''Data Set''' | |||
|'''''h'' ''''''(m)''' | |||
|'''''U'''''<sub>'''''c''</sub> ''''''(m/sec)''' | |||
|'''''U'''''<sub>'''''w</sub> ''''''''''''(m/sec)''' | |||
|'''''T'''''<sub>'''''w''</sub> ''''''(sec)''' | |||
|'''''r'''''<sub>'''''w''</sub> ''''''(-)''' | |||
|- | |||
|(a) | |||
|Dohmen-Janssen | |||
|0.80 | |||
|0.24 | |||
|1.08 | |||
|7.2 | |||
|0.00 | |||
|- | |||
|(b) | |||
|Watanabe & Isobe | |||
|0.31 | |||
|0.00 | |||
|0.69 | |||
|3.0 | |||
|0.20 | |||
|}<br clear="all"> | |||
====Influence of wave orbital velocity==== | |||
The phase-lag effect is proportional to the wave orbital velocity, and the higher ''U''<sub>''w''</sub> is, the larger the amount of sediment put in suspension (the available energy is greater) and the larger the sheet flow layer thickness (δ<sub>''s''</sub>). This implies a larger delay between the instantaneous concentration and the shear stress and fluid velocity. However, the experiments by Dohmen-Janssen (1999) do not show the effect of the wave orbital velocity clearly. Nevertheless, by comparing plots (Figure 36(a), (b)) it may be observed that the increase in the sediment transport rate with ''U''<sub>''w''</sub> is much slower for ''d''50 = 0.13 mm (Figure 36(a)) compared to ''d''50 = 0.21 mm. Al Salem (1993) observed that the sediment transport is approximately proportional to the velocity moment to the power 3 (for a sinusoidal wave together with a current, | |||
<math><{{u}^{3}}>=U_{c}^{3}+{{U}_{c}}U_{w}^{2}</math> | |||
). If this relationship is applied to the data (Figure 36(b)) (i.e., | |||
<math>{{q}_{s}}\ \propto \ U_{w}^{2}</math> | |||
), it is found not to hold for case (a) where | |||
<math>{{q}_{s}}\ \propto \ U_{w}^{1.4}</math> | |||
. For the experiments of Ribberink and Chen (1993) and Ahmed and Sato (2003), where the current was negligible (Figure 36(c) and (d)), the effect of the wave orbital velocity is obvious because the direction of the sediment transport changes with an increasing ''U''<sub>''w''</sub>. | |||
The Dibajnia and Watanabe (1992) formula, as well as the Camenen and Larson (2005b) formula with the coefficient ''r''<sub>''pl''2</sub> (Equations 102 and 110), tends to be overly sensitive to the wave orbital velocity. Occasionally a decrease in the net sediment transport rate with an increasing wave orbital velocity is estimated, whereas the opposite behavior is observed in the experiment (Figure 36(a) and (b)). However, it seems like the sheet-flow layer and the associated phase-lag effects appear quite abruptly. Thus, predictive formulas are in general difficult to calibrate. | |||
[[Image:CR-07-1_Chapter3_27_1024.png|framed|none]] | |||
'''Figure 36. Influence of wave orbital velocity on sediment transport (values of input parameters for cases a, b, c, and d are given in Table 12).''' | |||
'''Table 12. Experimental conditions for studied cases on wave orbital velocity effects. ''' | |||
{|border="2" cellspacing="0" cellpadding="4" width="91%" align="center" | |||
|'''Case''' | |||
|'''Data Set''' | |||
|'''''d'''''<sub>'''50</sub> ''''''(mm)''' | |||
|'''''h (m)''''' | |||
|'''''U'''''<sub>'''''c</sub> ''''''''''''(m/sec)''' | |||
|'''''T'''''<sub>'''''w''</sub> ''''''(sec)''' | |||
|'''''r'''''<sub>'''''w''</sub> ''''''(-)''' | |||
|- | |||
|(a) | |||
|Dohmen-Janssen | |||
|0.13 | |||
|0.80 | |||
|0.24 | |||
|7.2 | |||
|0.00 | |||
|- | |||
|(b) | |||
|Dohmen-Janssen | |||
|0.21 | |||
|0.80 | |||
|0.40 | |||
|7.2 | |||
|0.00 | |||
|- | |||
|(c) | |||
|Ahmed & Sato | |||
|0.21 | |||
|0.31 | |||
|0.00 | |||
|3.0 | |||
|0.20 | |||
|- | |||
|(d) | |||
|Ribberink & Chen | |||
|0.13 | |||
|0.80 | |||
|0.03 | |||
|6.5 | |||
|0.25 | |||
|}<br clear="all"> | |||
The effect of the wave orbital velocity on the phase lag was introduced in the Camenen and Larson (2005b) formula through the root-mean-square values of the velocity ''U''<sub>''wj''</sub> (wave and current) for each half-period ''T''<sub>''wj''</sub>. The coefficients α<sub>''j''</sub> were found to be proportional to | |||
<math>U_{wj}^{0.5}</math> | |||
. | |||
====Influence of wave period==== | |||
The wave period is also a controlling factor for the phase lag and its effects on sediment transport: the shorter ''T''<sub>''w''</sub> is, the larger the amount of sediment still in suspension after half a period. Indeed, the delay in sediment settling before the change in the velocity direction strongly depends on the wave period. The two experiments by Dohmen-Janssen (1999) (with ''d''<sub>50</sub> = 0.13 and 0.21 mm; Figure 37(a) and (b), respectively) clearly show an increase in sediment transport rate with an increase in wave period as soon as sheet flow occurs. A bed-load formula based on the shear stress displays an inverse behavior, because the friction coefficient ''f''<sub>''w''</sub> is inversely proportional to the wave period (because the boundary layer is getting thinner). The modified Camenen and Larson (2005b) formula exhibits the correct behavior, although the effect of ''f''<sub>''w''</sub> sometimes remains larger than the introduced phase-lag parameter (Figure 37(b)). The experiments by Dibajnia (1991) (Figure 37(c) and (d)) illustrate how strong the effect of short wave periods can be. A change in the sediment transport direction for ''T''<sub>''w''</sub> 2 sec (sediment transport was observed to be in the direction of the waves for ''T''<sub>''w'' </sub>= 4 sec and ''U''<sub>''c''</sub> > -0.2 m/sec). However, this effect may be overestimated due to the limitations of the experimental set-up. Dibajnia (1991) pointed out that the piston used in his experiment could not smoothly follow the input signal for periods ''T''<sub>''w''</sub> 1.5 sec. The generated vortex caused larger suspension and increased the phase-lag effects more than what normally should occur. | |||
The Dibajnia and Watanabe (1992) and Camenen and Larson (2005b) formulas predict a negative sediment transport rate even for higher values on the wave period (Figure 37(c)). If a slight phase lag tends to decrease the absolute value of the sediment transport rate for the Dibajnia and Watanabe (1992) formula, it increases the rate for the modified Camenen and Larson (2005b) formula. This latter behavior agrees better with the measurements. However, even if it is difficult to verify the behavior with the present data, it seems like the Camenen and Larson (2005b) formula (Equations 99 and 107) is too sensitive to the wave period. In spite of this, except for case 3, the Camenen and Larson (2005b) formula with the calibrated conceptual model (Equations 101 and 110) presents better behavior than the other formulas with respect to variations in ''T''<sub>''w''</sub>. | |||
The effect of the wave period on the phase lag was introduced in the Camenen and Larson (2005b) formula through the half-periods ''T''<sub>''wj''</sub>, and the coefficients α<sub>''j''</sub> were found to be proportional to | |||
<math>T_{wj}^{-0.75}</math> | |||
. | |||
[[Image:CR-07-1_Chapter3_28_1024.png|framed|none]] | |||
'''Figure 37. Influence of wave period on sediment transport (details of input parameters for cases a, b, c, and d are given in Table 13).''' | |||
'''Table 13. Experimental conditions for studied cases on wave period effects (for Dibajnia experiments, maximum onshore wave orbital velocity is <br>approximately constant). ''' | |||
{|border="2" cellspacing="0" cellpadding="4" width="93%" align="center" | |||
|'''Case''' | |||
|'''Data Set''' | |||
|'''''d'''''<sub>'''50</sub> ''''''(mm)''' | |||
|'''''h'' ''''''(m)''' | |||
|'''''U'''''<sub>'''''c</sub> ''''''''''''(m/sec)''' | |||
|'''''U'''''<sub>'''''w''</sub> ''''''(m/sec)''' | |||
|'''''r'''''<sub>'''''w''</sub> ''''''(-)''' | |||
|- | |||
|(a) | |||
|Dohmen-Janssen | |||
|0.13 | |||
|0.80 | |||
|0.25 | |||
|1.06 | |||
|0.00 | |||
|- | |||
|(b) | |||
|Dohmen-Janssen | |||
|0.21 | |||
|0.80 | |||
|0.25 | |||
|1.06 | |||
|0.00 | |||
|- | |||
|(c) | |||
|Dibajnia | |||
|0.20 | |||
|0.22 | |||
|<nowiki>-</nowiki>0.125 | |||
|0.80 | |||
|0.20 | |||
|- | |||
|(d) | |||
|Dibajnia | |||
|0.20 | |||
|0.22 | |||
|0.125 | |||
|0.80 | |||
|0.20 | |||
|}<br clear="all"> | |||
====Comparison with all data==== | |||
A comparison with all the data is presented in this section. Figure 38 and Table 14 display the overall results shown for the original Camenen and Larson (2005b) formula (Figure 38(a)), the Dibajnia and Watanabe (1992) formula (Figure 38(b)), the Camenen and Larson (2005b) formula (Equations 99 and 107 and Figure 38(c)), and the Camenen and Larson (2005b) formula with the coefficient ''r''<sub>''pl''</sub> (Equations 102 and 110 and Figure 38(d)). It clearly shows how significanat the introduction of phase lag in the formulas is. Even if the overall results (in terms of predictive skill within a factor 2, ''Px''2, or 5, ''Px''5) are not substantially improved (except for the modified Camenen and Larson (2005b) formula where results are improved by 10 percent), the general behavior of the formulas are better, and a significant decrease in the standard deviation of Δ''q''<sub>''s''</sub> is obtained. | |||
It appears that the Dibajnia and Watanabe (1992) formula and the Camenen and Larson (2005b) formula with the coefficient ''r''<sub>''pl''</sub> tend to underestimate the absolute sediment transport rate if a phase lag occurs. However, the coefficient ''r''<sub>''pl''</sub> (Equation 102) is sensitive to the wave asymmetry if the current is negligible. Figures 35 to 37 reveal that the Dibajnia and Watanabe (1992) formula and Camenen and Larson (2005b) formula with the coefficient ''r''<sub>''pl''</sub> do not induce any change below a critical value (of ω<sub>''pl''</sub>), and then tend to abruptly decrease the sediment transport rate. On the other hand, the modified Camenen and Larson (2005b) formula produces a more gradual modification of the sediment transport rate compared to the original formula (except with regard to the wave period), which seems closer to the trend in measurements. | |||
Finally, a comparison was made using the Camenen and Larson (2005b) formula with the parameter ''r''<sub>''pl''</sub> proposed by Dohmen-Janssen et al. (2002) with δ<sub>''s'' </sub>= α<sub>s </sub>θ<sub>''cw''</sub> ''d''<sub>50</sub> (where α<sub>''s''</sub> is a function of ''d''<sub>50</sub>: α<sub>''s'' </sub>= 13 when ''d''<sub>50</sub> > 2.1 mm, and α<sub>''s''</sub> = 35 when ''d''<sub>50</sub> = 1.3 mm). Similar to Equation 102, it improves the results if a phase lag occurs. However, the effects are often not strong enough because this analytical formula does not allow for sediment transport in the opposite direction, as was observed in the Ribberink and Chen (1993) and the Ahmed and Sato (2003) experiments. | |||
{|border="2" cellspacing="0" cellpadding="4" width="100%" align="center" | |||
|align = "center"|(a) | |||
|align = "center"|(b) | |||
|- | |||
| | |||
[[Image:CR-07-1_Chapter3_29.jpg|framed|none]] | |||
| | |||
[[Image:CR-07-1_Chapter3_30.jpg|framed|none]] | |||
|- | |||
|align = "center"|(c) | |||
|align = "center"|(d) | |||
|- | |||
| | |||
[[Image:CR-07-1_Chapter3_31.jpg|framed|none]] | |||
| | |||
[[Image:CR-07-1_Chapter3_32.jpg|framed|none]] | |||
|}<br clear="all"> | |||
'''Figure 38. Comparison between predicted and measured sediment transport rate using (a) original Camenen and Larson formula, (b) Dibajnia and Watanabe formula, <br>(c) modified Camenen and Larson formula (Equations 99 and 107), and <br>(d) Camenen and Larson formula with coefficient ''''''''r'''''<sub>'''''pl''''''''2</sub> ''''''(Equations 102 and 110).''' | |||
'''Table 14. Prediction of bed-load transport rate within factor of 2 or 5 of measured values, together with mean value and standard deviation of Δ''''''''q'''''<sub>'''''s''''''''</sub><sub>'</sub>'''. ''' | |||
{|border="2" cellspacing="0" cellpadding="4" width="94%" align="center" | |||
|'''Author(s)''' | |||
|'''''Px''''''''2 (%)''' | |||
|'''''Px''''''''5 (%)''' | |||
|<br>'''<math>\overline{\Delta {{q}_{s}}}</math>'''<br> | |||
|'''Std (''''''''q'''''<sub>'''''s'''''</sub>''')''' | |||
|- | |||
|Dibajnia and Watanabe (1992) | |||
|42 | |||
|75 | |||
|+0.11 | |||
|7.0 | |||
|- | |||
|Camenen and Larson (2005b) | |||
|47 | |||
|72 | |||
|+0.22 | |||
|9.8 | |||
|- | |||
|Equations 99 and 107 | |||
|53 | |||
|81 | |||
|<nowiki>-</nowiki>0.37 | |||
|4.5 | |||
|- | |||
|Camenen and Larson (2005b) with Equations 102 & 110 | |||
|50 | |||
|74 | |||
|<nowiki>-</nowiki>0.003 | |||
|7.0 | |||
|- | |||
|Camenen and Larson (2005b) with Dohmen-Janssen et al. equation (2002) for ''r''<sub>''pl''</sub> | |||
|48 | |||
|71 | |||
|<nowiki>-</nowiki>0.003 | |||
|6.8 | |||
|}<br clear="all"> | |||
====Concluding remarks on phase-lag effects==== | |||
In the present study, a large data set on sheet-flow transport was compiled and analyzed to improve the prediction of the bed-load transport rate if a phase-lag effect occurs. A simple conceptual model was proposed as well as a modification of the Camenen and Larson (2006) formula. This modification was suggested by the Dibajnia and Watanabe (1992) formula, which is the first and only formula found that takes into account the phase lag between the sediment transport rate and fluid velocity. | |||
The conceptual model for the correction of the sediment transport rate is based on the work by Dohmen-Janssen (1999), who assumed that the sediment transport is proportional to the product of the instantaneous velocity and concentration. In turn, the instantaneous concentration is assumed to depend on the square of the instantaneous velocity with a phase lag <sub>s</sub> > 0. This simple model allows a ratio | |||
<math>{{r}_{pl}}={{q}_{s,net}}={{q}_{s,net,{{\phi }_{s}}}}=0</math> | |||
to be derived that can reach -0.35 for a sinusoidal wave and -0.5 for a second-order Stokes wave. However, for a second-order Stokes wave, the model may diverge if the prediction is equal to zero without the phase-lag effects. The phase lag (<sub>''s''</sub> was calibrated against data, and (<sub>''s''</sub> was found to be a function of the parameter ω<sub>''pl''</sub> proposed by Dibajnia (1991). Even if significant scatter is observed, this function improves the behavior of the Camenen and Larson (2005b) formula markedly, and it is applicable to any other sediment transport formula. It also shows somewhat improved results compared to the analytical model by Dohmen-Janssen et al. (2002). | |||
A modification of the Camenen and Larson (2005b) formula was also proposed (Equations 107 and 108). It assumes that the characteristic Shields parameters for each half period θ<sub>''cw'',''onshore''</sub> (> 0) and θ<sub>''cw'',''offshore''</sub> (< 0) are modified if the sheet flow is reached. A decrease of | |||
<math>{{\alpha }_{pl}}%=\left( {{\alpha }_{c}}-{{\alpha }_{t}} \right)%</math> | |||
on | |||
<math>\left| {{\theta }_{w,onshore}} \right|</math> | |||
and an increase of α<sub>''pl''</sub>% on | |||
<math>\left| {{\theta }_{w,offshore}} \right|</math> | |||
introduce a general decrease in the net sediment transport rate, and it may also change the direction of the sediment transport. The coefficients α<sub>''j''</sub> (''j'' = ''c'' or ''t'') were calibrated with the compiled data and were found to be proportional to the root-mean-square velocity over the half period and inversely proportional to the settling velocity and the half period ''T''<sub>''wj''</sub>. These coefficient values are similar to those proposed by Dibajnia (1991, ω<sub>''pl''</sub>) and Dohmen-Janssen (1999, ''p''<sub>''pl''</sub>). The new formula presents the best overall agreement with the data (Camenen and Larson 2006). | |||
Revision as of 15:08, 13 July 2009
Introduction
Accurate prediction of sediment transport rates is an essential element in morphological studies of coastal, marine, and river environments. Sediment transport mainly occurs in two modes: bed load and suspended load. The bed load is the part of the total load that is traveling directly above the bed and is supported by intergranular collisions rather than fluid turbulence (Wilson 1966). The suspended load, on the other hand, is the part of the load which is primarily supported by the fluid turbulence (Fredsøe and Deigaard 1994). Thus, bed load includes mainly sediment transport for coarse materials (saltation) or fine material on plane beds (saltation at low shear stresses and sheet flow at high shear stresses), although both types of transport can occur together and the limit is not always easy to define. The earliest formulas (models) proposed to estimate bed-load transport were mainly based on the concept that the sediment transport rate can be related to the bottom shear stress (Meyer-Peter and Müller 1948; Einstein 1950) and these formulas were valid for steady, unidirectional flows. In coastal and marine environments, the process of sediment transport becomes increasingly complex due to the presence of oscillatory flows, and the interaction between steady and oscillatory flows. For example, in longshore sediment transport, the influence of the short waves is expressed through wave-induced sediment stirring that increases the bed shear stress (Bijker 1967, 1968; Watanabe 1982; Van Rijn 1993).
However, in the case of cross-shore sediment transport, a wave-averaged approach is not adequate because of the dominant role of the time-dependent oscillatory orbital motion near the sea bed, induced by the short waves. For example, the residual cross-shore transport of sand due to short-wave asymmetry is generally described using an intrawave model concept, resolving the unsteady transport process through the wave cycle. Bagnold (1966) developed an "energetics transport model" in which the instantaneous transport through the wave cycle is related to the instantaneous energy dissipation rate due to bottom friction. Bagnold's (1966) approach has formed the basis for several bed-load transport models (Bailard and Inman 1981; Ribberink 1998) as well as total load transport models (Bailard 1981; Madsen and Grant 1976). These models use the bed-shear stress concept for river flow, and time-dependent transport through the wave cycle is treated in a quasi-steady way. That is, time-history effects from previous phases of the wave cycle or from previous wave cycles are neglected.
The development of practical sediment transport models still has a strong empirical character and relies on physical insights and quantitative data obtained in laboratory and field studies. The objective of this study is to develop a reliable, robust, and general formula for predicting bed-load transport for a wide range of coastal, marine, and river conditions. Many data sets are incorporated in the model development including steady and unsteady (oscillatory) flows.
For the bed-shear stress concept, a major problem is to estimate the total shear stress at the bottom. As a first step in this study, only conduit, flume, and river data for steady flows over a plane bed were examined to implement the bed-load formula. For these kinds of experimental studies, the bed shear stress may be estimated from energy slope measurements. Then, the formula was generalized to oscillatory flows and combined steady and oscillatory flows. However, for these more complex flows, the bed shear stress cannot be estimated directly from the measurements, but the stress must be calculated from theoretical models of the bed roughness. Thus, comparisons with experimental data were made by means of the skin friction as proposed by Soulsby (1997) and a semi-empirical function to estimate the bottom roughness in the sheet flow regime from Wilson (1989a).
Previous studies on bed-load transport under wave and current interaction
The bed-load transport corresponds to the net flux near the bottom, which then includes bed load and sheet-flow transport. Many studies (analytic and experimental) have been performed for bed-load and sheet-flow transport, which are often related to the bottom shear stress.
This section presents several sediment transport formulas that include both current and wave effects.
1. The Bijker (1968) and Van Rijn (1984a, b, 1989) formulas. The formulation of bed-load transport comes from a method used in the river environment and adapted to the coastal environment.
2. The Bailard (1981) bed-load formula, which involves an energetics description of sediment transport due to waves.
3. The Dibajnia and Watanabe (1992) sheet-flow formula, which is based on the instantaneous velocity taking into account wave and current interaction and the associated induced movement of sediment (calibrated with experiments on sheet-flow transport).
4. The Ribberink (1998) formula. Bed-load transport rate is estimated by integrating the instantaneous bed-load rate qsb(t) over a wave period.
Bijker formula
One of the first formulas for bed-load transport that is still often applied was proposed by Bijker (1967, 1968). It was derived from the Frijlink (1952) formula for current only with a modification of the bottom shear stress using a wave-current model. The direction of sediment fluxes is always that of the current because this formula is proposed to estimate the longshore transport rate. The Bijker formula is written:
- (59)
where qsb is the sediment volume flux for bed load, Cb a breaking wave parameter, c the ripple parameter, τc the shear stress due to current only, and τcw the shear stress including the wave-current interaction.
The ripple parameter introduced by Bijker (1968) is defined by the following equation:
- (60)
where fct is the total friction coefficient due to the current and fc the skin friction coefficient due to the current. The breaking wave coefficient is defined by the following relationships:
- (61)
where Hw is the wave height. The shear stress arising from the wave-current interaction is computed following the method proposed by Bijker (1968) where the effect of the waves is described through a stirring factor:
- (62)
where
is a parameter for wave-current interaction and fwt the total friction coefficient due to waves.
Bailard formula
Bagnold (1966) introduced an energetics model for sediment transport, where the main idea is that the solid flux is proportional to the energy flux (local rate of energy dissipation):
- (63)
- (64)
where Ω is the energy flux from waves and currents, fcw the friction coefficient due to the waves and current combined, u(t) the instantaneous velocity vector, in which u(t) = Uc + uw(t) with Uc being the current velocity averaged over the depth and uw(t) the instantaneous wave velocity.
The Bailard and Inman (1981) formula was derived from Bagnold (1966) model concepts. It can take into account the effect of the instantaneous velocity profile from waves and current combined. For a horizontal bed, the formula can be written as a vector yielding the sediment volume transport:
Failed to parse (SVG with PNG fallback (MathML can be enabled via browser plugin): Invalid response ("Math extension cannot connect to Restbase.") from server "https://en.wikipedia.org/api/rest_v1/":): {\displaystyle {{\vec{q}}_{sb}}= & \frac{1}{2}\frac{{{f}_{cw}}}{g\left( s-1 \right)}\frac{{{\varepsilon }_{b}}}{\tan \varphi }\left. < \right|{{\left. {\vec{u}} \right|}^{2}}\vec{u}>}
- (65)
where b is the bed-load efficiency, and < > represents the average over several wave periods. The bed-load efficiency is slightly different from the one given by Bagnold (1966). Bailard (1981) suggested based on calibration against field data that b = 0.1. One difficulty concerning the formula is to estimate the friction coefficient for waves and current combined. Bailard did not specify any expression for the friction coefficient. Indeed, friction coefficients due to a current or to waves only display considerably different values (fw/fc 10 - 100). Madsen and Grant (1976) suggested the following relationship for the combined friction factor:
- (66)
where θc and θw are the Shields parameters due to current and waves, respectively.
Van Rijn formula
The Van Rijn (1989) formula is defined in the same way as the Bijker (1967, 1968) formula, and the bed-load transport rate is written as follows:
- (67)
where the total shear stress due to current only (taking into account the influence of bed forms and waves), τcr the critical shear stress for sediment transport, the shape factor, and αcw a coefficient due to the presence of waves (which can affect the mean shear stress).
Dibajnia and Watanabe formula
Similar to the formulas of Bailard and Ribberink (discussed next), the Dibajnia and Watanabe (1992; see also Dibajnia 1995) formula divides the sediment transport into two half-cycles due to the presence of waves (Figure 18). During the first half-cycle, sediment moves in the direction of wave propagation, and then it moves in the opposite direction during the second half-cycle. An advantage of the formula is that it takes into account a possible quantity of sand still in suspension after each half-cycle that moves in the opposite direction. This phenomenon is referred to as a "phase lag," introduced by Dohmen-Janssen (1999). Another advantage is that the formula (similar to the Bailard (1981) and Ribberink (1998) formulas) allows for the description of nonlinear waves.
Figure 18. Definition of (a) wave and current directions, and (b) horizontal time-dependent velocity variation at bottom in direction of wave propagation
(after Dibajnia and Watanabe 1992).
The solid volume flux is given by the following equation:
- (68)
where the coefficients of calibration are Adw = 0.001 and Bdw = 0.55, and:
| (69) |
in which Tw, Twc, Twt are the period and half-periods, respectively, of the wave taking into account the influence of the current (see Figure 18), c and t the amount of sand entrained and settled during the half-period Twc of the wave crest and Twt of the wave trough, respectively, and the amount of suspended sand remaining from the positive (crest) and the negative (trough) half-cycle, respectively, and uwc and uwt the quadratic velocity (wave and current combined) over each half-period calculated from:
- (70)
where j can be c or t, , with uw(t) being the instantaneous wave orbital velocity, and the angle between the wave and current directions (Figure 18). The nondimensional quantities in Equation 69 are defined as:
- (71)
with:
- (72)
where j can be c or t as before. The parameter ωcr characterizes the ripples (a function of the total shear stress including waves and current):
- (73)
where θcw,max is the maximum Shields parameter due to waves and current combined (following Soulsby 1997, pp. 87-95).
Ribberink formula
Ribberink (1998) proposed a model for the quasi-steady bed-load transport for which the instantaneous solid flux is assumed to be a function of the difference between the actual time-dependent bed shear stress and the critical bed shear stress (Figure 19). This formula has been calibrated against flume data for waves and current combined in the plane-bed mode (suspended load negligible), as well as for field data for unidirectional flow in rivers.
Figure 19. Time variation of bottom velocity (a) in wave direction, and (b) induced shear stress for waves and current combined (after Ribberink 1998).
Thus, Ribberink (1998) proposed the following transport formula:
- (74)
where is the time-dependent Shields parameter (Figure 19) with the instantaneous velocity , the wave-current friction factor fcw computed according to Madsen and Grant (1976), θcr the critical Shields parameter, < > the time-average over several wave periods, and mRib = 11, nRib = 1.65 calibration coefficients. Ribberink (1998) proposed to compute the total roughness from , where ks is the Nikuradse skin roughness.
Bed-load transport by currents
Here, bed load refers mainly to the rolling, sliding, and jumping grains in almost continuous contact with the bed. Also, it follows the ideas of Wilson (1966) about upper-regime transport where a layer with a thickness of several grain diameters is transported and where intergranular collision is important (sheet flow).
Existing formulas
The bed-load transport is often represented by the following non-dimensional parameter:
- (75)
where qsb is the volumetric bed-load sediment transport rate per unit time and width. Some authors have also proposed to use the parameter . If d50 > 10−3 mm, b because the settling velocity is proportional to the square-root of the median diameter (according to Van Rijn 1984a), whereas for d50 < 10−3 mm, Φb becomes smaller than Φ, implying that Φb introduces a characterization of the sediment transport rate that is more sensitive for fine sediments. Several relationships for estimating the bed-load sediment transport under a steady current have been proposed where the rate is related to the dimensionless bottom shear stress or Shields parameter:
- (76)
Here, τc is the shear stress at the bottom due to the current. Three commonly applied formulas were investigated in this study:
- (77)
- (78)
- (79)
where θcr is the critical Shields parameter. The formula for θcr proposed by Soulsby and Whitehouse (1997; see also Soulsby (1997), p. 104-110) was used in the present study (Equation 49).
Comparison with data
To investigate bed-load transport formulas, available data sets on sediment transport covering a wide range of unidirectional steady currents were compiled and analyzed, including both laboratory and field data. Table 5 summarizes these data sets with the type of flow motion and sediment properties listed. It may be noted that many data sets come from the compilation made by Brownlie (1981), where limited information was given about the type of sediment transport (bed load and/or suspended load), although comments on the presence of bed forms were provided. From these data, only plane-bed cases were selected, where bed load should prevail. Typically, for fine sediment, suspended load is not negligible if bed forms appear. Thus, bed-load transport in the presence of bed forms was not investigated. The data base compiled covers a wide range of median grain sizes, many of them considerably coarser than what would be found at a coastal inlet, but the range provides an informative test on the limits of the formulas. Also, the currents included in the data base covered a broad range. Figures 20a and 20b display histograms of the median grain size and mean current speed for the data base employed. The existing formulas selected for comparison with the data relate the sediment transport rate to the bed shear stress, and they were developed for bed-load transport. In the employed database, it is uncertain what the ratio was between bed load and suspended load in each individual case. For the cases with coarser sediment, bed load must have dominated, with the grains moving through rolling, sliding, and jumping for lower shear stresses or in a sheet-flow layer for higher shear stresses. Even where suspended load might have been significant, experience with the Watanabe (1989) formula shows that the total load can often be related to the bed shear stress. This implies that the tested formulas may have some predictive potential in such a situtation, although it is in principle outside their range of applicability.
Table 5. Data base compiled to study bed-load sediment transport in steady current (plane bed cases only).
| Author(s) | Flow Type | Number | Material | S | D'50 '(mm) |
| Gilbert (1914) | Steady uniform flow, flume, plane bed | 250 | Sand | 2,65 | 0.3-4.9 |
| U.S. Army Engineer Waterways Experiment Station (1935-1936) (in Brownlie 1981) |
Steady uniform flow, flume, plane bed | 162 | Sand | 2.65 | 0.18-4.1 |
| Willis et al. (1972) | Flume, plane bed | 43 | Sand | 2.65 | 0.1 |
| Brownlie (1981) | Various experimental data Plane bed |
297 | Plastic Sand |
1.30-1.41 2.49-2.67 |
2.2-20.2 0.088-20 |
| Brownlie (1981) | Various field data, plane bed | 40 | Sand | 2.65 | 0.84-7.0 |
| Smart (1984, 1999 with Nikora and Smart 1997) | Exp. for steep channels and field data, plane bed | 140 | Sand Gravel |
2.65 2.65 |
2.0-10.5 53-200 |
| Nnadi & Wilson (1992) | Pressurized closed conduit | 105 | Bakelite Sand Nylon |
1.55 2.67 1.14 |
0.67-1.05 0.70 3.94 |
| (a) | (b) |
Figure 20. Distribution of median grain size and mean current speed for database compiled on sediment transport under steady current.
Figure 21 illustrates a comparison between the sediment transport rate calculated with the Meyer-Peter and Müller (1948) formula and the compiled database. The other studied formulas yield similar agreement and exhibit the same general behavior, although the Nielsen (1992) formula showed slightly less agreement with the data. From Figure 21, two observations can be made: (1) for the Willis et al. (1972) data, the formulas underpredict the transport rate, which is probably due to the fine sediment used in the experiment and probable significant transport in suspension that the formulas fail to accurately quantify; and (2) for small transport rates, close to θcr, the formulas overpredict the transport rate. With regard to the latter observation, it should be noted that all individual cases where the predictions implied a zero transport because θc < θcr were not plotted in the figure because of the log-log scale.
Figure 21. Comparison between Meyer-Peter and Müller formula and compiled database on sediment transport rates.
Because marked uncertainties exist in the measurements of the bed-load sediment transport (especially for field measurements), a prediction within a factor 2 of the measurements is considered to be a satisfactory result. In Table 6, the percentage of predicted values included within a factor of 2 or a factor of 5 deviation is presented (Px2 and Px5, respectively), as well as the root-mean-square error defined as:
- (80)
To avoid any distortion in the calculation of Erms for low transport rates (where qsb,pred or qsb,meas could be found equal to zero), a minimum value for qsb,pred and qsb,meas was specified (qsb,min = 10-8m2/sec). It appears that the Meyer-Peter and Müller (1948) formula, which was originally calibrated with coarse sediment data, gives fairly good results in comparison to the measurements, even for large shear stresses and fine sediment. An underestimation is, however, observed for the Willis et al. (1972) data, but as sediment used in this experiment was very fine (0.1 mm), some suspended transport probably occurred. The three formulas studied show similar behavior for large shear stresses with a slightly better prediction skill for the Ribberink (1998) formula. For smaller Shields parameter (θc close to θcr, where θcr is estimated using the Soulsby and Whitehouse (1997) formula), all formulas tend to overestimate the bed-load rate with errors up to one order of magnitude for the Nielsen (1992) formula, which significantly increases the Erms value. Thus, it seems that the use of the critical Shields parameter as a limit for specifying no transport is not sufficiently accurate for the existing formulas.
Table 6. Prediction of bed-load transport rate within factor of 2 and 5 of measured values and root-mean-square errors using current only data.
| Author(s) | All Data | All Data Except Willis et al. | ||||
| Px2 (%) | Px5 (%) | Erms | Px2 (%) | Px5 (%) | Erms | |
| Meyer-Peter & Müller | 62 | 83 | 0.34 | 66 | 87 | 0.30 |
| Nielsen | 54 | 72 | 0.48 | 57 | 75 | 0.46 |
| Ribberink | 66 | 85 | 0.28 | 69 | 89 | 0.25 |
| Equation 81 | 73 | 89 | 0.19 | 78 | 93 | 0.15 |
New formula for bed-load transport
To better understand the influence of the critical value of the Shields parameter on the sediment transport, Φ-values from the measurements are plotted versus the ratio θc/θcr in Figure 22. The studied formulas are also plotted with a constant value for θcr = 0.04 (mean value for the data set).
Figure 22. Effect of critical Shields parameter on bed-load transport rate: comparison between data and studied formulas.
All the predictive formulas are in fairly good agreement with the data if θc > 5 θcr, but they tend to slightly overestimate Φ when θcr < θc < 5 θcr. For this range of values, the Meyer-Peter and Müller (1948) and Ribberink (1998) formulas exhibit a better behavior than the Nielsen (1992) formula. However, if Failed to parse (unknown function "\raise"): {\displaystyle {{\theta }_{c}}\underset{\raise0.3em\hbox{$\smash{\scriptscriptstyle\thicksim}$}}{<}{{\theta }_{cr}}} , significant deviations in the predictions occur. All these formulas predict no sediment transport, although small sediment transport is often observed. The prediction of the critical Shields parameter is obviously associated with marked uncertainty (so is the sediment transport estimation for these low values). Thus, to avoid such errors, a new approach is introduced by including an exponential relationship for the effect of the critical Shields parameter, which allows low sediment transport rates if cr. Calibration against the measurements led to the following bed-load formula:
- (81)
Cheng (2002) proposed a formula similar to Equation 81, but without taking into account the effect of a varying critical Shields parameter. The Cheng (2002) formula seems to include a constant value of cr 0.05. The effect of a varying critical value of the Shields parameter is, however, not negligible as observed by Meyer-Peter and Müller (1948). Figures 22, 23, and 24 indicate that this new approach of describing the effect of the critical Shields parameter significantly improves the prediction skill for weak shear stresses. Predictions within a factor-2 deviation reach 70 percent (even 80 percent without the Willis et al. (1972) data), which increase the agreement by 10 percent compared to previous formulas (Table 6). The new relationship tends to overestimate the transport rate if is much smaller than (see Figure 22), but reproduces trends well for small measured rates.
Figure 23. Influence of critical Shields parameter on bed-load transport rate illustrated through data and Equation 81 (for different values on θcr).
Figure 24 plots measured and calculated transport rate values for the database using the new formula (Equation 81). The plot confirms the improvement in the prediction of the bed-load transport.
Figure 24. Comparison between bed-load transport for current only predicted
by new formula (Equation 81) and measurements.
Bed-load transport by waves
Existing formulas
Several relationships for bed-load transport by waves have been proposed that relate the transport rate to the wave orbital velocity at the bottom Uw or the wave Shields parameter θw defined as:
- (82)
where fw is the dimensionless wave friction factor. Assuming that the rough turbulent regime is fully developed, the friction factor can be estimated, for example, with the formula suggested by Swart (1974) (see Equation 25). Transport formulas have been employed to estimate the wave half-cycle sediment transport Φ1/2 (Madsen and Grant 1976; Soulsby et al. 1993; Soulsby 1997). The net transport can then be calculated as the difference between the half-cycle transport beneath the crest and beneath the trough (the shear stress is calculated using the maximum and minimum values of the wave velocity at the bottom, uw,max and uw,min, respectively, instead of the wave orbital velocity Uw). In some other studies (Bailard and Inman 1981; Ribberink 1998), a relationship based on the instantaneous wave velocity was introduced for the bed load Φ(t) that can be integrated over a wave period. The following formulas are among the most common ones for calculating sediment transport under waves:
- (83)
- (84)
- (85)
- (86)
- (87)
It should be noted that Madsen and Grant (1976) as well as Dibajnia and Watanabe (1992) used the parameter Φb instead of the parameter Φ (see previous discussion), which explains the coefficient in their formulas. Bailard and Inman (1981) proposed a coefficient value of (b = 0.13, and ( is the internal friction angle of the sediment (( ( 30 deg). Dibajnia and Watanabe (1992) defined Γ as a function of the half periods Twc and Twt and the amount of sediment entrained that settle in each half-period, because some of the sediment might still be in suspension from the previous half-period (see also Camenen and Larroudé 2003).
Development of new formula
As Madsen (1991) and Ribberink (1998) proposed, the instantaneous sediment transport rate may be related to the instantaneous shear stress in the same manner as for the steady case. Following the idea of Dibajnia and Watanabe (1992), a simplified velocity variation at the bottom may be considered to estimate the effect of the wave asymmetry on the sediment transport. Thus, the net sediment transport over a wave period is estimated for each half-period using a characteristic value for the quadratic velocity, or equivalently on the shear stress (if the friction coefficient is assumed to be constant). Thus, the mean value of the instantaneous shear stress over half a period may be used (Figure 25):
- (88)
where Twc and Twt (= Tw - Twc) are the half periods where the instantaneous velocity uw(t) (or instantaneous Shields parameter) is onshore (uw(t) > 0) or offshore (uw(t) < 0), respectively, and the instantaneous shear stress is defined as follows:
- (89)
Figure 25. (a) Typical wave velocity variation, and (b) instantaneous Shields parameter variation over wave period in direction of wave propagation.
Figure 25 presents a typical velocity variation and the associated instantaneous Shields parameter variation over a wave period. In the case of an asymmetric wave, a maximum in the shear stress occurs during onshore flow (in the direction of the wave propagation) that is larger than the minimum during offshore flow, which induces a net sediment transport in the direction of the waves. A constant value on the friction coefficient over the wave period was assumed in calculating the Shields parameter (Equation 89). Drake and Calantoni (2001) and Antunes Do Carmo et al. (2003) showed that the wave friction coefficient depends also on the acceleration of the fluid near the bottom. This dependence was previously noted by Trowbridge and Madsen (1984a, b), who made an analytical study of the turbulent wave boundary layer, highlighting the contribution of a time-varying eddy viscosity. However, it is assumed here that the predictions of the shear stresses using a constant friction factor are sufficiently accurate for application in practical sediment transport calculations. Using the same approach as for the steady current, an equation for the net sediment transport under waves may be derived similar to Equation 81. The net sediment transport under waves is expressed as:
- (90)
where aw and bw are coefficients is always supposed to be larger than and is the time-averaged absolute value of the instantaneous Shields parameter. A conceptual model that supports this type of formulation would be based on the following assumptions:
- The transport in the bottom layer is the product of the typical speed of the layer and the layer thickness, where the former is denoted Us and the latter m.
- The speed Us is assumed proportional to the net shear velocity over a wave period, which gives a dependence on
- .
- m is assumed proportional to the mean wave shear stress, which gives the dependence on θw,m.
The overall effect of the critical shear stress on the sediment transport over a wave period is estimated using the same approximation as for a steady current. However, because Soulsby (1997, pp. 104-106) proposed to compute the critical shear stress based on the maximum shear stress, the maximum Shields parameter is used in Equation 90. A difficulty encountered in applying the formula (and any other formulas based on the shear stress) is to estimate the total Shields parameter (or total friction coefficient) for the sheet flow mode. The work by Wilson (1989a) on wave-induced sheet-flow roughness was employed in this study, where he proposed to use the same equation as for steady current, but with the maximum wave-induced Shields parameter (ks = ks,sfw = 5 θw d50). Because most of the results presented by Ribberink (1998) were based on the skin friction, to be consistent, two computations were made, first using the skin friction (ks = 2d50) and then the Wilson formula (Equation 41). It should be noted that the Wilson formula requires an iterative approach in solving for ks.
Comparison with experimental data
To investigate bed-load transport under waves only, a wide range of existing data sets was compiled and analyzed. Table 7 summarizes these data sets, in which the type of experiment, sediment properties, and wave properties are listed. It can be observed that most of the data are from oscillating water tunnels (OWT). The OWT experiments have two advantages for this type study: large orbital velocities can be achieved, and bed-load transport prevails. Previously, experimental studies were often carried out using an oscillating tray (OT: oscillating bed in a tank of still water; Manohar 1955; Kalkanis 1964; Abou-Seida 1965; and Sleath 1978). More recently, Dohmen-Janssen and Hanes (2002) carried out an experiment in a large wave flume (LWF).
Table 7. Data summary for bed-load sediment transport experiments carried out in oscillatory flow with and without current.
| Author(s) | Exp. Facil. | Cycle | Number | s | d50 (mm) |
Uc '(m/sec)' | Uw,max (m/sec) |
Tw '(sec)' |
| Kalkanis (1964) | OT | Half | 25 | 2.63 | 1.68-2.82 | 0 | 0.28-0.71 | 3.2-6.2 |
| Abou Seida (1965) | OT | Half | 34 9 |
2.65 2.23 |
0.14-2.61 0.70 |
0 0 |
0.35-1.28 0.41-0.80 |
1.7-5.1 2.0-4.8 |
| Sleath (1978) | OT | Half | 22 12 |
2.60 1.138 |
1.89, 4.24 3.04 |
0 0 |
0.20-0.68 0.07-0.17 |
0.5-2.7 1.3-9.0 |
| Horikawa et al. (1982) | OWT | Half | 6 | 2.66 | 0.2 | 0 | 0.76-1.27 | 2.6-6.0 |
| Sawamoto & Yamashita (1986) | OWT | Half | 22 | 1.58 2.65 |
1.5 0.2-1.8 |
0 0 |
0.74-1.25 0.46-1.25 |
3.8 3.8 |
| Ahilan & Sleath (1987) | OWT | Half | 5 4 |
1.137 1.44 |
4.0 4.3 |
0 0 |
0.3-0.5 1.1-1.2 |
3.6-3.7 4.7-4.9 |
| Watanabe & Isobe (1990) | OWT | Full | 11 65 |
2.65 2.65 |
0.18, 0.87 0.18, 0.87 |
0 -0.3-0.25 |
0.27-0.43 0.27-0.52 |
3.0, 6.0 3, 6 |
| King (1991) | OWT | Half | 178 | 2.65 | 0.1-1.1 | 0 | 0.3-1.2 | 2.0-12.0 |
| Dibajnia & Watanabe (1992) | OWT | Full | 25 76 |
2.65 2.65 |
0.20 0.20 |
0 -0.26-0.22 |
0.6-1.0 0.61-1.24 |
1.0-4.0 1-4 |
| Ribberink & Chen (1993) | OWT | Full | 4 | 2.65 | 0.128 | 0 | 0.6-1.2 | 6.5 |
| Ribberink & Al Salem (1994) | OWT | Full | 10 | 2.65 | 0.21 | 0 | 0.7-1.4 | 5.0-12.0 |
| Delft Hydraulics (1993-1999; see Van Rijn et al. 2001) | OWT | Full | 52 | 2.65 | 0.13-0.24 | -0.45-0.56 | 0.37-1.49 | 5, 12 |
| Dohmen-Janssen (1999) | OWT | Full | 27 | 2.65 | 0.13-0.32 | 0.23-0,45 | 0.46-1.85 | 4-12 |
| Dohmen-Janssen & Hanes (2002) | LWF | Full | 4 | 2.65 | 0.21 | -0.05 - -0.03 | 0.88-1.5 | 6.5, 9.1 |
| Ahmed & Sato (2003) | OWT | Full | 15 | 2.65 | 0.21-0.74 | 0 | 1.16-1.85 | 3.0 |
Figure 27 shows the calculated and measured bed-load transport for the studied experiments using values on the empirical coefficients of aw = 6 and bw = b = 4.5 (see Figure 26 for the calibration of aw). This new fit shows that if the effect of the critical Shields parameter on the mean sediment transport rate over a wave period is similar to steady flow, the total net rate is a function of the Shields parameter to the power 1.5 with a smaller value on the coefficient a than for steady current. Soulsby (1997) found similar results using the Meyer-Peter and Müller (1948) equation (Equations 77 and 86 include the coefficient values 8 and 5.1, respectively). This lower value is partly due to the time averaging. It may also contain contributions owing to a phase lag between instantaneous sediment concentration and the velocity at the bottom. In Figure 27(a), the predicted bed load using Equation 90 is plotted versus the measurements encompassing waves only. Even if some scatter occurs, the obtained results are seen to be good. Around 60 percent of the cases are predicted within a factor of 2 of the measured values. An additional difficulty in comparing the transport formula with the wave measurements is that no shear stress may be derived from the measurements, but the shear stress has to be calculated based on an estimate of the bed roughness. This introduces an extra element of uncertainty in the calculations of the sediment transport rates. The formulas proposed by Wilson (1966, 1989a, b) were employed to calculate the Nikuradse roughness:
- (91)
- (92)
Both equations require an iterative method in solving for the Nikuradse roughness. An underestimation for the Ahilan and Sleath (1987) data set and an overestimation for the Sawamoto and Yamashita (1986) data set is observed. One explanation could be that large uncertainties are induced by this kind of iterative formula (Bayram et al. 2003; Camenen et al. 2006). Using the Nikuradse skin roughness shows better agreement for the Sawamoto and Yamashita (1986) data set, but worse agreement for the Ahilan and Sleath (1987) data set (Figure 27(b)). Finally, it may be noted that Equation 90 slightly underestimates the sediment transport rate for the Kalkanis (1964) data set and overestimates the rate for the Abou-Seida (1965) and the Sleath (1978) data sets. Thus, it appears that the OT set-up does not yield the same behavior concerning the sediment transport as the OWT set-up.
Figure 26. Calibration of coefficient '''aw 'using all experimental data with waves only (Nikuradse roughness calculated using Wilson (1989a) formula).
| (a) | |
| (b) |
Figure 27. Comparison between bed-load transport predicted by Equation 90 and experimental data with waves (a) where '''ks 'is calculated using Wilson (1989a) formula, and (b) where '''ks '= 2'''d50.
Table 8 lists the percentages of predicted values within a factor of 2 deviation or a factor of 5 deviation and the root-mean-square error for the six studied formulas and all the data, as well as for the data encompassing complete wave cycles, using the Wilson (1989a) formula to compute the Nikuradse roughness (ks = ks,sfw). The same calculations were also performed for all the data with the skin friction (ks = 2d50) to compute the Shields parameter.
Table 8. Predictive capability of bed-load transport rate within factor of 2 and 5 of measured values and root-mean-square errors, data from waves only.
| Author(s) | All Data ('''ks '''''= ks,sfw) |
Full Cycle Data ('''ks '''''= ks,sfw) |
All Data ('''ks '''''= '''2'''d50) | ||||||
| Px2 (%) | Px5 (%) | Erms | Px2 (%) | Px5 (%) | Erms | Px2 (%) | Px5 (%) | Erms | |
| Madsen & Grant | 37 | 64 | 1.25 | 06 | 14 | 5.22 | 45 | 75 | 0.99 |
| Bailard & Inman | 47 | 75 | 0.92 | 38 | 57 | 3.81 | 45 | 73 | 0.93 |
| Dibajnia & Watanabe | 36 | 75 | 0.49 | 49 | 85 | 0.79 | 36 | 75 | 0.49 |
| Soulsby (coef. 2.5) | 36 | 75 | 0.98 | 20 | 52 | 3.92 | 39 | 76 | 0.97 |
| Ribberink | 29 | 73 | 1.08 | 20 | 46 | 4.14 | 36 | 76 | 1.03 |
| Equation 90 | 59 | 86 | 0.77 | 34 | 58 | 3.84 | 57 | 86 | 0.78 |
Equation 90 yields the best overall results. For the full cycle data, because the phase lag is not taken into account, the agreement is not as good, and the scatter is larger (Erms = 3.8). The Madsen and Grant (1976) formula tends to overestimate the sediment transport for large values of the shear stress. This formula is proportional to the Shields parameter to the power 3 and calibrated with lower shear stress data. Soulsby (1997) suggested to use the maximum shear stress in his formula, which causes a large overestimation of the transport rates. Replacement of a coefficient value of 2.5 instead 5.1 improves the results (results in Table 8), but it still indicates an overestimation of the sediment transport for low shear stresses. If the mean shear stress is used instead of the maximum shear stress (with the coefficient 5.1), results are better and similar to those given by Equation 90, except for data with low sediment transport rates, which are typically overestimated. The Bailard and Inman (1981), Dibajnia and Watanabe (1992), and Ribberink (1998) formulas also overestimate the weak sediment transport rate data. This means that the effect of the critical Shields parameter is not taken into account properly (not included in the Bailard and Inman (1981) and Dibajnia and Watanabe (1992) formulas). The Ribberink (1998) formula typically overestimates the sediment transport rate. Using the coefficient values (7.9, 1.97) instead of (11, 1.65) or using ks = d50, as Ribberink (1998) proposed, improves the results. However, this is not in accordance with the formula originally proposed for a steady current (Equation 79) or with physical values of the Nikuradse roughness. The Dibajnia and Watanabe (1992) formula, because it takes the phase lag into account, allows the sediment transport to be in the opposite direction to the waves for fine sediment. Thus, it presents the overall best results for the full cycle data and a much lower scatter (Erms < 1). On the other hand, it yields poor results for the half-cycle data. Finally, it should be noted that results from the OT data are typically more scattered. This may be a result of the shear stresses being close to the critical shear stress, inducing additional randomness, as well as uncertainty in the measurements. The main theoretical difference between the Ribberink (1998) relationship (Equation 87) and Equation 90 is that the former equation is a mean value of the instantaneous sediment transport over the wave period, whereas the latter calculates the sediment transport from the mean shear stress. Using the mean value over the wave period of the instantaneous sediment transport induces a sediment transport rate 20 percent larger than using the same equation with the mean shear stress over the period. Moreover, as was observed previously, phase-lag effects seem to be non-negligible, even for relatively small wave orbital velocities. This may explain the overestimation observed for the Ribberink formula. Another remark to be made (Figure 28) is that the direction of the net sediment transport may be opposite to the direction of the waves. Ribberink and Chen (1993) and Dibajnia and Watanabe (1992) observed this phenomenon for highly asymmetric waves and fine sediment (d50 0.2 mm). It is caused by the phase lag in the response of the sand to the fluid motion. The quantity of sediment in suspension depends not only on the instantaneous velocity, but also on the settling velocity. In the case of oscillatory flow, not all the sand grains put into suspension during the first half-period settle during the same half-period. The proportion still in suspension is then carried away in the opposite direction during the second half-period. Dohmen-Janssen (1999) and Dohmen-Janssen and Hanes (2002) introduced a parameter to describe the phase lag.
- (93)
where δs is the thickness of the sheet-flow layer. Following Asano (1992) and Dohmen-Janssen and Hanes (2002), δs = 10 d50 w. They observed that phase-lag effects occur if ppl > 0.3-0.4. Figure 28 plots the cases where strong phase lag occurs (circles). These data points correspond to an overestimation (and/or wrong direction) of the predicted values using Equation 90. Thus, it appears that the proposed formula is mainly restricted to cases without significant phase lag. This phenomenon is not included in Equation 90, but could be approximated by adding a correction factor (Dohmen-Janssen 1999; Dohmen-Janssen and Hanes 2002; Camenen and Larroudé 2003).
Figure 28. Comparison between bed-load transport predicted by Equation 90 and experimental data over full wave cycle ('''ks 'calculated using Wilson (1989a) formula,
'''ks '= '''ks,sfw).
Bed-load transport by waves and currents
Stirring by waves in the presence of a steady current tends to increase the total sediment transport significantly. Also, as shown in the previous section, asymmetric waves can transport sediment. Thus, to generalize the proposed formula to encompass both waves and current, a modification of the formula is proposed including the total shear stress obtained from the interaction between waves and current.
Development of new formula
The conceptual model proposed for the case of waves only (Equation 90) can be extended to the interaction between waves and current. Assuming that Us is proportional to the shear velocity at the bottom, a dependence on may be assumed for Us, where the interaction between waves and current is taken into account. The representative shear stresses θcw,onshore and θcw,offshore are defined based on the instantaneous Shields parameter in the direction of the wave for positive and negative values of θcw(t), respectively (Figure 29). For an arbitrary angle ( between the waves and the current, this yields the same equations as Equation 88, where θw is replaced by θcw, and Twc and Twc are the half-periods where the instantaneous velocity (or instantaneous Shields parameter) is onshore (u(t) > 0) or offshore (u(t) < 0), respectively (Figure 29). The representative shear stresses θcw,onshore and θcw,offshore are defined as quadratic values of the instantaneous Shields parameter in the direction of the wave for positive and negative values of θcw(t), respectively (Figure 29). For an arbitrary angle ( between the waves and the current, this yields:
- (94)
- (95)
where Twc and Twt are the half-periods where the instantaneous velocity u = Uc cos + uw(t) (or instantaneous Shields parameter) is onshore (> 0) or offshore (< 0), respectively. The instantaneous Shields parameter is defined as follows:
- (96)
where fcw is the friction coefficient for an interaction between wave and current. This coefficient is assumed to be constant over the wave period as a first approximation but, as already noted, a temporal variation exists. Madsen and Grant (1976) suggested that fcw could be obtained as a linear combination of the current-related (fc) and wave-related (fw) friction coefficients according to Equation 66.
| (a) (b)
|
Figure 29. Definition sketches for (a) wave and current interaction, and (b) typical velocity variation over wave period in direction of wave propagation including effect of steady current.
Appendix B compiles analytical expressions for θcw,onshore and θcw,offshore for different wave theories or approximations. The assumption that the moving sediment layer thickness Δs is proportional to the total mean bottom shear stress gives a dependence on θcw,m for the transport rate (the stirring at the bottom by the waves and current together is mobilizing the layer). For an arbitrary angle between the waves and the current, the mean and maximum combined Shields parameters at the bottom θcw,m and θcw, respectively, are written:
- (97)
- (98)
where the magnitude of the mean (maximum) shear stresses from the waves and current were added (vector addition). A more sophisticated approach would include the time variation of the waves in this addition. In the derivation of a transport formula where waves contribute to the transporting velocity, it is convenient to determine the transport rate parallel and perpendicular to the direction of wave propagation. Then, for an arbitrary angle between the waves and the current, Equation 81 can be written in the following manner.
- (99)
where w and n correspond, respectively, to the wave direction and the direction normal to the wave direction, , and aw, an, and b are empirical coefficients as before. The same value b = 4.5 is retained. For consistency with previous results obtained for current only and waves only, the following relationship is proposed for the coefficient aw:
- (100)
Also, we take an = 12. The overall effect of the critical shear stress on the sediment transport over a wave period may be estimated using the same approximation as for the steady current. However, because Soulsby (1997, pp. 104-106) proposed to compute the critical shear stress based on the maximum shear stress, the maximum Shields parameter θcw is used. For = 90 deg and , , that is, the waves are perpendicular to the current and control the stirring of the sediment. If θc = 0 (no current) with sinusoidal waves, θcw = θw and θcw,onshore + θcw,offshore = 0, which gives no bed load unless wave asymmetry is included.
Comparison with experimental data
To investigate bed-load transport where waves and current are interacting, several existing data sets were compiled and analyzed (Table 7). Most of the data are from OWT experiments implying large orbital velocities with prevailing bed-load transport. More recently, Dohmen-Janssen and Hanes (2002) carried out experiments in a large-scale wave flume (LWF). For nonbreaking waves, they found that the bed-load sediment transport represents around 90 percent of the total load. These experiments showed that results are consistent with those observed in oscillating water tunnels (OWTs), although differences in the suspended sediment concentration and the total sediment transport rate are apparent. Net transport rates under waves were found to be about a factor 2.5 larger than in uniform horizontal oscillatory flows. They explained this by referring to the differences between boundary layer flows in OWT sand under free surface gravity waves. This difference may partly be attributed to the onshore-directed boundary layer streaming that is present under waves and is absent in horizontal oscillatory flow. Figure 30(a) plots the bed-load transport predicted by Equation 99 against experimental data for current and waves interacting (with Uc > 0.02 m/sec). Good agreement is observed, and more than 50 percent of the data points are predicted within a factor of 2 of the measured values. A major part of the discrepancy (Erms 2, see Table 9) can be explained by the difficulty in predicting roughness values for oscillatory sheet flow (no measured values available) and because phase-lag effects are not included in the formula (some large overestimations or even incorrect transport directions are observed if strong phase lag occurs, as indicated in Figure 28). The sediment transport rates for the Delft Hydraulic data set are slightly overestimated if the Wilson formula is used and better predicted using the Nikuradse skin roughness (Figure 30(b)). On the other hand, the sediment transport rates for the Dibajnia and Watanabe (1992) data set are underestimated if the skin friction is used and better predicted if the Wilson formula is employed. The four data points from the large wave flume experiment are well predicted (within a factor of 2 of the measured values). It seems that the differences observed by Dohmen-Janssen and Hanes (2002) between the LWF and OWT experiments for the linear relationship between the net transport rates and the third-power velocity moment are reduced by inclusion of the friction coefficient (within the Shields parameter). Finally, contrary to comparisons with other formulas, good agreement is observed for the Watanabe and Isobe (1990) data set, corresponding to small wave orbital velocities and periods. This means that the effect of the critical Shields parameter is well described. It should be noted that for this data set, ripples were sometimes observed, which induced stronger suspension and phase-lag effects. Appearance of ripples may explain the opposite direction of the sediment transport observed for some of the data points as pointed out by Dibajnia and Watanabe (1992).
Comparison with existing formulas for waves and current
Only the Bailard and Inman (1981), Dibajnia and Watanabe (1992), and Ribberink (1998) formulas include the effects of a current. Table 9 lists the percentage of predicted values, within a factor of 2 or a factor of 5 deviation from the measurements, for the four studied formulas presented for all the data where a mean current is present using the Wilson relationship (ks = ks,sfw) or the skin friction (ks = 2d50) to compute the Nikuradse roughness. As seen in Table 9, a larger discrepancy exists compared to the steady current data, because the total shear stress has to be estimated instead of using measured values. Equation 99 still yields the best overall results. The Bailard and Inman (1981) formula overestimates the sediment transport rate for low shear stresses (e.g., the Watanabe and Isobe (1990) data set), and underestimates the rate for the Dibajnia and Watanabe (1992) data set and for all the cases where strong phase lag occurs. Nevertheless, it gives good overall agreement with the data. As already observed, the Ribberink (1998) formula overestimates the transport rates when waves are present. Results are improved using the Nikuradse skin roughness, but they remain poor compared to the other predictive formulas. Finally, although the Dibajnia and Watanabe (1992) formula shows good overall results, it overestimates the data from Delft Hydraulics and seems not to be adequately sensitive to the bottom shear stress.
| (a) | |
| (b) |
'Figure 30. Comparison between bed-load transport predicted by Equation 99 and experimental data with current ('''Uc '> 0.02 m/sec) (a) where '''ks 'is calculated using Wilson (1989a) formula, and (b) where '''ks '= 2'''d50.
Table 9. Prediction of bed-load transport rate within factor of 2 and 5 of
measured values and root-mean-square errors using data on waves
and current combined ('''Uc'''' > 0.02 m/sec).
| Author(s) | All Data ('''ks '''''= ks''','''sfw) |
All Data ('''ks '''''= '''2'''d50) | ||||
| Px2 (%) | Px5 (%) | Erms | Px2 (%) | Px5 (%) | Erms | |
| Bailard & Inman | 47 | 70 | 2.07 | 41 | 68 | 2.10 |
| Dibajnia & Watanabe | 41 | 72 | 1.74 | 41 | 72 | 1.74 |
| Ribberink | 18 | 44 | 4.13 | 32 | 52 | 4.01 |
| Equation 99 | 54 | 77 | 2.03 | 46 | 74 | 2.05 |
Phase-lag effects on sediment transport in sheet flow
Introduction
Manohar (1955) performed one of the first studies on the inception of sheet flow (disappearance of the wave ripples) by using an oscillatory tray facility. In more recent times, sheet flow processes have typically been studied in oscillating water tunnels because field measurements close to the bed are not possible during storms, when sheet flow should prevail (e.g., Horikawa et al. 1982; Sawamoto and Yamashita 1986; King 1991; Asano 1992; Dibajnia and Watanabe 1992; Ribberink and Chen 1993; Ribberink and Al-Salem 1994; Li and Sawamoto 1995; Zala Flores and Sleath 1998; Dohmen-Janssen 1999; and Dohmen-Janssen et al. 2002). These studies considerably improved knowledge on the thickness of the sheet-flow layer, the time-dependent concentration profile inside the sheet-flow layer, and the resulting sediment transport rates. Ribberink (1998) showed that a quasi-steady formula based on the Meyer-Peter and Müller (1948) concept successfully describes the net sediment transport rates with the exception of relatively fine sands (d50 < 0.2 mm) and short wave periods (Tw < 3 sec). Dibajnia and Watanabe (1992) carried out experiments with short period waves and found that in many cases a quasi-steady transport model failed to describe the magnitude and the direction of the net transport rate. They hypothesized that the phase lag between velocity and concentration was responsible for this discrepancy. Similar observations were made by Ribberink and Chen (1993) with fine sediment (d50 = 0.13 mm) and large asymmetric waves. Dohmen-Janssen et al. (2002) extended the data set on net transport rates and time-dependent velocities and concentrations under sheet-flow conditions during sinusoidal oscillatory flow combined with a net current for sand with different grain sizes (i.e., d50 = 0.13, 0.21, and 0.32 mm). They suggested that this limitation of quasi-steady models may be due to a phase lag, such as delayed entrainment and settling of sand grains, and proposed a simple model to take these effects into account. The lag between the sediment concentration and the flow was characterized by the ratio between the fall time of the sediment particle (which may be represented by the ratio between the sheet-flow layer thickness and the settling velocity) and the wave period. Although knowledge on phase lag in sheet flow has improved recently, only a few models allow for a quantitative description of this phenomenon. The formula proposed by Dibajnia and Watanabe (1992) appears to be the only one that shows a correct behavior in the sheet-flow regime (Camenen and Larroudé 2003). More recently, Dohmen-Janssen et al. (2002) proposed a correction of the sediment transport (based on the Ribberink (1998) formula if a phase lag occurs that allows for improved estimates of the net bed-load transport rate. Because sheet flow sediment transport occurs near the bed, it is often assumed that the response time of the sediment is much shorter than the wave period. However, in practice, a certain delay exists for the sand to respond to the fluid. Thus, the quantity of sediment in suspension is primarily related to the instantaneous velocity, but it also depends on the settling velocity. In oscillating flow, not all sand grains put into suspension during the first half-period are transported and settle during this period. The proportion still in suspension is then carried away in the opposite direction during the second half-period.
A simple conceptual model
A simple conceptual model was introduced by Dohmen-Janssen (1999) to include the phase lag in sediment transport: the instantaneous bed-load transport is assumed to be proportional to the instantaneous sediment concentration at the bottom (taken constant over the sheet-flow layer) multiplied by the instantaneous horizontal velocity at the bottom. Assuming that the instantaneous sediment concentration is a function of the instantaneous velocity to the power 2, but with a possible phase lag s, the effect of this phase lag on the sediment transport may be estimated. For a sinusoidal wave, the sediment transport reduction due to a phase lag may be expressed as follows:
- (101)
where ru = Uc/Uw, in which Uc is the mean current averaged over the depth, and X = cos s. An analytical solution also exists for a second-order wave assuming uw(cos t + rw 2t) (see also Figure 33):
- (102)
Equations 101 and 102 are functions only of the wave profile (i.e., of the coefficients ru and rw) and the phase lag of the sediment suspension s. Figure 31 shows the effect of the coefficients ru and s in Equation 101 (rw = 0) displayed. As observed by Ribberink and Chen (1993) and Ahmed and Sato (2003), sediment transport in the direction opposite to the waves is possible for large values on s and if (sinusoidal waves) or (second-order wave). It should be noted that Equation 102 does not have a solution if the denominator (the net sediment transport rate equals zero if no phase lag is assumed). The asymmetry factor rw modifies the results significantly, particularly if Den is close to zero where the function diverges (Figure 32). If Equation 101 yields a minimum value for rpl equal to -0.35, Equation 102 produces much smaller values on rpl if the mean current is relatively weak (min(rpl) ( 0.5 when ru = 0) and opposite to the waves (rpl ( -1.1, if ru = 0.05, rw = 0.20 and X = cos (s ( (/2). Furthermore, Equation 102 is not a symmetric function of ru and rpl, and it may be greater than 1 if Den < 0 and close to zero (Figure 32).
| (a) | (b) |
Figure 31. Phase-lag effect on sediment transport for sinusoidal wave with superimposed current when phase lag s 'is introduced for concentration at bottom: (a) instantaneous variation in velocity, concentration, and bed-load rate for '''Uc/'''Uw '= 0.2 and s '''''''= -0.2,
and (b) effect on sediment transport for varying s 'and ratio '''Uc/'''Uw.
| (a) | (b) |
'Figure 32. Phase-lag effects on sediment transport for second-order Stokes wave with (a) positive, or (b) negative, and adding current introducing phase lag s '''''''for concentration at bottom and with '''rw '= 0.2.
Dohmen-Janssen (1999) and Dohmen-Janssen et al. (2002) proposed a more complex model where the sediment concentration varies over the sheet-flow layer following an exponential law. The solution obtained is similar to Equation 101 (or Equation 102, if a 2nd order Stokes wave is used) in which X = cos s is replaced by a function of the phase-lag parameter ppl defined as in Equation 93. However, the model does not allow for small values on rpl (nor negative values) for large phase lag (the minimum value of rpl is 0.35 for a sinusoidal wave, and it is 0.0 for a second-order Stokes wave), but may indicate a possible relationship between s and ppl.
Dibajnia and Watanabe formula
Dibajnia and Watanabe (1992) proposed a sediment transport model that accounts for the phase lag. They considered the amount of sand that is entrained during a positive half-wave cycle. They determined the part that will be transported directly by the positive velocity during the first half cycle and the part that will still be in suspension as the flow reverses and therefore transported by the negative velocity during the following half cycle (see Figure 33). The same concept was proposed for the negative half cycle.
Figure 33. Notation for colinear wave and current interaction.
Dibajnia and Watanabe (1992) assumed that phase-lag effects occur as soon as sheet flow appears. Thus, following the criterion for the inception of sheet flow developed by Dibajnia (1991, Equation 55), they proposed to use the parameter ωpl (Equation 54) for each half period:
- (103)
where Uwj is the representative velocity for the positive or negative half period Twj, and the subscript j should be replaced either by onshore (direction of the wave) or offshore (opposite direction to the wave). Dibajnia and Watanabe (1992) assigned the indices c for crest and t for trough, instead of onshore and offshore, respectively. According to their data, sheet flow occurs as soon as ωpl,j > 1. If no phase lag occurs, their formula is proportional to the mobility parameter for both half periods Ψj (where Uw is replaced by Uwj) as Ωj = WsTj/d50 and . For the case where sheet flow is reached during both half periods, the phase-lag effects may thus be quantified as follows:
Failed to parse (Conversion error. Server ("https://en.wikipedia.org/api/rest_") reported: "Cannot get mml. TeX parse error: Double exponent: use braces to clarify"): {\displaystyle {{r}_{pl,DW}}={{\left[{\frac {{{T}_{wc}}{{U}_{wc}}\left(\Omega _{c}^{3}+{\Omega }'_{t}^{\,3}\right)-{{T}_{wt}}{{U}_{wt}}\left(\Omega _{t}^{3}+{\Omega }'_{c}^{\,3}\right)}{{{T}_{wc}}{{U}_{wc}}\Psi _{c}^{3}-{{Y}_{wt}}{{U}_{wt}}\Psi _{t}^{3}}}\right]}^{0.55}}}
- (104)
where subscript c indicates crest and t trough, and:
- (105)
Dibajnia and Watanabe (1992) slightly modified their formula to take into account the phase lag occurring in the ripple regime by introducing the parameter ωcr. Thus, phase lag occurs if ωpl,j > ωcr, where ωcr = 1 for the sheet-flow regime, and ωcr = 0.03 for the ripple regime.
Modification of Camenen and Larson formula for phase lag
Following Dibajnia and Watanabe (1992), a modification of the Camenen and Larson (2005a, b) formula is proposed to take the phase lag into account. This formula is based on the "bed-shear stress concept" (function of the Shields parameter) and allows sediment transport in the direction of the wave using characteristic values on the Shields parameter for both half periods: θcw,onshore (> 0) and θcw,offshore (< 0). These parameters correspond to the mean value of the instantaneous Shields parameter over each half period where ( is the angle between the wave and current directions, and fcw is obtained using the Madsen and Grant (1976) relationship (Equation 96). Thus, the net sediment transport depends on the factor θcw,net = θcw,onshore + θcw,offshore. In the wave direction, the bed-load sediment transport may be expressed as follows (compare with Equation 99):
- (106)
where aw and b are coefficients, and θcw,m, θcw, and θcr are the mean values of the absolute instantaneous Shields parameter, the maximum Shields parameter, and the critical Shields parameter for the inception of motion, respectively. The sediment phase lag is introduced in the formula by assuming that values of the Shields parameter for both half periods are modified due to this effect. A decrease in θcw,onshore and an increase in θcw,offshore appear if the critical velocity for inception of sheet flow is reached:
- (107)
in which pl,b = onshore - offshore and:
- (108)
where Ucwj is the root-mean-square value of the velocity (waves and current combined) over the half period Twj, and the subscript j should be replaced either by onshore or offshore. The effect of the main parameters (i.e., Ucwj, Tj, and Ws) was examined, and they were calibrated based on the compiled data set. The exponential function, describing the effect of the critical velocity on the inception of sheet flow, is proposed to allow a possible error in the estimation of Uw,cr,sf (Uw,cr,sf is calculated following Equation 57), i.e., even if Ucwj is slightly lower than Uw,cr,sf. Strictly, Uw,cr,sf should be compared to a maximum value of the velocity and not to a quadratic mean value. However, the results would only be modified by a constant factor in the exponential function, changing the fit of the empirical function αj. Thus, the coefficient quantifying the phase lag may be written as follows:
- (109)
Experimental data
To investigate phase-lag effects on bed-load transport under waves and current, data sets from OWT experiments covering a wide range in values were compiled and analyzed. This kind of experiment has several advantages for the present study: large orbital velocities can be reached, bed-load transport prevails, and a strong phase lag is often observed. Table 10 summarizes the data sets employed, where the type of experiment, sediment characteristics, and wave properties are listed.
Table 10. Summary of data on bed-load sediment transport in full-cycle oscillatory flow.
| Author(s) | Number | s | d50 (mm) |
Uc (m/sec) |
Uw,max '(m/sec)' |
Tw '(sec)' |
| Watanabe & Isobe (1990) | 65 | 2.65 | 0.18, 0.87 | -0.3 - 0.25 | 0.27-0.52 | 3.0, 6.0 |
| Dibajnia & Watanabe (1992) | 76 | 2.65 | 0.20 | -0.26 - 0.22 | 0.61-1.24 | 1.0-4.0 |
| Ribberink & Chen (1993) | 4 | 2.65 | 0.128 | < 0.05 | 0.6-1.2 | 6.5 |
| Ribberink & Al Salem (1994) | 30 | 2.65 | 0.21 | -0.11 - 0.56 | 0.37-1.37 | 5.0-12.0 |
| Delft Hydraulics (1994-1999; see Van Rijn et al. 2001) | 22 | 2.65 | 0.13-0.24 | -0.45 - 0.47 | 0.46-1.49 | 4.0-12.0 |
| Dohmen-Janssen (1999) | 27 | 2.65 | 0.13-0.32 | 0.23-0.45 | 0.46-1.85 | 4.0-12.0 |
| Ahmed & Sato (2003) | 15 | 2.65 | 0.21-0.74 | - | 1.16-1.85 | 3.0 |
Calibration of conceptual model
Calibration of the conceptual model is not as easy as the modification of the Camenen and Larson (2005a, b) formula. Indeed, it is difficult to estimate what the sediment transport rate would have been without phase-lag effects. Three methods are proposed to estimate rpl following Camenen and Larroudé (2003) by using a sensitivity analysis of the different parameters. Thus, as soon as no phase lag occurs, bed load might be:
- Independent of median grain size.
- Independent of wave period.
- Proportional to velocity moment to the power 3.
Using experimental data where all the parameters are fixed except the median grain size (or the wave period), it is possible to estimate rpl assuming rpl = 1 for larger values of d50 (or Tw), i.e., . For the third method, the relationship between the bed-load rate and the velocity moment to the power 3 is assumed exact, if Uw is small. A curve proportional to is fitted to the experimental value of qs,net where the measured value of Uw is the smallest, and compared to the other experimental values of qs,net where Uw is higher (and where phase-lag effects are expected). In total, 85 data values were derived using these three methods. It should be noted that several values do not have a solution by Equation 102; the estimated value of rpl was found to be smaller than the minimum value obtained by the model (min (rpl) -0.5 when r = 0). In these cases, the s value corresponding to the minimum of rpl was used. This illustrates the limitations of the conceptual model. However, these errors may also be induced by some limitations in the experimental set-up. Indeed, for some data from the Dibajnia (1991) experiment, rpl reaches -5. As discussed previously, the piston generated additional vortices for the shortest wave periods that induced more suspension, and thus artificially increased the phase-lag effect. It seems that s is well described by the parameter ωpl (Equation 54) introduced by Dibajnia (1991), using Uw and Tw instead of Uwj and Twj. The following empirical relationship is proposed (curve in Figure 34(a)):
- (110)
| (a) | (b) |
Figure 34. Calibration of conceptual model against data.
Figure 34(a) plots the points obtained for s from the three different methods against ωpl. Although significant scatter is observed, most of the data are correctly predicted by Equation 110 (solid line; the dashed lines correspond to Equation 110 with = 0.5 ωpl and 2ωpl). Figure 34(b) shows a comparison between the observed and predicted values on rpl from the experiment (using Equations 102 and 110). The factor rpl is generally well predicted; it should be remembered that large uncertainties are induced through the calculation of rpl. Even if large underestimation occurs for extreme cases (from the wave period method) where rpl < -0.5, the general tendency obtained by Equations 102 and 110 is encouraging.
Influence of median grain size
Strong phase-lag effects were first observed for fine sand (d50 = 0.2 mm, Dibajnia 1991; d50 = 0.13 mm, Ribberink and Chen 1993), where a net sediment transport opposite to the direction of the waves (and mean current) was observed. The specific study on grain-size influence on sediment transport in oscillatory sheet flow by Dohmen-Janssen (1999) clearly showed that the finer the sand is the larger the phase lag might be. The phase-lag parameter (ppl, Equation 93) is inversely related to the settling velocity. An increasing sediment transport rate with increasing grain size is clearly observed in Figure 35(a). Bed-load formulas are in general not sensitive to the grain size, with a slight proportionality for coarser sand (see also Camenen and Larroudé 2003). The effect of the phase lag is significant for both the Dibajnia and Watanabe (1992) and the modified Camenen and Larson (2005b) formulas when d50 < 0.3 mm. The previous study by Watanabe and Isobe (1990) showed similar results for smaller wave periods (Tw = 3 sec). For coarser grain size, the Dibajnia and Watanabe (1992) formula predicts a decrease in bed-load transport (induced by the varying ωcr) that is not observed experimentally. The effect of grain size on the phase lag was introduced in the Camenen and Larson (2005b) formula through the settling velocity of the coefficients αj were found to be proportional to .
Figure 35. Influence of grain size on bed load sediment transport (details of input parameters for cases a and b are given in Table 11).
Table 11. Experimental conditions for studied cases on median grain size effect.
| Case | Data Set | h '(m)' | Uc '(m/sec)' | Uw '''''''(m/sec) | Tw '(sec)' | rw '(-)' |
| (a) | Dohmen-Janssen | 0.80 | 0.24 | 1.08 | 7.2 | 0.00 |
| (b) | Watanabe & Isobe | 0.31 | 0.00 | 0.69 | 3.0 | 0.20 |
Influence of wave orbital velocity
The phase-lag effect is proportional to the wave orbital velocity, and the higher Uw is, the larger the amount of sediment put in suspension (the available energy is greater) and the larger the sheet flow layer thickness (δs). This implies a larger delay between the instantaneous concentration and the shear stress and fluid velocity. However, the experiments by Dohmen-Janssen (1999) do not show the effect of the wave orbital velocity clearly. Nevertheless, by comparing plots (Figure 36(a), (b)) it may be observed that the increase in the sediment transport rate with Uw is much slower for d50 = 0.13 mm (Figure 36(a)) compared to d50 = 0.21 mm. Al Salem (1993) observed that the sediment transport is approximately proportional to the velocity moment to the power 3 (for a sinusoidal wave together with a current, ). If this relationship is applied to the data (Figure 36(b)) (i.e., ), it is found not to hold for case (a) where . For the experiments of Ribberink and Chen (1993) and Ahmed and Sato (2003), where the current was negligible (Figure 36(c) and (d)), the effect of the wave orbital velocity is obvious because the direction of the sediment transport changes with an increasing Uw. The Dibajnia and Watanabe (1992) formula, as well as the Camenen and Larson (2005b) formula with the coefficient rpl2 (Equations 102 and 110), tends to be overly sensitive to the wave orbital velocity. Occasionally a decrease in the net sediment transport rate with an increasing wave orbital velocity is estimated, whereas the opposite behavior is observed in the experiment (Figure 36(a) and (b)). However, it seems like the sheet-flow layer and the associated phase-lag effects appear quite abruptly. Thus, predictive formulas are in general difficult to calibrate.
Figure 36. Influence of wave orbital velocity on sediment transport (values of input parameters for cases a, b, c, and d are given in Table 12).
Table 12. Experimental conditions for studied cases on wave orbital velocity effects.
| Case | Data Set | d'50 '(mm) | h (m) | Uc '''''''(m/sec) | Tw '(sec)' | rw '(-)' |
| (a) | Dohmen-Janssen | 0.13 | 0.80 | 0.24 | 7.2 | 0.00 |
| (b) | Dohmen-Janssen | 0.21 | 0.80 | 0.40 | 7.2 | 0.00 |
| (c) | Ahmed & Sato | 0.21 | 0.31 | 0.00 | 3.0 | 0.20 |
| (d) | Ribberink & Chen | 0.13 | 0.80 | 0.03 | 6.5 | 0.25 |
The effect of the wave orbital velocity on the phase lag was introduced in the Camenen and Larson (2005b) formula through the root-mean-square values of the velocity Uwj (wave and current) for each half-period Twj. The coefficients αj were found to be proportional to .
Influence of wave period
The wave period is also a controlling factor for the phase lag and its effects on sediment transport: the shorter Tw is, the larger the amount of sediment still in suspension after half a period. Indeed, the delay in sediment settling before the change in the velocity direction strongly depends on the wave period. The two experiments by Dohmen-Janssen (1999) (with d50 = 0.13 and 0.21 mm; Figure 37(a) and (b), respectively) clearly show an increase in sediment transport rate with an increase in wave period as soon as sheet flow occurs. A bed-load formula based on the shear stress displays an inverse behavior, because the friction coefficient fw is inversely proportional to the wave period (because the boundary layer is getting thinner). The modified Camenen and Larson (2005b) formula exhibits the correct behavior, although the effect of fw sometimes remains larger than the introduced phase-lag parameter (Figure 37(b)). The experiments by Dibajnia (1991) (Figure 37(c) and (d)) illustrate how strong the effect of short wave periods can be. A change in the sediment transport direction for Tw 2 sec (sediment transport was observed to be in the direction of the waves for Tw = 4 sec and Uc > -0.2 m/sec). However, this effect may be overestimated due to the limitations of the experimental set-up. Dibajnia (1991) pointed out that the piston used in his experiment could not smoothly follow the input signal for periods Tw 1.5 sec. The generated vortex caused larger suspension and increased the phase-lag effects more than what normally should occur. The Dibajnia and Watanabe (1992) and Camenen and Larson (2005b) formulas predict a negative sediment transport rate even for higher values on the wave period (Figure 37(c)). If a slight phase lag tends to decrease the absolute value of the sediment transport rate for the Dibajnia and Watanabe (1992) formula, it increases the rate for the modified Camenen and Larson (2005b) formula. This latter behavior agrees better with the measurements. However, even if it is difficult to verify the behavior with the present data, it seems like the Camenen and Larson (2005b) formula (Equations 99 and 107) is too sensitive to the wave period. In spite of this, except for case 3, the Camenen and Larson (2005b) formula with the calibrated conceptual model (Equations 101 and 110) presents better behavior than the other formulas with respect to variations in Tw. The effect of the wave period on the phase lag was introduced in the Camenen and Larson (2005b) formula through the half-periods Twj, and the coefficients αj were found to be proportional to .
Figure 37. Influence of wave period on sediment transport (details of input parameters for cases a, b, c, and d are given in Table 13).
Table 13. Experimental conditions for studied cases on wave period effects (for Dibajnia experiments, maximum onshore wave orbital velocity is
approximately constant).
| Case | Data Set | d'50 '(mm) | h '(m)' | Uc '''''''(m/sec) | Uw '(m/sec)' | rw '(-)' |
| (a) | Dohmen-Janssen | 0.13 | 0.80 | 0.25 | 1.06 | 0.00 |
| (b) | Dohmen-Janssen | 0.21 | 0.80 | 0.25 | 1.06 | 0.00 |
| (c) | Dibajnia | 0.20 | 0.22 | -0.125 | 0.80 | 0.20 |
| (d) | Dibajnia | 0.20 | 0.22 | 0.125 | 0.80 | 0.20 |
Comparison with all data
A comparison with all the data is presented in this section. Figure 38 and Table 14 display the overall results shown for the original Camenen and Larson (2005b) formula (Figure 38(a)), the Dibajnia and Watanabe (1992) formula (Figure 38(b)), the Camenen and Larson (2005b) formula (Equations 99 and 107 and Figure 38(c)), and the Camenen and Larson (2005b) formula with the coefficient rpl (Equations 102 and 110 and Figure 38(d)). It clearly shows how significanat the introduction of phase lag in the formulas is. Even if the overall results (in terms of predictive skill within a factor 2, Px2, or 5, Px5) are not substantially improved (except for the modified Camenen and Larson (2005b) formula where results are improved by 10 percent), the general behavior of the formulas are better, and a significant decrease in the standard deviation of Δqs is obtained. It appears that the Dibajnia and Watanabe (1992) formula and the Camenen and Larson (2005b) formula with the coefficient rpl tend to underestimate the absolute sediment transport rate if a phase lag occurs. However, the coefficient rpl (Equation 102) is sensitive to the wave asymmetry if the current is negligible. Figures 35 to 37 reveal that the Dibajnia and Watanabe (1992) formula and Camenen and Larson (2005b) formula with the coefficient rpl do not induce any change below a critical value (of ωpl), and then tend to abruptly decrease the sediment transport rate. On the other hand, the modified Camenen and Larson (2005b) formula produces a more gradual modification of the sediment transport rate compared to the original formula (except with regard to the wave period), which seems closer to the trend in measurements. Finally, a comparison was made using the Camenen and Larson (2005b) formula with the parameter rpl proposed by Dohmen-Janssen et al. (2002) with δs = αs θcw d50 (where αs is a function of d50: αs = 13 when d50 > 2.1 mm, and αs = 35 when d50 = 1.3 mm). Similar to Equation 102, it improves the results if a phase lag occurs. However, the effects are often not strong enough because this analytical formula does not allow for sediment transport in the opposite direction, as was observed in the Ribberink and Chen (1993) and the Ahmed and Sato (2003) experiments.
| (a) | (b) |
| (c) | (d) |
'Figure 38. Comparison between predicted and measured sediment transport rate using (a) original Camenen and Larson formula, (b) Dibajnia and Watanabe formula,
(c) modified Camenen and Larson formula (Equations 99 and 107), and
(d) Camenen and Larson formula with coefficient '''rpl'''2 '(Equations 102 and 110).
Table 14. Prediction of bed-load transport rate within factor of 2 or 5 of measured values, together with mean value and standard deviation of Δ'''qs''''.
| Author(s) | Px'''2 (%) | Px'''5 (%) | Std ('''qs) | |
| Dibajnia and Watanabe (1992) | 42 | 75 | ||
| 7.0 | ||||
| Camenen and Larson (2005b) | 47 | 72 | ||
| 9.8 | ||||
| Equations 99 and 107 | 53 | 81 | -0.37 | 4.5 |
| Camenen and Larson (2005b) with Equations 102 & 110 | 50 | 74 | -0.003 | 7.0 |
| Camenen and Larson (2005b) with Dohmen-Janssen et al. equation (2002) for rpl | 48 | 71 | -0.003 | 6.8 |
Concluding remarks on phase-lag effects
In the present study, a large data set on sheet-flow transport was compiled and analyzed to improve the prediction of the bed-load transport rate if a phase-lag effect occurs. A simple conceptual model was proposed as well as a modification of the Camenen and Larson (2006) formula. This modification was suggested by the Dibajnia and Watanabe (1992) formula, which is the first and only formula found that takes into account the phase lag between the sediment transport rate and fluid velocity. The conceptual model for the correction of the sediment transport rate is based on the work by Dohmen-Janssen (1999), who assumed that the sediment transport is proportional to the product of the instantaneous velocity and concentration. In turn, the instantaneous concentration is assumed to depend on the square of the instantaneous velocity with a phase lag s > 0. This simple model allows a ratio to be derived that can reach -0.35 for a sinusoidal wave and -0.5 for a second-order Stokes wave. However, for a second-order Stokes wave, the model may diverge if the prediction is equal to zero without the phase-lag effects. The phase lag (s was calibrated against data, and (s was found to be a function of the parameter ωpl proposed by Dibajnia (1991). Even if significant scatter is observed, this function improves the behavior of the Camenen and Larson (2005b) formula markedly, and it is applicable to any other sediment transport formula. It also shows somewhat improved results compared to the analytical model by Dohmen-Janssen et al. (2002). A modification of the Camenen and Larson (2005b) formula was also proposed (Equations 107 and 108). It assumes that the characteristic Shields parameters for each half period θcw,onshore (> 0) and θcw,offshore (< 0) are modified if the sheet flow is reached. A decrease of on and an increase of αpl% on introduce a general decrease in the net sediment transport rate, and it may also change the direction of the sediment transport. The coefficients αj (j = c or t) were calibrated with the compiled data and were found to be proportional to the root-mean-square velocity over the half period and inversely proportional to the settling velocity and the half period Twj. These coefficient values are similar to those proposed by Dibajnia (1991, ωpl) and Dohmen-Janssen (1999, ppl). The new formula presents the best overall agreement with the data (Camenen and Larson 2006).
| Chapter 2 - General Sediment Transport Properties | Chapter 4 - Suspended Load |
![{\displaystyle {{q}_{sb}}={{C}_{b}}\,d{\sqrt {\frac {{{\mu }_{c}}{{\tau }_{c}}}{\rho }}}\exp \left[-0.27{\frac {\left({{\rho }_{s}}-\rho \right)gd}{{{\mu }_{c}}{{\tau }_{cw}}}}\right]}](https://en.wikipedia.org/api/rest_v1/media/math/render/svg/eabb9655252a6edaee70fab3850370d8479db66b)


![{\displaystyle {{\tau }_{cw}}=\left[1+0.5{{\left({{\xi }_{B}}{\frac {{U}_{w}}{{U}_{c}}}\right)}^{2}}\right]{{\tau }_{c}}}](https://en.wikipedia.org/api/rest_v1/media/math/render/svg/e480815edb14968df2c86b1285c6eb91e635cb8f)


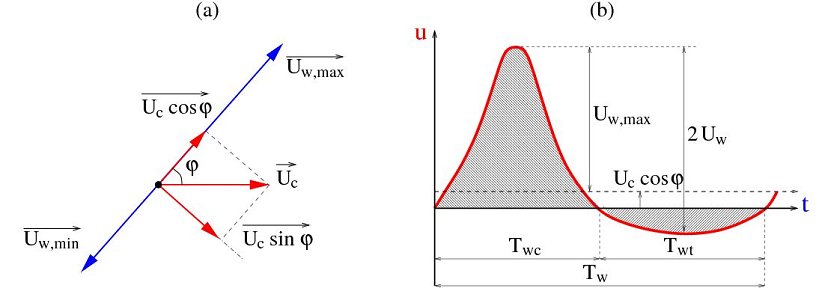


![{\displaystyle {\begin{aligned}&{{\omega }_{cr}}=0.03\quad \quad \quad \quad \quad \quad \quad \quad \quad \quad \quad \ \ \ \,{\text{if}}\quad {{\theta }_{cw,\max }}\leq 0.2\\&\quad \ \,=1-0.97{{\left[1-{{\left({\frac {{{\theta }_{cw,\max }}-0.2}{0.4}}\right)}^{2}}\right]}^{0.5}}{\text{if}}\quad 0.2<{{\theta }_{cw,\max }}<0.6\\&\quad \ \,=1\quad \quad \quad \quad \quad \quad \quad \quad \quad \quad \quad \quad \,\quad \ \,\,{\text{if}}\quad 0.6<{{\theta }_{cw,\max }}\\\end{aligned}}}](https://en.wikipedia.org/api/rest_v1/media/math/render/svg/e442aa11de7fadbe781b42afdebf19bc0f07a815)
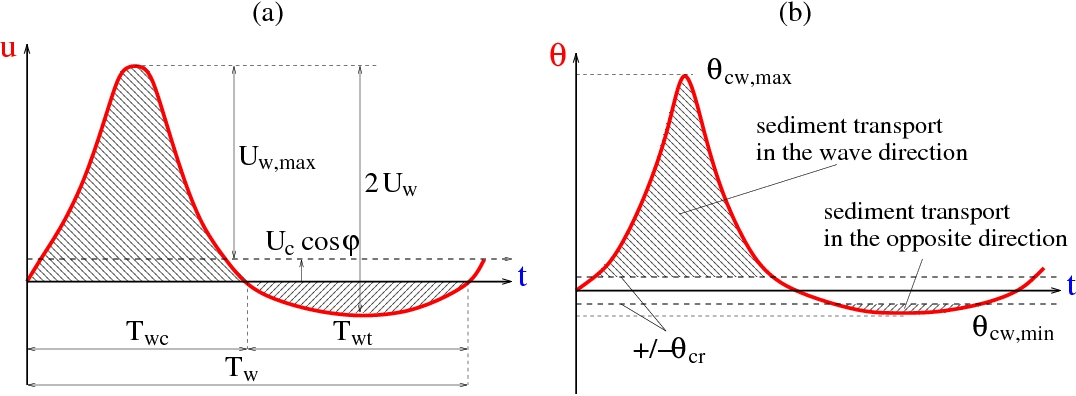
![{\displaystyle {{\vec {q}}_{sb}}={{m}_{Rib}}{\sqrt {\left(s-1\right)g\ {{d}^{3}}}}<{{\left({\overrightarrow {\left|\theta \right.\left(t\right)}}\left|-{{\theta }_{cr}}\right.\right)}^{{n}_{Rib}}}{\frac {\left[{\overrightarrow {\theta \left(t\right)}}\right]}{\left|\theta \left.\left(t\right)\right|\right.}}}](https://en.wikipedia.org/api/rest_v1/media/math/render/svg/ef68d1ee808763edd7612634626243fde615d19a)
![{\displaystyle {\vec {\theta }}\left(t\right)=0.5\ {{f}_{cw}}\left|u\left(t\right)\right|{\vec {u}}\left(t\right)/\left[\left(s-1\right)\ g\ d\right]}](https://en.wikipedia.org/api/rest_v1/media/math/render/svg/ebedd7942c5427d426035326becf4243d51c87b7)

![{\displaystyle {{k}_{st}}=\max \left\{{{k}_{s}}{\text{;}}d\left[1+6\left(<\left|\theta \left(t\right)\right|>/{{\theta }_{cr}}-1\right)\right]\right\}}](https://en.wikipedia.org/api/rest_v1/media/math/render/svg/deebf094b2242be5e2f9a32cbf2fa6bdc311d9da)


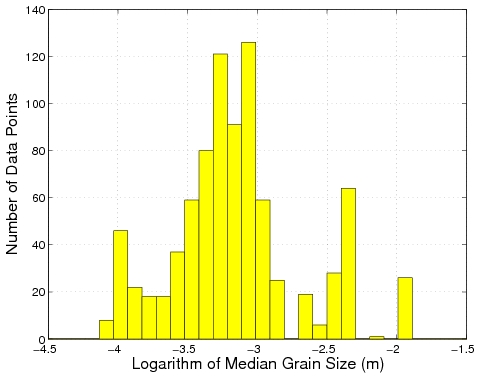
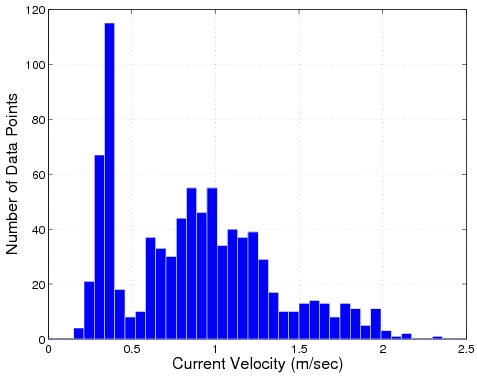
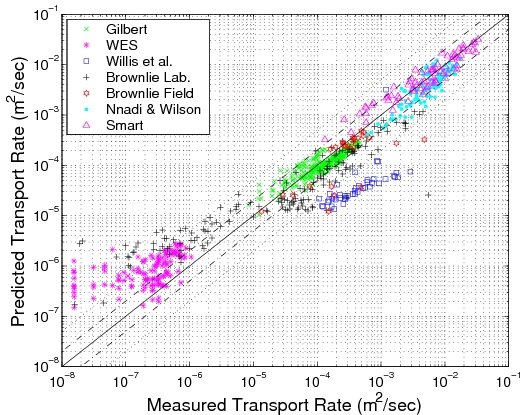
![{\displaystyle {{E}_{rms}}={\frac {1}{n}}\sum {{\left[{\text{Log}}\left({\frac {{q}_{sb,pred}}{{q}_{sb,meas}}}\right)\right]}^{2}}}](https://en.wikipedia.org/api/rest_v1/media/math/render/svg/78aa9e9eb4e713a885a34cf34adaca821f1bf817)
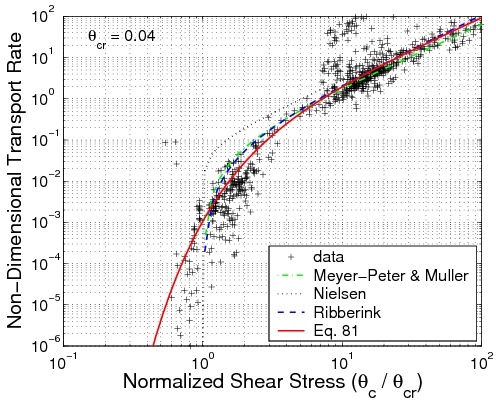


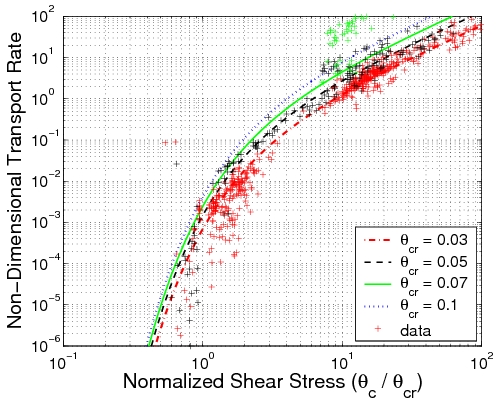
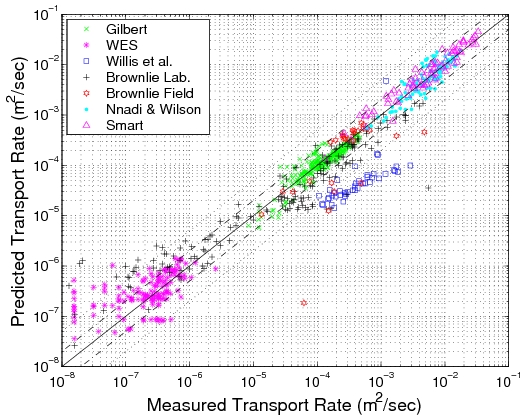


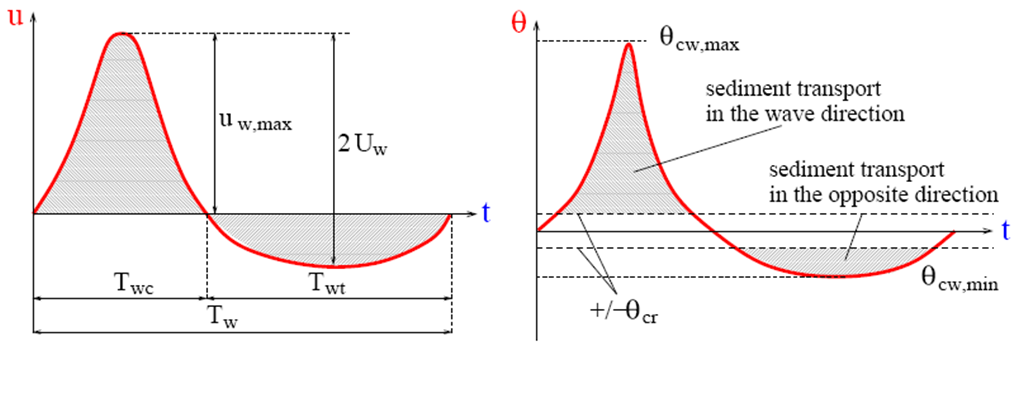


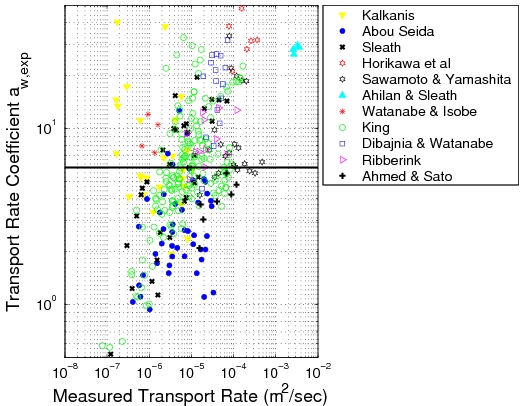
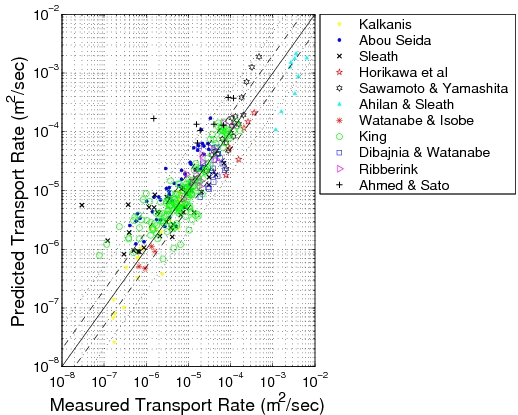
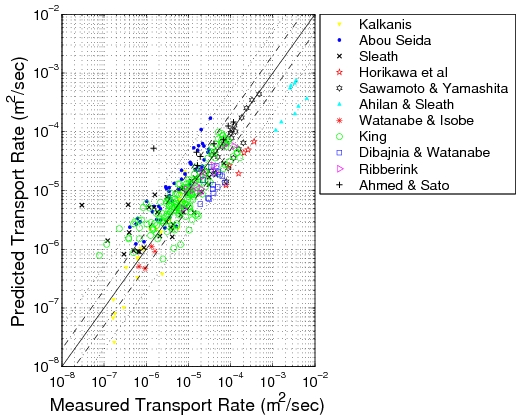

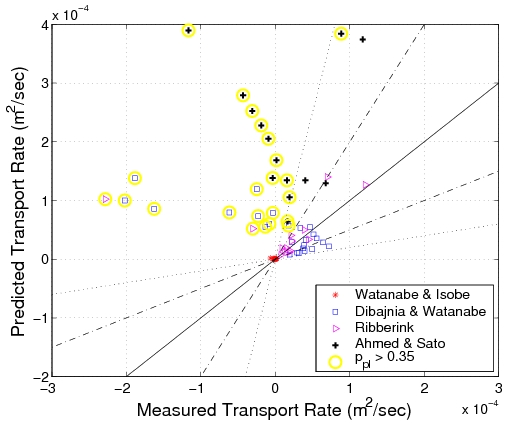


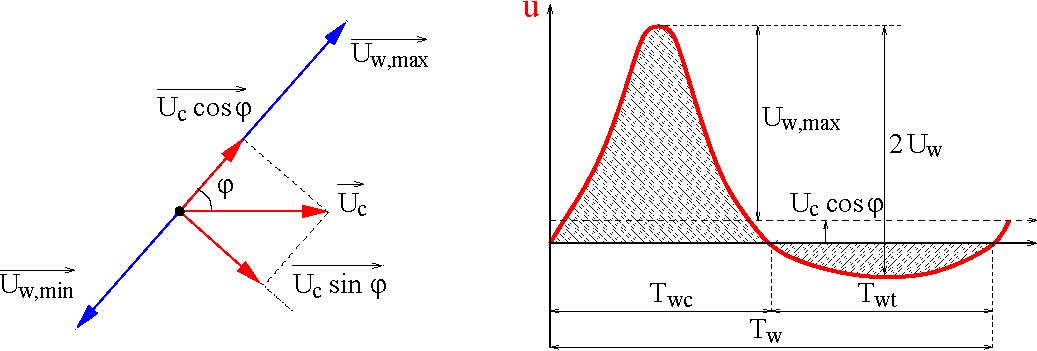


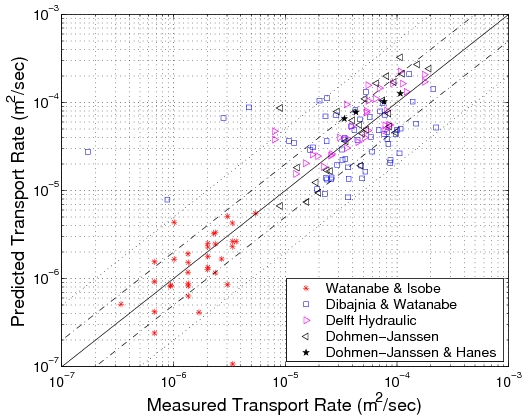
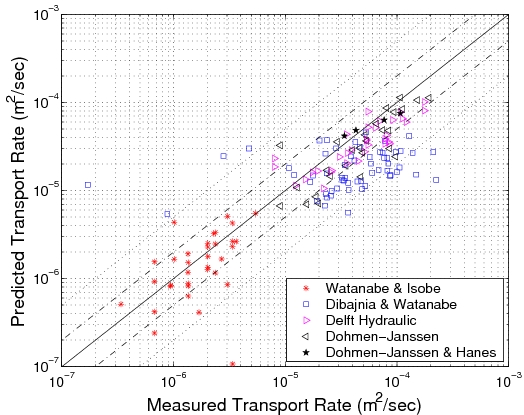
![{\displaystyle {\begin{aligned}&{{r}_{pl1}}={\frac {{q}_{s,net}}{{q}_{s,net,{{\phi }_{s}}=0}}}={\frac {\int _{0}^{{T}_{w}}{\left({{r}_{u}}+\cos \omega t\right){{\left[{{r}_{u}}+\cos \left(\omega t+{{\phi }_{s}}\right)\right]}^{2}}dt}}{\int _{0}^{{T}_{w}}{{{\left({{r}_{u}}+\cos \omega t\right)}^{3}}dt}}}\\&\quad \,\ \,={\frac {r_{u}^{2}+1/2+X}{r_{u}^{2}+3/2}}\\\end{aligned}}}](https://en.wikipedia.org/api/rest_v1/media/math/render/svg/32b1ac1b7a0bf48e8634d4890bd5ec2b85fcc4d6)
![{\displaystyle {\begin{aligned}&{{r}_{pl2}}={\frac {\int _{0}^{{T}_{w}}{\left({{r}_{u}}+\cos \omega t+{{r}_{w}}\cos 2\omega t\right)}{{\left[{{r}_{u}}+\cos \left(\omega t+{{\phi }_{s}}\right)+{{r}_{w}}\cos 2\left(\omega t+{{\phi }_{s}}\right)\right]}^{2}}dt}{\int _{0}^{{T}_{w}}{{{\left({{r}_{u}}+\cos \omega t+{{r}_{w}}\cos 2\omega t\right)}^{3}}dt}}}\\&\quad \ \,\,={\frac {r_{u}^{3}+{{r}_{u}}\left[1/2+X+r_{w}^{2}\left(2{{X}^{2}}-1/2\right)\right]+{{r}_{w}}\left({{X}^{2}}+X-1/2\right)/2}{r_{u}^{3}+3/2{{r}_{u}}\left(1+r_{w}^{2}\right)+3/4\ {{r}_{w}}}}\\\end{aligned}}}](https://en.wikipedia.org/api/rest_v1/media/math/render/svg/a193bdcfdb7d4a75528d66d2f5ea325f799cae26)


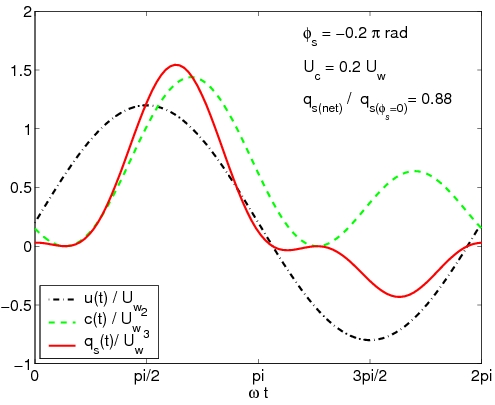
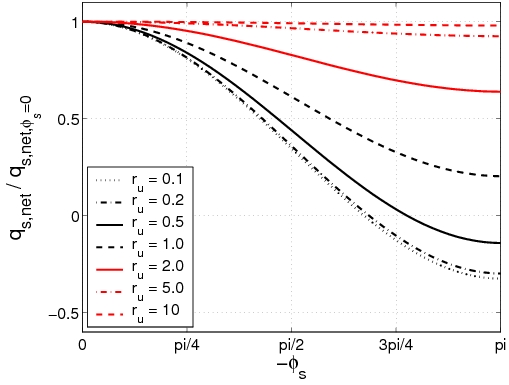
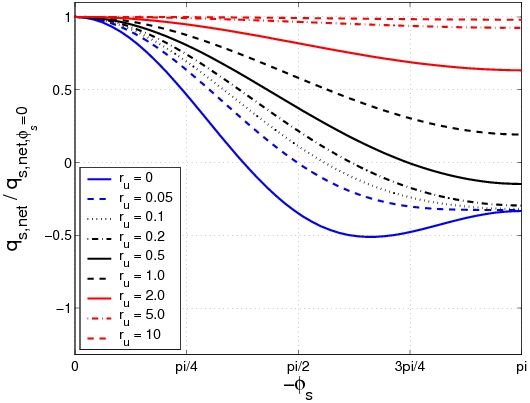
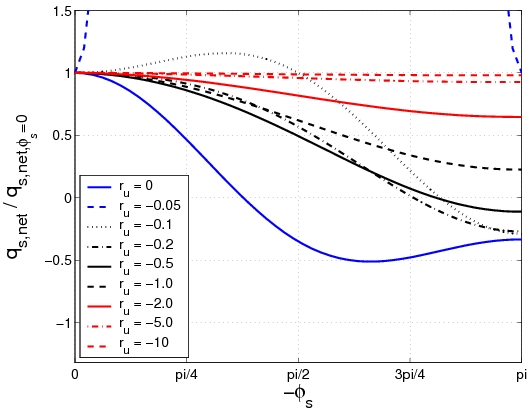
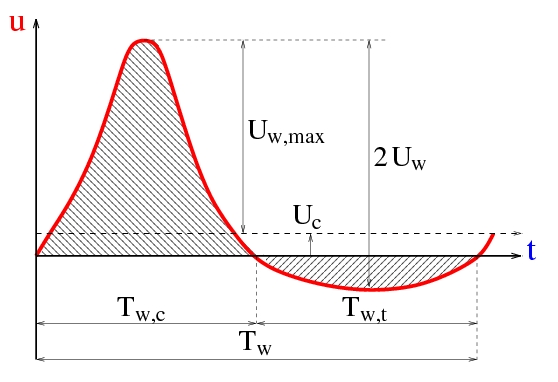


![{\displaystyle {{\alpha }_{j}}={\frac {{{\nu }^{0.25}}U_{wj}^{0.5}}{{{W}_{s}}{{T}_{j}}^{0.75}}}\exp \left[-{{\left({\frac {{U}_{w,cr,sf}}{{U}_{cwj}}}\right)}^{2}}\right]}](https://en.wikipedia.org/api/rest_v1/media/math/render/svg/dbc4ce2040ec8933da1ba5e308da5c1372e929c3)

![{\displaystyle {{r}_{pl,CL}}={{\left[{\frac {\left(1-{{\alpha }_{pl,b}}\right){{\theta }_{w,onshore}}+\left(1+{{\alpha }_{pl,b}}\right){{\theta }_{w,offshore}}}{{{\theta }_{w,onshore}}+{{\theta }_{w,offshore}}}}\right]}^{0.5}}}](https://en.wikipedia.org/api/rest_v1/media/math/render/svg/948d0c3949d73256b0863bc2e7000584324812e2)


