CR-07-1:Chapter2
General Sediment Transport Properties
In this chapter, selected general properties of sediment transport are discussed.
Physical properties of particles
Granulometry
Most beach sediment found is made of quartz (SiO2). The density of the sediment is, thus, typically assumed to be ρs = 2,650 kg/m3. However, shells are not negligible on some beaches, and they have a lower density (ρs = 2,400 kg/m3 for limestone).
Sediment grains are often classified according to their diameter into clays, silts, sands, granules, pebbles, cobbles, and boulders (Soulsby 1997). The characteristic diameter is usually chosen as the equivalent diameter of the sphere that has the same volume as the grain. A commonly used classification of sediments among geologist is the d scale defined by:
| (1) |
where d is the sediment diameter in millimeters.
Table 1 shows the d scale for classification of different types of sand.
Table 1. Classification of different types of sands (after Falques and Swart 1998).
| Nature | Very Fine Sand | Fine Sand | Medium Sand | Coarse Sand |
| d (mm) | 0.125 | 0.25 | 0.5 | 1.0 |
| d | 3.0 | 2.0 | 1.0 | 0.0 |
The grain-size distribution of sand may be represented by histograms with a frequency distribution or by a cumulated frequency distribution (Figure 5a and 5b, respectively). From these distributions, several parameters may be estimated:
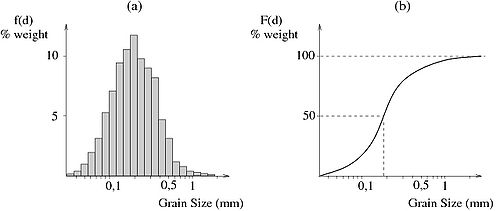
Figure 5. Example of grain-size distribution (after Fredsøe and Deigaard 1994).
- dk (0 < k < 100): k equals percent of particles by weight for which the diameter is less than dk.
- median diameter: d50.
- standard deviation:
- .
Porosity and friction angle
The porosity is defined as follows:
| (2) |
where Vtot is the total volume, Vmat is the volume of sediment, and c the volume concentration of the sediment. For a natural mix of noncohesive sediments, p 0.4.
The internal friction angle is the angle to the horizontal at which grains start to roll on a flat bed of sediment that is gradually tilted from the horizontal (Soulsby 1997). For non-cohesive sediments, the internal friction angle depends on the shape, sorting, and packing of the grains. Table 2 presents some typical values.
Table 2. Internal friction coefficient (after Migniot 1977).
| Nature | Beach Sand | Packed Sand | Gravel | Debris |
| Internal friction (deg) | 28-32 | 34-38 | 35-40 | 40-50 |
Settling velocity
A sediment particle under settling conditions in quiescent water is subject to its own weight (gravity force) and fluid resistance due to its movement (friction force). The fluid resistence is mainly characterized by the particle Reynolds number :
| (3) |
where Ws is the sediment fall speed, and is the kinematic viscosity of water (equal to 10−6 m2/sec at 20(C). Assuming a spherical particle with a diameter d, a force balance leads to:
| (4) |
where s and are the density of sediment and water, respectively, and g is the acceleration due to gravity. Stokes (1851) found that the drag coefficient CD is directly related to the particle Reynolds number , for low values of (< 1), through the relationship:
| (5) |
with A = 24 for spherical particles (24 < A < 34 for natural sediment particles).
From Equations 4 and 5, the well-known expression for the settling velocity of spherical particles can be derived as:
| (6) |
where 3A/4 = 18 for spheres (Stokes law), and s (= s/) is the relative density.
For large Reynolds numbers ( $gt; 105), the drag coefficient is found to be constant:
| (7) |
with B = 0.39 for spherical particles, and 1 < B < 1.3 for natural sediment particles. This condition yields a settling velocity of:
| (8) |
Many semi-empirical formulas have been developed to estimate the settling velocity for weak concentrations based on these two asymptotic behaviors (see Camenen 2007). Figure 6 shows comparisons of several formulas with data from experiments with natural sand. All the studied formulas yield similar results. A simple relationship has been proposed by Soulsby (1997):
| (9) |
where is the dimensionless grain size.
If the suspended concentration of sediment increases, the settling velocity of individual particles decreases because of the return flow induced by neighboring particles (hindered settling). For example, if the mass concentration reaches 100 g/L, the fall speed becomes 50 percent less than for a single particle. The hindered fall speed may be described by the Richardson and Zaki (1954) equation based on a large set of data on sedimentation and fluidization:
| (10) |
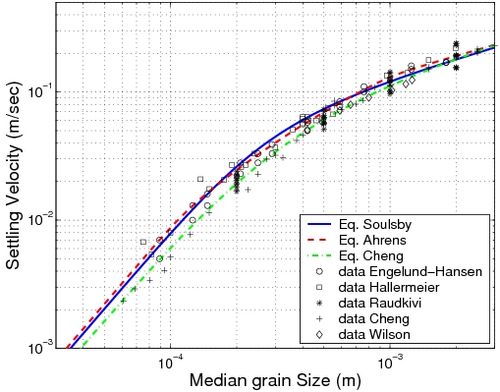
Figure 6. Settling velocity for sediment with comparison of several formulas against measurements (for details on data and equations, see Camenen 2007).
where Wsh is the hindered settling velocity, and 2.0 < n < 5.0 is an empirical coefficient. Using the limiting values of the coefficient n obtained by Richardson and Zaki (1954) and assuming an infinite system, Rowe (1987) proposed an empirical fitting for n as a function of the particle Reynolds number :
| (11) |
Camenen (2007) observed that Equation 10 is no longer valid if the concentration approches its maximum value . He proposed a simple modification of the formula by Richardson and Zaki (1954).
Soulsby (1997) modified his own formula to include the effect of concentration:
| (12) |
Shape (angular or spherical sand), and temperature can also influence the settling velocity, yielding a deviation of as much as 50 percent from standard values (natural sand is more or less spherical).
Shear stresses and friction coefficients
Bottom boundary layer flow
With respect to sediment transport rate prediction, the most important part of the flow occurs in the bottom boundary layer. This layer is defined as that where the flow is significantly influenced by the bed (Figure 7). There are various ways to define the bottom boundary layer thickness δ in quantitative terms. In qualitative terms, Nielsen (1992) proposed the formula:
| (13) |
where is the eddy viscosity, and T the flow period. For a steady current (e.g., tidal flow), δ = h, where h is the water depth, whereas for waves δ is small compared to h.
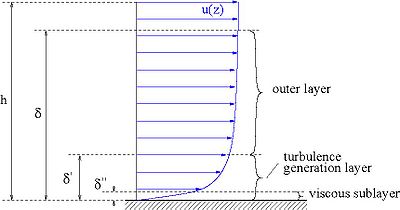
Figure 7. Turbulent boundary layer structure with mean velocity profile.
In the viscous sublayer, turbulent fluctuations in velocity are present, but attenuated due to the presence of the bottom. Thus, the shear stress τ can be modeled approximately by the laminar boundary layer relationship:
| (14) |
where u is the horizontal velocity. The turbulence generation layer is characterized by energetic small-scale turbulence and large fluid shear. If the bottom roughness is larger than the viscous layer, the turbulence generation layer extends to the bottom. Boussinesq (1872) introduced the eddy viscosity concept, which is defined by analogy to Equation 14 as:
| (15) |
The turbulent eddy viscosity can be expressed as:
| (16) |
where z is a vertical coordinate, κ (= 0.4) the Von Karman constant, is called the shear velocity, and τb is the shear stress at the bed level (z = 0).
The outer layer is characterized by much larger eddies, which are more efficient at transporting momentum, producing a more gradually varying velocity profile compared to the turbulence generation layer.
The bottom shear velocity for a current is defined as:
| (17) |
where τc is the bottom shear stress produced by mean current. The shear velocity u*c is a function of the velocity profile over the depth. For the classical logarithmic profile, the following relationship may be derived:
| (18) |
where z0 is the value of z at which u = 0.
By averaging Equation 18 over depth, the shear velocity can also be linked to the mean velocity over the depth via the non-dimensional current drag or friction coefficients CD or fc, respectively:
| (19) |
The bottom shear stress can be expressed as follows:
| (20) |
Assuming a logarithmic velocity profile (hydraulically rough flow regime), the relationship for the current friction coefficient becomes:
| (21) |
where z0 = ks/30 is the bed roughness length, and ks,g 2d50 holds for a plane bed, in which ks,g is the Nikuradse bed roughness due to skin friction, and d50 is the median grain size.
In the same way, the maximum bed shear stress produced by waves is related to the bottom wave orbital velocity via a friction coefficient (Jonsson 1966):
| (22) |
where Uw is the bottom wave orbital velocity, and fw is the wave friction coefficient. This friction coefficient is a function of the flow regime (hydraulically rough or smooth), thus a function of a wave-related Reynolds number w and the relative roughness r:
| (23) |
where is the bottom wave excursion, Tw the wave period, and ks the Nikuradse roughness, as previously discussed.
Because the nearshore zone is an energetic environment, only rough turbulent flows will typically occur. Several formulas have been proposed for the wave friction coefficient:
Kajiura (1968), for r 30:
| (24) |
Swart (1974):
| (25) |
Nielsen (1992), for all values of r:
| (26) |
Soulsby (1997), for all values of r:
| (27) |
Figure 8 compares these equations. The result remains similar for the four studied formulas. However, some divergences appear for very low () and very large () relative roughnesses.
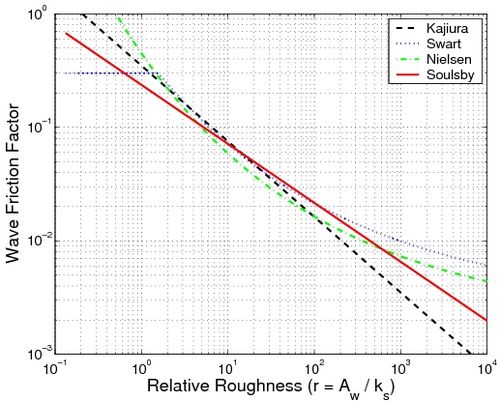
Figure 8. Wave friction coefficients for plane bed predicted by different formulas.
Combined wave and current shear stress
In most coastal processes studies, the sediment dynamics are simultaneously influenced by both waves and currents. However, the wave and current interaction is not linear, the wave phase and wavelength are modified, and current refraction of waves appears. A difficulty is to estimate nonlinear effects. Figure 9, refers to the situation cw,m c and res, with being the angle between the mean current direction and the wave incidence direction, and res the angle between the resultant maximum shear stress and the mean current direction.

Figure 9. Schematic diagram for non-linear interaction between wave and
current bed shear stress (after Soulsby et al. 1993).
Many formulas are available to compute the mean shear stress cw,m and the maximum shear stress cw,max due to the wave and current interaction. Such formulas include analytical models (Grant and Madsen 1979; Fredsøe 1984) and numerical models (Davies et al. 1988; Huynh-Thanh and Temperville 1991). Soulsby (1997) proposed a simple empirical method to compute these shear stresses based on results from previous studies. Van Rijn (1984a, 1993) proposed an empirical formulation to compute mean shear stress using a simple correction term for current shear stress:
| (28) |
with , where δw is the wave-boundary layer thickness, and ka and ksc are the apparent bed roughness and total bed roughness, respectively, due to the current.
For the general case of combined wave and current flow, the maximum combined bottom shear stress may be obtained from Soulsby (1997):
| (29) |
| (30) |
Bed form effects and roughness computation
Bed forms modify the flow and sediment transport, especially sediment suspension, because the induced vortices and the bed slopes generate significant vertical velocities. These velocities carry many sand grains into suspension and change the equilibrium concentration profile of the sand. Figure 10 presents typical bed forms for a steady current and a simple wave orbital velocity.

Figure 10. Schematic of ripples due to current (a) and waves (b).
Current ripples, dunes, and wave ripples
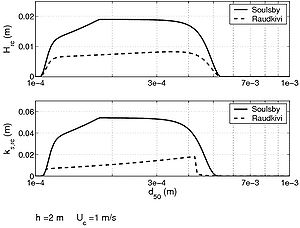
Bed forms generated by a current are asymmetric and travel downstream. In a weaker transport regime (Froude number Fr < 1), and erosion occurs on the stoss side and deposition on the lee side. The slope of the lee side is equal to the critical stability slope for sediment and grains move by avalanching on that side. Numerous empirical formulas exist to estimate height and wavelength of various bed forms (Yalin 1977; Van Rijn 1984c; Raudkivi 1998). A comparison is presented in Figure 11. Because significant scatter is observed in the data and the predictions of the empirical formulas, only order-of-magnitude estimates are attempted in this report.
Ripple length and height (Lrc and Hrc, respectively) generated by a current are mainly a function of the grain size:
| (31) |
| (32) |
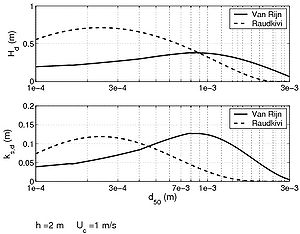
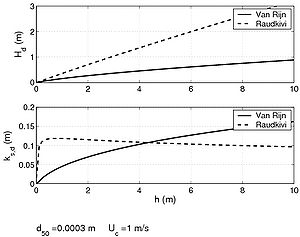
Dune wavelength and height (Ld and Hd, respectively) are mainly a function of water depth:
| (a1) | |
 |
|
| (b1) | (b2) |
 |
 |
| (c1) | (c3) |
 |
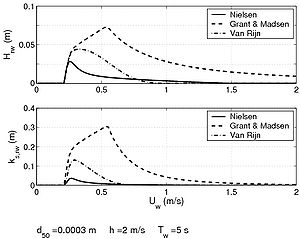 |
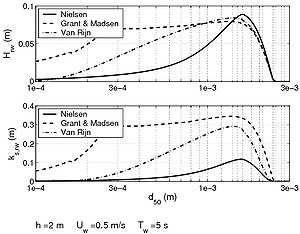
Figure 11. Influence of grain size diameter (1), water depth (2), and wave orbital velocity (3); on bed-form predictions for current ripples (a), dunes (b), and wave ripples (c); and on roughness prediction according to different formulas.
| (33) |
| (34) |
Van Rijn (1993) proposed a relationship for dune height that is also a function of grain size, valid for the conditions that θcr < θc < 26 θcr):
| (35) |
where c is the current-related Shields parameter (see Equation 48), and cr is the threshold Shields parameter for the inception of motion.
Contrary to current-related bed forms, wave ripples are symmetric with sharper crests due to the to-and-fro movement of the wave orbital velocity. Many empirical formulas are also available to describe the properties of wave ripples (Grant and Madsen 1982; Van Rijn 1984c; Nielsen 1992) based on experimental studies yielding varying results (Figure 11). Wave ripple characteristics can be summarized through the following relationships:
| (36) |
where Aw is the wave excursion over the bottom. The value of 0.1 corresponds to vortex formation and 0.25 to slope stability. Van Rijn (1984c, 1989) proposed a simple relationship for irregular waves where ripple properties are a function of the mobility parameter Ψ:
| (37) |
 |
(38) |
Figure 11 present various results for bed-form predictions. The uncertainties involved in these kinds of computations must be noted. Indeed, for each of the displayed case studies, a factor 2 variation can be observed regarding bed-form prediction with a sensitivity that varies with water depth and grain size.
Computation of various roughnesses
For ripples generated by a current or wave, the Nikuradse roughness can be computed in the same way:
| (39) |
where Ar varies from 10 to 30 depending on author, and the subscript r denotes ripple. For mega-ripples or dunes, Van Rijn's (1984c) method can be used:
| (40) |
Another form of roughness appears for sheet flow, where the "sediment fluid layer" significantly influences the boundary layer and, thus, the roughness. Several empirical formulas exist to estimate the Nikuradse roughness due to sediment transport (see Dohmen-Janssen 1999). However, significant scatter can be observed according to the author, as well as specifically through the published data (Figure 12). The most accurate relationship appears to be the equation developed by Wilson (1966, 1989a, b) based on an experimental study in a pressurized closed conduit:
| (41) |
where is the Shields parameter (Equation 48). It should be noted that this expression leads to an iterative computation. However, as shown in Figure 12 (Camenen et al. 2006), the Nikuradse roughness in the sheet flow regime appears to be a function also of a dimensionless settling velocity (W*) and/or the suspension parameter (), which are defined by, respectively:
| (42) |
| (43) |
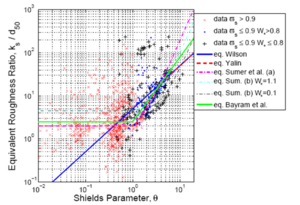
'Figure 12. Equivalent roughness ratio '''ks/'''d50 'versus total Shields parameter θ for compiled data set together with predictions by studied formulas
(for details on data and equations see Camenen et al. 2006).
Calculation of the total roughness
A method to compute the total shear stress from the total roughness can be described by the following steps (see Soulsby 1997):
| 1. | Current bed forms. |
| Calculation of the total Nikuradse roughness due to the current alone: |
| (44) |
- Calculation of the total friction coefficient fct (see Equations 19 and 21 with z0 = ks,c/30):
| (45) |
| 2. | Wave bed forms. |
| Calculation of the total Nikuradse roughness due to waves only: |
| (46) |
- Calculation of the total friction coefficient fwt (Equation 26 with z0 = ks,w/30):
- Calculation of the total shear stress due to waves only:
| (47) |
| 3. | Wave and current interaction. Calculation of the total shear stress |
according to the Soulsby method (see Soulsby 1997).
Shields parameter and sediment transport
Threshold of motion and critical Shields parameter
Threshold of motion occurs if the bed shear forces acting to move the grain become greater than the friction forces counteracting them (assumed proportional to the submersed weight of the grain (proportional to ). The threshold appears if the Shields parameter reaches a critical value:
| (48) |
where θ is the Shields parameter due to current or waves, and τ the associated shear stress.
Shields (1936) noted a relationship between the critical or threshold Shields parameter and the mean grain size. Figure 13 shows results obtained from several data sets. A simple formula proposed by Soulsby and Whitehouse (1997) is given by:
| (49) |
Suspended load appears for slightly greater shear stresses ( = cr,s 0.1, Figure 13). This stage corresponds mainly to the ripples being present that induce suspended sediment. Sheet flow conditions are observed for yet greater shear stresses, above approximately = cr,sf 0.8.
Modes of sediment transport
Sediment transport has been categorized into three modes (Figure 14):
- Bed load: sand grains roll, slip, or jump (saltate) over the bed.
- Suspended load: sand grains are lifted over the bed and transported by the current.
- Sheet flow: sand grains under imposed stresses move in large quantities as a sheet layer (a few grain diameters thick).
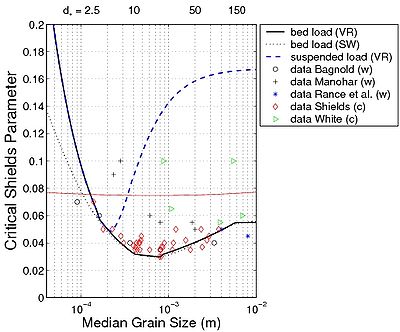
Figure 13. Critical Shields parameter plotted against dimensionless grain size (equations for bed-load limit are from Van Rijn (1993) and Soulsby and Whitehouse (1997); equation for suspended load limit is from Van Rijn (1993)), compared to data with current ('''c''') or waves ('''w''') (for details on data see Hanson and Camenen 2007).

Bed load Suspended load Sheet flow
Figure 14. Modes of sediment transport (after Fredsøe and Deigaard 1994).
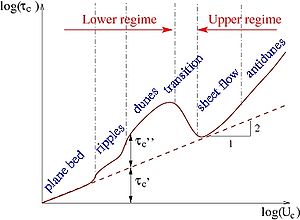
Considering the behavior of bed forms, for a specific sediment, the magnitude of the shear stress strongly depends on the current and/or wave orbital velocity. Figure 15 presents a schematic view of these dependencies.
| (a) |
 |
| (b) |
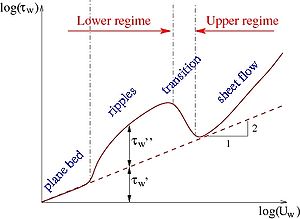 |
Figure 15. Schematic representation of different bed forms and sediment transport regimes for (a) increasing current, or (b) wave orbital velocity.
Inception of sheet flow
The inception of sheet flow occurs in a situation where the wave ripples are disappearing, simultaneously as the energy is increasing (increasing wave orbital velocity and/or mean current). Typically, engineers assume that the sheet flow regime occurs when the Shields parameter reaches a critical value of cr,sf 0.8. However, the Shields parameter seems to be an ineffective measure to distinguish between suspended load and sheet flow transport. Bowen (1980) and Shibayama and Horikawa (1982) proposed using the ratio Uc/Ws to distinguish bed load, suspended load, and sheet flow mode in an energetics model of sediment transport. This is illustrated in Figure 16.
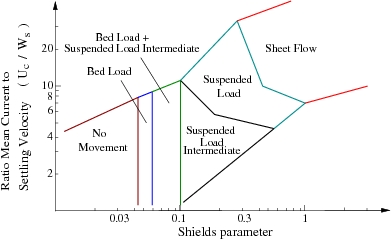
'Figure 16. Classification of different types of sediment transport with respect to Shields parameter θ and ratio '''Uc/'''Ws '(after Shibayama and Horikawa 1982).
Previous studies. In an extensive investigation, Manohar (1955) was the first to study the initiation of sheet flow by means of an oscillatory tray (OT). Chan et al. (1972) used a horizontal tube (HT) to investigate the behavior of a bed of particles under oscillatory flow for different kinematic viscosities of the fluid. More recently, several authors observed the disappearance of the ripples in Oscillating Water Tunnels (OWT) (Horikawa et al. 1982; Sawamoto and Yamashita 1986; Sato 1987; Dibajnia 1991). Table 3 summarizes the data sets compiled in the present study, where the type of flow motion (experimental set-up), the number of data points, the sediment properties (material used, relative density, median grain size), and the range of values for the main hydrodynamic parameters (critical wave orbital velocity at which the ripples start disappearing Uw,cr and wave period, Tw). As Dibajnia (1991) noted, different definitions of the inception of sheet flow exist (e.g., disappearance of the ripples, modification of the energy dissipation) and, thus, induce some uncertainty in the experimental results depending on the definition used by the author(s).
Table 3. Summary of data sets on inception of sheet flow under oscillatory flow.
| Author(s) | Exp. | Number | Material | sec | D50, mm | Uw,cr, m/sec | Tw, sec |
| Manohar (1955) | OT | 139 17 |
Sand Plastic |
2.46-2.65 1.05, 1.28 |
0.2-1.98 3.17 |
0.54-1.25 0.32-0.73 |
1.0-4.6 2.9-9.3 |
| Chan et al. (1972) | HT | 3 8 25 30 16 |
Polystyrene Cane sugar Sand Glass beads Iron ore |
1.32 (1.4) 1.97 (1.55) 1.97-2.55 2.05-2.65 3.95-5.10 |
0.36 0.25, 0.50 0.25-1.09 0.09-0.50 0.18-0.50 |
0.23-0.29 0.31-0.57 0.33-0.86 0.35-1.12 0.63-1.73 |
1.2-2.2 0.8-2.3 0.8-2.5 0.8-2.5 0.8-2.3 |
| Horikawa et al. (1982) | OWT | 17 19 |
Sand Plastic |
2.66 1.18-1.56 |
0.22-0.70 0.28-4.00 |
0.56-1.15 0.40-1.68 |
3.5-7.0 3.0-7.0 |
| Sawamoto and Yamashita (1986) | OWT | 4 | Sand, plastic | 2.65, 1.58 | 0.20-1.60 | 0.20-1.01 | 3.8 |
| Sato (1987) | OWT | 3 | Sand | 2.65 | 0.18 | 0.47-0.56 | 0.8-2.0 |
| Dibajnia (1991) | OWT | 18 | Sand | 2.65 | 0.20 | 0.62-0.96 | 1.0-4.0 |
Manohar (1955) and Komar and Miller (1975) introduced similar criterion for the inception of sheet flow using a function, which included the wave-related mobility parameter Ψw, the wave-related Shields parameter θw, and the grain-size Reynolds number *w, given as follows:
| (50) |
| (51) |
| (52) |
where Uw is the wave orbital velocity. Chan et al. (1972) investigated the effect of kinematic viscosity and relative particle density on the inception of sheet flow. They observed that wave period is of greater importance for the inception of sheet flow compared to what previous studies established. They arrived at the following relationship, introducing the Stokes boundary layer :
| (53) |
Sawamoto and Yamashita (1986) proposed a similar equation, but they modified the coefficient values (2/3 instead of 0.8 and 36 instead of 43.6).
Dibajnia (1991) developed a new formula based on the Chan et al. (1972) study. He introduced a parameter ωpl for the inception of sheet flow defined as:
| (54) |
The criterion proposed by Dibajnia (1991) may be written as follows:
| (55) |
Dibajnia (1991) also investigated the effect of an asymmetric wave for which the maximum wave orbital velocity should be employed in applying Equation 55.
You (1999) re-examined the Manohar (1955) data and proposed an iterative relationship for the critical orbital velocity that is a function of the scaled dimensionless immersed sediment weight :
| (56) |
with , and where ω = 2π/Tw is the angular frequency of the wave.
Comparison with laboratory data. Table 4 lists predictions of the critical orbital velocity within a factor of 1.25 (P25) of the measured values presented for the formulas discussed in the previous section ("factor of x" means between x times and 1/x times the measured critical orbital velocity Uw,cr,sf,meas). The results are given for all the data as well as for the Manohar (1955) data only (because many authors compared their results to this data set only). The table also presents the mean value of the difference ΔUw = Uw,cr,sf,pred - Uw,cr,sf,meas and its standard deviation.
It appears that the Manohar (1955) and Dibajnia (1991) criteria yield the best overall results: and (in brackets are the values for the Manohar data set only given). The Chan et al. (1972) and Sawamoto and Yamashita (1986) criteron (calibrated with their own data set) show reasonable overall behavior, but tend to underestimate the values from the Manohar data set. A similar comment can be made concerning the equation proposed by Komar and Miller (1975), even if their calibration was made using the Manohar data only. This could be a result of the expression used to compute the friction coefficient (ks = 2d50) or because of the iterative approach to solve the equation (the friction factor fw is a function of the wave orbital velocity). The complexity of the equation proposed by You (1999) clearly illustrates the limits of fitting with a single data set (Manohar 1955): the equation predicts negative values on Uw,cr,sf for some points in the Chan et al. (1972) data set.
Table 4. Prediction of critical wave orbital velocity for inception of sheet flow within factor of 1.25 together with mean value and standard deviation of Δ'''Uw''''.
| Author(s) | All Data | Manohar Data | ||||
| P'25 '(%) | Std ('''Uw) | P25, (%) | Std ('''Uw) | |||
| Manohar (1955) | 67 | |||||
| 0.31 | 92 | -0.04 | 0.11 | |||
| Chan et al. (1972) | 43 | -0.11 | 0.28 | 28 | -0.21 | 0.13 |
| Komar & Miller (1975) | 62 | -0.04 | 0.25 | 72 | -0.12 | 0.10 |
| Sawamoto & Yamashita (1986) | 32 | -0.21 | 0.25 | 09 | -0.29 | 0.11 |
| Dibajnia (1991) | 68 | |||||
| 0.25 | 89 | |||||
| 0.14 | ||||||
| You (1999) | 66 | -0.12 | 0.70 | 92 | -0.05 | 0.10 |
| Equation 57 | 76 | |||||
| 0.25 | 96 | -0.05 | 0.11 | |||
Based on the Chan et al. (1972) study, the following expression is proposed:
| (57) |
where rw is the wave asymmetry coefficient (rw = uw,max/Uw -1, with uw,max being the maximum wave velocity). Excluding the effect of the wave asymmetry (rw = 0), Equation 57 may also be written similarly to the Chan et al. (1972) criterion:
| (58) |
Figure 17 shows a comparison between the observed critical wave orbital velocity Uw, cr, sf for the inception of sheet flow and its predicted value using Equation 57. Improved agreement with the data is observed compared to the previous formulas. The overestimation of most of the values from the Chan et al. (1972) data may be attributable to the experiment arrangement. Chan et al. (1972) argued that the lower values they observed for the inception of the sheet flow regime may be due to the onset of turbulence in the tube used in their experiment. Horikawa et al. (1982) pointed out the effect of the sediment particle shape: the two groups of measurements from Horikawa et al. (1982) that are underestimated (Uw,cr,sf,pred/Uw,cr,sf,meas < 0.7) as well as the two groups of measurements from Chan et al. (1972) that are overestimated (Uw,cr,sf,pred/Uw,cr,sf,meas > 2) correspond to cylindrical-shaped plastic particles and spherical glass particles, respectively. A structure made of cylinders may be more "resistant" than a structure made of spheres, and thus tends not to move as readily.
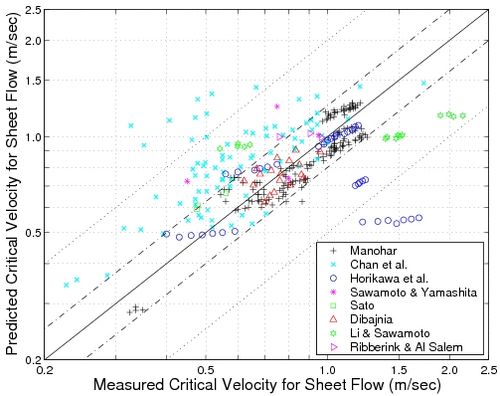
Figure 17. Comparison between observed critical wave orbital velocity '''Uw,cr''','''sf''','''meas 'for inception of sheet flow and predicted value '''Uw''','''cr''','''sf''','''pred 'using Equation 57.
| Chapter 1 - Introduction | Chapter 3 - Bed Load |
