GenCade:Internal Wave Transformation: Difference between revisions
No edit summary |
mNo edit summary |
||
| (2 intermediate revisions by one other user not shown) | |||
| Line 1: | Line 1: | ||
{{DISPLAYTITLE:GenCade Internal Wave Transformation}} | |||
Note: The [[GenCade:Wave Calculation|Wave Calculation]] page introduces the internal wave transformation topic within GenCade. | Note: The [[GenCade:Wave Calculation|Wave Calculation]] page introduces the internal wave transformation topic within GenCade. | ||
| Line 46: | Line 47: | ||
== Smoothed Nearshore Contour - ISMOOTH == | == Smoothed Nearshore Contour - ISMOOTH == | ||
A basic assumption in | A basic assumption in GenCade is that the bottom contours move parallel to the shoreline. If this assumption is applied directly in the internal wave model, unrealistic wave transformations can result in regions where the shoreline position changes abruptly, possibly leading to numerical instability. | ||
GenCade uses a smoothed bottom contour in performing the internal wave calculation, as illustrated in Figure 2. In this | To avoid possible instabilities in the solution, GenCade uses a smoothed bottom contour in performing the internal wave calculation, as illustrated in Figure 2. In this example, the shore-parallel contour changes radically at the tip of the groin. A smoothed contour is expected to better represent the bathymetry offshore of the groin. The degree of offshore contour smoothing is calculated as a running average using a window containing the number of cells as specified by the input parameter ISMOOTH. A larger value of ISMOOTH will result in an offshore contour that has less curvature. An ISMOOTH equal to 1 results in an offshore contour that is parallel to the shoreline (as the dash-dotted line in Figure 2). An ISMOOTH = ''N'', where ''N'' is the number of cells in the model, results in a straight contour line parallel to the x-axis. ISMOOTH must always be a positive, odd number. If an even number is entered for ISMOOTH, the model automatically resets the value of ISMOOTH to equal ISMOOTH-1 (and therefore an odd number). If a negative value is entered for ISMOOTH, the model automatically resets the value of ISMOOTH to equal 1. | ||
At the lateral boundaries (i.e., X=1 and X=N), the moving average calculates | At the lateral boundaries (i.e., ''X'' = 1 and ''X'' = ''N''), the moving average calculates the window size as: [(ISMOOTH -1)/2] by interpolation from the boundary value to the first smoothed value. The calculated contour is assumed to be representative for all contour lines between the input wave depth and the undiffracted wave breaking depth. The shape of the representative offshore contour is recalculated continuously using the shoreline position at that time. It is recommended that the user vary the ISMOOTH value to obtain a more realistic shoreline evolution. Too small of a value often leads to large angles between the waves and the shoreline which may produce unrealistic transport directions. | ||
[[File:SmoothedOffshoreBottomContour.png|500px|thumb|center|Figure 2. Example of smoothed offshore bottom contour]] | [[File:SmoothedOffshoreBottomContour.png|500px|thumb|center|Figure 2. Example of smoothed offshore bottom contour]] | ||
| Line 56: | Line 57: | ||
== Pre-Specified Regional Contour == | == Pre-Specified Regional Contour == | ||
In GenCade, all waves are transformed with respect to the bottom contour orientation, upon which the incoming waves are refracted. This bottom contour orientation (i.e., the offshore contour) is calculated as a smoothed rendering of the shoreline orientation using ISMOOTH as discussed | In GenCade, all waves are transformed with respect to the bottom contour orientation, upon which the incoming waves are refracted. This bottom contour orientation (i.e., the offshore contour) is calculated as a smoothed rendering of the shoreline orientation using ISMOOTH as discussed above. This is to ensure that the incident breaking waves are realistically described while preserving some feedback from the shoreline change to the transformation of the waves (Kraus and Harikai 1983). However, this methodology has two limitations: | ||
# dominant local or regional bathymetric features are not well represented, and | # dominant local or regional bathymetric features are not well represented, and | ||
Latest revision as of 14:57, 6 March 2023
Note: The Wave Calculation page introduces the internal wave transformation topic within GenCade.
Breaking Waves
Wave transformation from the deep water reference depth or the nearshore reference line (depending on whether or not the external wave model is used) is initially conducted without accounting for diffraction from structures located in the model domain. The solution strategy is to obtain a first approximation of breaking wave conditions without including diffraction and then modify the result by accounting for changes to the wave field by each diffraction source.
Omitting wave diffraction, there are three unknowns in the breaking wave calculation: the wave height, angle, and the depth at breaking. Three equations are needed to obtain these quantities: the equation for the breaking wave height based on reference wave data, a depth-limited breaking criterion, and a wave refraction equation (Snell’s law).
The height at breaking is calculated as:
where is the breaking wave height, is the refraction coefficient, is the shoaling coefficient, and is the wave height at the offshore reference depth or the nearshore reference line depending on which wave model is used. Both and are calculated in the classical way:
and
where is the initial angle of the wave ray and is the angle upon arrival at , the location of the breaking depth, and and are the group velocities at their respective depths (meters/second).
The equation for depth-limited wave breaking is given by:
where is 0.78. If diffraction is neglected, the undiffracted wave characteristics are used as input to the sediment transport relation (see Sand Transport Rates). If diffraction is included, then breaking wave heights and directions are recalculated as described next.
Breaking Waves Affected by Structures
Structures such as detached breakwaters, jetties, and groins which extend well seaward of the surf zone intercept the incident waves prior to breaking. Headlands and islands (specified as structures in GenCade) may also intercept waves before breaking. In the following discussion, all such objects are referred to as structures. The tip of a structure generally produces a near-circular wave pattern. This distortion of the wave field is a significant factor in controlling the sediment transport and associated shoreline position in the lee of the structure. Accurate and efficient calculation of waves transforming under combined diffraction, refraction, and shoaling is required to obtain realistic predictions of shoreline change in such situations.
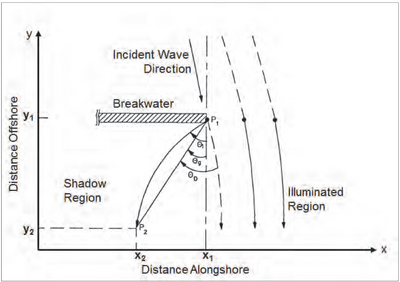
Figure 1 is a definition sketch of the calculation procedure for the breaking wave height and angle behind a structure (Kraus 1981, 1982, 1984). Conceptually, the area of interest is separated into a shadow region and an illuminated region by a wave ray directed toward the beach from the tip of the structure at the same angle as the incident waves arriving at the tip. To determine the breaking wave height, a diffraction coefficient must be calculated in both regions because the diffraction effect can extend far into the illuminated region. To determine the breaking wave angle inside the shadow region, wave rays are assumed to proceed radially from the tip of the structure at an angle to arrive at some point with an angle , where they break.

The angle at which a wave ray must start to arrive at inside the shadow region is not known apriori since it is a function of the breaking criterion as well as the distance alongshore. A ray shooting technique can be used to determine (Kraus 1982, 1984), but this procedure is computationally expensive and requires considerable execution time. As a first approximation, the geometric angle defined by the straight line between and is used.
Due to diffraction the wave height is reduced and, thus, the point of breaking changes. An iterative procedure is used to find the location of the breaking point, which has been transformed by diffraction, refraction, and shoaling. At breaking, the wave fulfills the two conditions:
and
where is a diffraction coefficient, is the angle between the incident wave ray at and a straight line between and . If is in the shadow region, is the breaking wave height at the same cell without diffraction.
For waves that are inside two overlapping shadow zones, an average is calculated together with a composite coefficient for the two diffracting systems. The same iteration procedure as for a single diffraction system is used. In the illuminated region of a composite system the undiffracted wave direction is used.
Because GenCade was developed to simulate waves and shoreline change in the field, the procedure of Goda et al. (1978) (see also, Goda (1984)) was adapted. Details of application of the method to calculate wave breaking produced by combined diffraction, refraction, and shoaling as used in GenCade are given by Kraus (1981, 1982, 1984, 1988). For given wave conditions at the diffracting tip, the diffraction coefficient is only a function of . In GenCade, it is assumed that the method is valid for relatively short structures such as detached breakwaters.
Smoothed Nearshore Contour - ISMOOTH
A basic assumption in GenCade is that the bottom contours move parallel to the shoreline. If this assumption is applied directly in the internal wave model, unrealistic wave transformations can result in regions where the shoreline position changes abruptly, possibly leading to numerical instability.
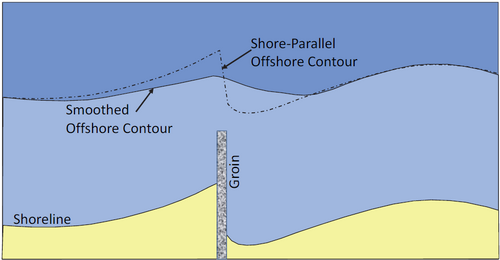
To avoid possible instabilities in the solution, GenCade uses a smoothed bottom contour in performing the internal wave calculation, as illustrated in Figure 2. In this example, the shore-parallel contour changes radically at the tip of the groin. A smoothed contour is expected to better represent the bathymetry offshore of the groin. The degree of offshore contour smoothing is calculated as a running average using a window containing the number of cells as specified by the input parameter ISMOOTH. A larger value of ISMOOTH will result in an offshore contour that has less curvature. An ISMOOTH equal to 1 results in an offshore contour that is parallel to the shoreline (as the dash-dotted line in Figure 2). An ISMOOTH = N, where N is the number of cells in the model, results in a straight contour line parallel to the x-axis. ISMOOTH must always be a positive, odd number. If an even number is entered for ISMOOTH, the model automatically resets the value of ISMOOTH to equal ISMOOTH-1 (and therefore an odd number). If a negative value is entered for ISMOOTH, the model automatically resets the value of ISMOOTH to equal 1.
At the lateral boundaries (i.e., X = 1 and X = N), the moving average calculates the window size as: [(ISMOOTH -1)/2] by interpolation from the boundary value to the first smoothed value. The calculated contour is assumed to be representative for all contour lines between the input wave depth and the undiffracted wave breaking depth. The shape of the representative offshore contour is recalculated continuously using the shoreline position at that time. It is recommended that the user vary the ISMOOTH value to obtain a more realistic shoreline evolution. Too small of a value often leads to large angles between the waves and the shoreline which may produce unrealistic transport directions.

Pre-Specified Regional Contour
In GenCade, all waves are transformed with respect to the bottom contour orientation, upon which the incoming waves are refracted. This bottom contour orientation (i.e., the offshore contour) is calculated as a smoothed rendering of the shoreline orientation using ISMOOTH as discussed above. This is to ensure that the incident breaking waves are realistically described while preserving some feedback from the shoreline change to the transformation of the waves (Kraus and Harikai 1983). However, this methodology has two limitations:
- dominant local or regional bathymetric features are not well represented, and
- an open coast without structures or sources or sinks of sediment will evolve to a straight line if the model is run for a sufficiently long duration.
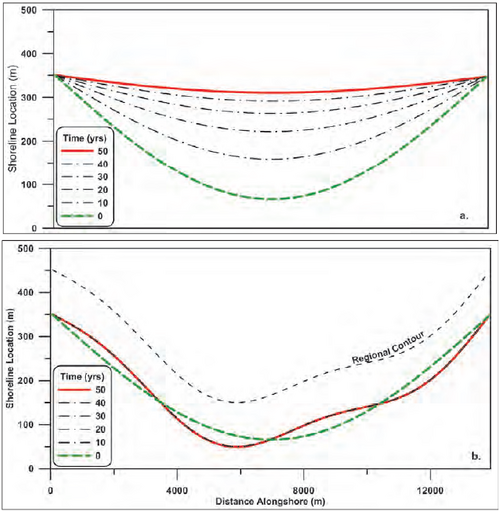
If a 2-D external wave model is employed to transform waves from the offshore, the GenCade internal transformation is still applied, but only from the depth of the 2-D external wave model output point to the breaking point. These limitations can be remedied by specifying a fixed representative regional contour (Larson et al. 2003) that is appended to the nearshore contour calculated based on ISMOOTH. Correctly specified, GenCade will maintain a desired overall shoreline curvature, e.g. preserving a bay shape without the presence of structures, even if the model is run for very long time periods. As a result, the shoreline will, on an open coast without structures, gradually evolve into the shape of the regional contour rather than into a straight line. Figure 3 illustrates the impact of the regional contour on the long-term evolution of a concave embayment with open lateral boundaries, but without any structures. Without the regional contour (Figure 3a) the embayment will gradually fill, and the shoreline will evolve into a straight line. However, with the regional contour (Figure 3b), the shoreline evolution will be guided by the contour. Gradually, the shoreline will become parallel to the regional contour rather than to a straight line.

Adding a regional contour represents a simplified method to describe the effects on the shoreline evolution of processes acting at longer time scales than what is simulated in GenCade (i.e., hundreds of years). At the time scales characteristic for GenCade simulations, the influence of these processes is included through the constraints controlling shoreline response provided by the regional contour. Thus, the regional contour should incorporate large-scale trends in shoreline shape, and not small scale features that are expected to change at time scales modeled by GenCade. Typically the regional contour is kept constant during a simulation, since changes in the contour shape would occur over time scales not described by GenCade.
Mathematically, adding the regional contour in the wave transformation and longshore sediment transport calculations has the same effect as introducing a small modification to the breaking wave angle alongshore that forces the shoreline to maintain the large-scale shape specified by the contour. Thus, the processes described by GenCade, for example, the influence of structures, inlets, sources, and sinks, produce shoreline changes as perturbations on the contour. It should be stressed that the alongshore spatial gradient in the regional contour is small and locally the curvature may not be easily discerned, but to achieve satisfactory modeling results it may be important to include the contour, if a straightening of the shoreline occurs that is not in agreement with observations.
It may not be an easy task to specify the shape of the regional contour. Typically a limited set of historic shorelines are available and only from recent times (e.g., within the latest hundred years). However, if there are shorelines available over a longer time period, they may provide a basis for deriving the shape of the regional contour. Several consecutively measured shorelines may indicate persistent large-scale spatial features that are suitable to describe through the regional contour. To extract those features, different types of techniques for filtering or pattern extraction could be employed, including moving-average methods and principal component analysis. A single shoreline may also be used to derive the regional contour, if something subsequently occurs that markedly disturbs the coastal system, for example an inlet or the introduction of an engineering structure or activity. In such cases, the measured shoreline, characterizing the undisturbed state, could be employed to determine the regional shoreline. Again, it is important to point out that the regional contour should reflect large-scale shapes that are results of processes acting at time scales longer than what is described in GenCade, and the contour should not be used to calibrate shoreline features that originate from processes within time scales simulated by GenCade.