GenCade:Structures: Difference between revisions
mNo edit summary |
mNo edit summary |
||
| Line 1: | Line 1: | ||
{{DISPLAYTITLE:Structures}} | {{DISPLAYTITLE:Gencade Structures}} | ||
== Types of Structures == | == Types of Structures == | ||
Latest revision as of 14:59, 6 March 2023
Types of Structures
GenCade simulates the effects of common coastal structures on the shoreline position. Generic types of structures that can be represented are groins, jetties, harbor breakwaters (with respect to their functioning as a jetty or groin), detached breakwaters, seawalls, and the “soft structure” or beach fill. Considerable flexibility is allowed in combining these basic structures to produce more complex configurations, e.g., T-shaped groins, Y-shaped and half-Y groins, and jetties with spurs. Combinations of these types of structures are also possible.
In shoreline change modeling, structures exert two direct effects:
- Structures that extend into the surf zone block a portion or all of the sand moving alongshore on their updrift sides and reduce the sand supply on their downdrift sides. These structures, referred to as ‘non- diffracting’ groins or jetties, only affect the sediment transport through direct blocking and have no effect on the waves.
- Groins/jetties with seaward ends extending well beyond the surf zone, referred to as ‘diffracting groins/jetties’, and detached breakwaters, produce wave diffraction. This causes the local wave height and direction to change, altering the longshore sand transport rate. In addition to this, the diffracting groins and jetties also block the sediment transport directly.
In reality, all groins and jetties are ‘diffracting’ to some degree. As diffracting structures require substantial computational effort, the user has been given the option to classify short groins and jetties as being ‘non- diffracting’, to save computational time. It is up to the user to determine for which groins and jetties wave diffraction may be ignored. Preferably, comparative simulations should be run, where short groins and jetties are represented as ‘diffracting’ and ‘non-diffracting’, respectively. Comparisons of simulation results may indicate the groins and jetties for which diffraction may be ignored. Only groins and jetties may be regarded as ‘non-diffracting’. Detached breakwaters are always regarded as diffracting as are groins and jetties that are combined with detached breakwaters or each other to form composite structures such as Y-groins.
Placement of groins, jetties,and detached breakwaters
This section describes capabilities and limitations in placing structures in GenCade. Idealized examples of plan views of various configurations are given for reference. It is noted that structures are represented as infinitesimally thin objects in the model. For example, a groin or jetty is located at the wall of a single cell and cannot occupy the position of more than one wall. In the figures below, structures are drawn thick for visibility only.
Three basic rules governing placement of groins, jetties, and detached breakwaters are:
- The position of a structure is defined by the location of its tip(s), and these positions are located at cell walls;
- There must be at least two cells between groins and jetties. As an important special case, a groin cannot be placed in the cell next to a lateral boundary;
- The locations of the tips of diffracting structures can coincide (be located at the same cell wall), but they cannot overlap.
Figures 1 and 2 give schematic examples of structure placements in GenCade. Structures that affect the waves (detached breakwaters and diffracting groins and jetties) are denoted as ‘diffracting structures’ and indicated by a ‘)))’ symbol in the figures.
Figure 1 gives examples of allowable Non- diffracting groins/jetties may be placed behind a diffracting breakwater (but diffracting groins/jetties cannot) (upper left sketch). The other three sketches in this figure show situations involving the tips of two structures sharing the same grid cell. The tip of a detached breakwater and a diffracting groin/jetty can be at the same longshore grid cell, as can the tips of two detached breakwaters. Two or three diffracting tips may be put together to form an angled structure such as a spur groin/jetty (lower right sketch), Y-groin, angled groin, etc. In such a case, the attaching points must be located in the same cell, at the same distance offshore, and having the same depth (see text below).
Figure 2 illustrates the major restrictions on placement of structures. Groins/jetties must be placed at least two grid cells apart (upper left sketch). This is not a serious limitation, since groins in the field are typically placed one to two groin lengths apart. A groin/jetty cannot be placed in the cell adjacent to a boundary cell, whether the boundary is gated by a groin/jetty or being an open beach (upper right sketch). Diffracting structures of any type cannot overlap (lower left and lower right) (except having their tips at the same cell wall; Figure 1).
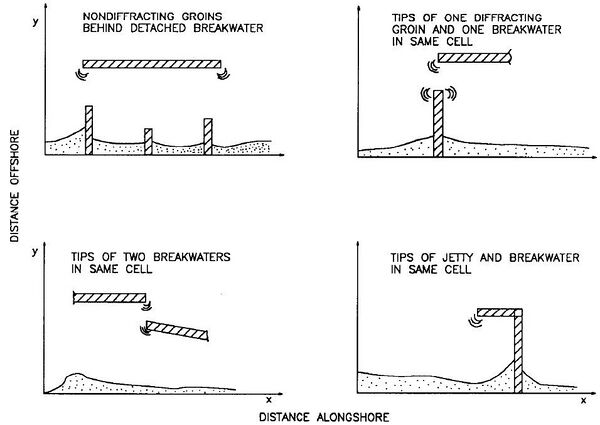
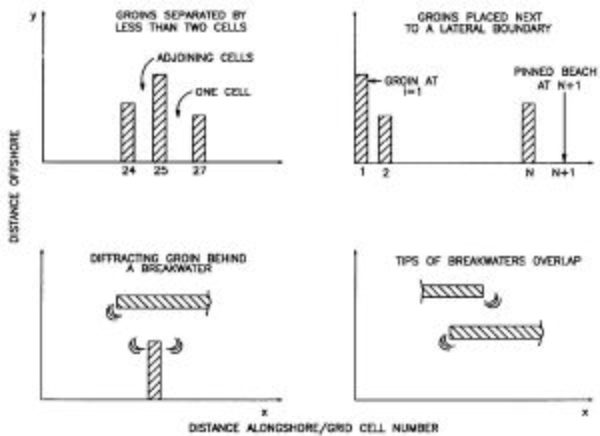
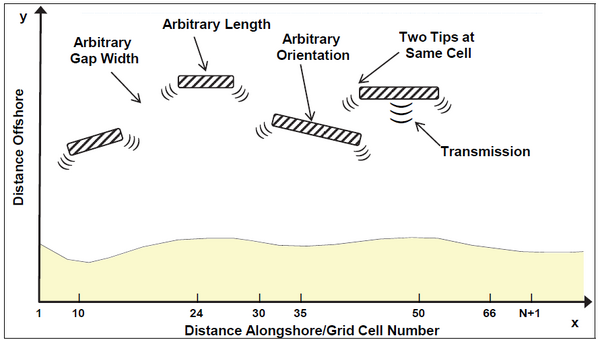
Figure 3 illustrates detached breakwater parameters that may be varied. Detached breakwaters are defined in the modeling system by specifying pairs of ends or tips of the structures. Wave transmission coefficients must also be given. As a summary, as long as detached breakwaters do not overlap (except for two tips sharing the same grid cell wall), the modeler is free to vary the length, transmission coefficient, orientation, distance offshore, and, in the case of segmented breakwaters, the gap width between structures.
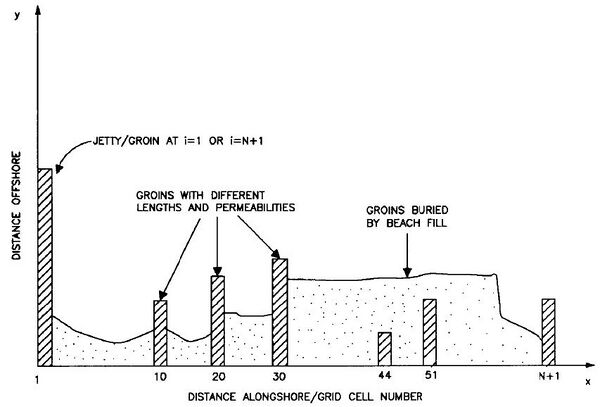
Figure 4 illustrates various representations of groins/jetties. Simple groins/jetties can have arbitrary lengths and are aligned parallel to the y- axis by GenCade; i.e., angled groins/jetties cannot be directly modeled. A groin/jetty cannot be flanked on its landward end; i.e., it cannot be isolated in the surf zone. However, groins/jetties can be covered by sand, as may occur during a beach fill, and will then be inactive. If uncovered by wave action, they will resume functioning.
Complex groin or jetty configurations, such as Y-groins, T-groins, and spur jetties, can be represented by placing tips of diffracting groins and detached breakwaters together. Figure 5 shows examples of complex structure configurations that may be represented, and Table 1 shows the corresponding values defining these configurations.
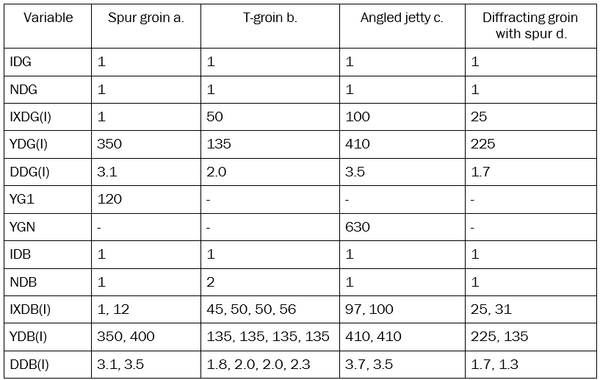
Several features in the examples in Figure 5 deserve attention:
- At locations where structures are attached, they must be located in the same cell, at the same distance offshore, and having the same depth. If not, GenCade will not recognize the structures as being connected;
- The top of the “T” forming a T-groin (such as in example c) must be represented by two structures, each attaching to the diffracting groin. Otherwise, the configuration would be illegal (overlap of diffracting structures) as shown in Figure 2;
- The connection between two attaching detached breakwaters must be at the exact same point in all specifications (as in example b).
- All groins/jetties attaching to detached breakwaters must be represented as diffracting.
Impact of Groins and Jetties
In GenCade, two types of sand movement past a groin or jetty are simulated. One type of movement is around the seaward end of the structure, called bypassing, and the other is through and over the structure, called transmission. Bypassing is assumed to take place if the water depth at the tip of the structure DG is less than the depth of active longshore transport DLT (see Empirical Parameters). Since the shape of the bottom profile is known (see Empirical Parameters), DG is determined from knowledge of the distance between the tip of the structure and the location of the shoreline. However, because groins/jetties are located at grid cell walls between two calculated shoreline positions, this depth is not unique. In GenCade, the updrift depth is used. To represent sand bypassing, a bypassing factor BYP is introduced and defined as:
which is calculated at each time step.
Analogously, a permeability factor PERM is introduced to describe sand transmission over, through, and landward of a shore-connected structure such as a groin. A high (in relation to the mean water level), structurally tight groin that extends far landward so as to prevent landward sand bypassing is assigned PERM = 0, whereas a completely “transparent” structure is assigned the value PERM = 1. Values of PERM thus lie in the range of and must be specified through judgment of the modeler based upon, for example, the structural characteristics of the groin (jetty, breakwater), its elevation, the tidal range at the site, or an on- site inspection of the structure. Aerial photographs are often helpful in estimating a structure’s amount of void space (hence PERM) in relation to other structures on the model grid. The optimal value of PERM for each structure must then be determined in the process of model calibration.
With the values of BYP and PERM determined, GenCade calculates the total fraction F of sand passing over, around, or through a shore- connected structure as (Hanson 1987):
This fraction is calculated at every time step for each shore connected (groin-type) structure defined along the model grid.
Impact of Detached Breakwaters
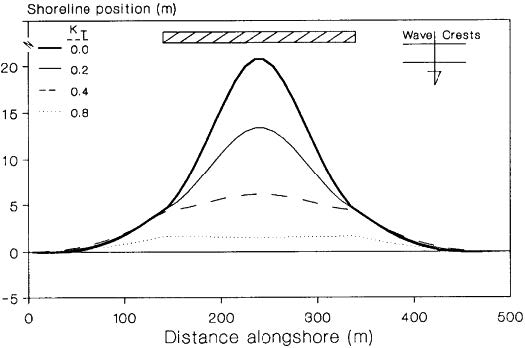
The response of the shoreline to placement of a detached breakwater (DBW) must be considered in the design process. The transmission coefficient is a leading parameter in controlling beach response to DBWs (Hanson and Kraus 1990). GENESIS (Hanson and Kraus 1989) was applied to model shoreline change both in the field and in movable-bed physical model experiments based on its capability of representing combined wave diffraction, refraction, and transmission at multiple DBWs (e.g., Hanson and Kraus 1989, 1990, 1991a, 1991b; Hanson et al. 1989; Rosati et al. 1992; Gravens and Rosati 1994; Herbich et al. 1996). Initially, the GENESIS model only represented a constant transmission coefficient () for DBWs. To describe wave transmission in the modeling system, a value of a transmission coefficient was provided for each DBW as an input parameter. The transmission coefficient, defined as the ratio of the height of the incident waves directly shoreward of the breakwater to the height directly seaward of the breakwater, has the range , for which a value of 0 implies no transmission and 1 implies complete transmission. Figure 6 shows the result of simulations with GenCade for a single DBW for different values of the wave transmission coefficient , which has the range of 0 to 1. As expected, greater wave transmission results in a smaller salient or seaward growth of the shoreline.
Later, it was found desirable to have the capability of predicting shoreline response to DBWs for a wide range of engineering conditions. To improve the predictive capability, several published empirical formulas for the wave transmission coefficient were evaluated (Wamsley and Hanson 2002; Wamsley et al. 2002, 2003). Sensitivity tests were performed to determine the most suitable predictive formula for a given structure configuration and properties, water level, and wave condition. In GenCade, the user may choose either a constant value of for each structure or allow the model to calculate appropriate values based on time-varying water level and wave height, and structure characteristics. If the variable option is selected, water level is read from an input file at a specified input time interval. For each structure, the user specifies geometric properties (crest height and width, slopes on seaward and landward sides, and median rock size) and can select between the calculation methods of Ahrens (2001), Seabrook and Hall (1998), and d'Angremond et al. (1996). The method selected should be based upon structure type and configuration.
The Seabrook and Hall formula appears to best capture transmission processes associated with submerged structures (Wamsley and Hanson 2002; Wamsley et al. 2002, 2003). Their work (Seabrook and Hall 1998) specifically concerned submerged structures and should not be transferred to surface-piercing structures. The d'Angremond et al. (1996) equation can be applied to rubble mounds and solid structures, and it appears to work well for structures with relative submergence between about -0.75 and 0.5. For deeply submerged and relatively high structures, the d’Angremond formulation is not recommended. Both the Seabrook and Hall and d’Angremond formulations were developed primarily with conventional structure data and, therefore, care should be taken in applying them to reef structures. The most promising work from a general predictive equation prospective appears to be the Ahrens (2001) dominant-mode approach. The Ahrens equation was the only one to render an S-curve in plotting Kt versus R/Ho (in agreement with laboratory data from Tanaka (1976)) and to give reasonable results for high structures. Also, the Ahrens equation does not impose applicability limits. The Ahrens equation, however, was developed based primarily upon reef breakwater data and may over-predict transmission for a conventional structure. Additionally, the Ahrens equation for submerged structures may not adequately account for the influence of relative crest width.
Figure 6 above showed the development of a salient inside a DBW. Under certain conditions the salient will continue to grow until it reaches the DBW and will then form a tombolo. The boundary condition for representing tombolo formation at T-head groins and DBWs is formulated analogously to that of a seawall in GENESIS as discussed in Hanson and Kraus (1986) and in Kraus and Hanson (1995). However, implementation of the tombolo constraint is more complex because it includes wave diffraction, blocking of previously open calculation cells, and transport of sediment on both the landward and the seaward sides of the structure. The tombolo concept implies that the beach can reach the structure, but no further. As a calculation cell makes contact with the structure, the transport rate into that cell is adjusted to allow the excess sediment to remain in updrift cells. The procedure to do this conserves sediment volume and preserves the direction of its transport.
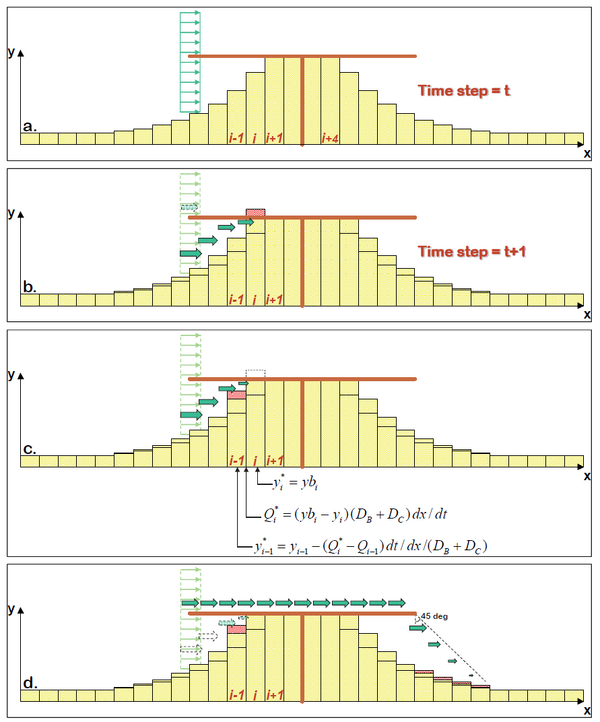
The procedure is illustrated in Figure 7, a plan view of an idealized beach protected by a T-head groin. As usual, a net influx (gain) into a cell produces beach accretion and a net out flux (loss) produces erosion. In this particular example a tombolo has developed in Cells i+1 though i+4 during previous time steps.
At the updrift (left-hand) structure tip, a portion of the longshore transport will take place inside the tip and the rest will pass on the outside (Figure 7a). The routine to calculate this is identical to the one applied at regular, straight groins. The sand on the inside of the shore-parallel structure will be transported behind the structure by the diffracted waves (Figure 7b). In this case, this transport would cause the shoreline to move beyond the structure in Cell i. As this is not possible, the initially calculated transport into Cell i will have to be adjusted to a value (Figure 7c) that will cause the shoreline to advance up to the DBW but no further, resulting in , where is the structure location in Cell i. With the new transport now leaving Cell i-1, the shoreline location in this cell will be adjusted from to . In this particular case, because did not exceed , only two cells had to be recalculated. In a general situation, the correction may be carried through any number of cells until the criterion that the shoreline cannot advance beyond the structure is satisfied in all cells. The adjustment is made to preserve sediment volume and direction of sediment transport.
The portion of the longshore transport that passes outside of the structure tip at the updrift side will be transferred to the other end of the structure (Figure 7d) and released to the cells closest to the structure on the down-drift side. In this process, the sediment is assumed to be distributed over a distance equal to the distance from the down-drift tip to the shoreline.
Seawalls
Effective sections of seawalls may be defined anywhere on the grid. It is noted that the seawall does not need to be straight but may form a “curve” to follow the trend of the beach contours. The seawall may be placed at the shoreline or behind it. However, a seawall cannot be placed seaward of the shoreline.
A seawall or, in general, any shore-parallel non-erodible barrier such as a rocky cliff, imposes a constraint on the position of the shoreline because the shoreline cannot move landward of the wall. Hanson and Kraus (1985, 1986) developed a procedure for calculating the position of the shoreline constrained by a seawall. The procedure is consistent with shoreline response modeling theory and has the following three properties:
- The shoreline in front of a seawall cannot recede landward of the wall;
- Sand volume is conserved;
- The direction of longshore sand transport at the wall is the same as that of the potential local transport.
GenCade first calculates longshore sand transport rates along the beach based on the assumption that the calculated amount of sand is available for transport (the potential transport rate). At grid cells where the seawall constraint is violated, the shoreline position and the transport rate are adjusted in a way similar to the breakwater routine described above. The quantities in neighboring cells are also adjusted, as necessary, to preserve sand volume and the direction of transport. The calculation procedure is complex, and the reader is referred to Hanson and Kraus (1986) for full details. Flanking of the seawall is not possible since it would lead to a double-valued shoreline position at the same grid cell. As opposed to groins, jetties, and detached breakwaters that are placed at cell walls, seawalls are placed at cell centers. The reason is that seawalls do not affect the waves, located at cell walls, but only the shoreline location, defined at cell centers. In the schematic example shown in Figure 8, the seawall would extend from cell 23 to cell 34.
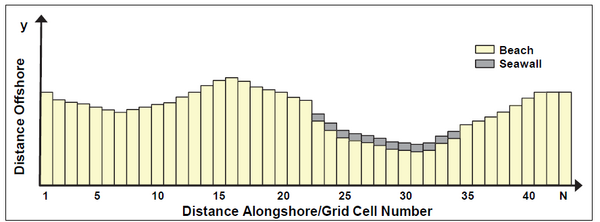
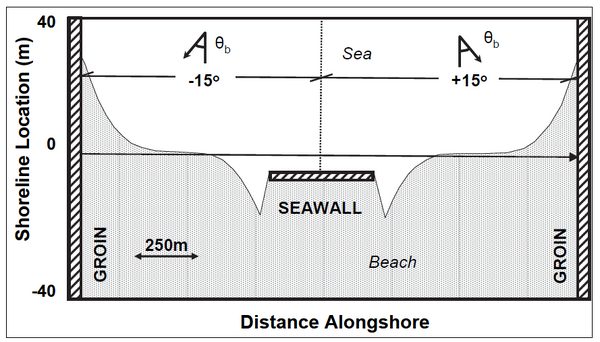
Figure 9 demonstrates a hypothetical case where a divergence point of sand transport is located half-way between two groins. A seawall is initially located a small distance landward of the shoreline at this location. As a result of the divergence, the beach initially erodes, gradually exposing the seawall. As the shoreline reaches the seawall, it cannot recede further. Thus, the potential erosion of an exposed cell is transferred to the adjacent cell in the direction of transport, i.e., away from the divergence point. If the entire seawall is exposed, erosion occurs in the cells just adjacent to the structure on either side. The example shows that the constraint provides realistic shoreline evolution in front of as well as adjacent to a seawall.
Beach Fills
Beach fills may be placed anywhere on the beach and can overlap in time and position. The beach is advanced an equal amount daily at each cell where a given fill has been defined. Beach fills can cover groins, and, if the beach erodes, the groins will become uncovered and begin functioning.
GenCade is capable of representing the behavior of fills under the following assumptions:
- The fill has the same median grain size as the native sand;
- The profile of the fill represented in the model has the equilibrium shape corresponding to its grain size;
- The berm height of the nourished beach is the same as the natural beach.
The second point means that the beach fill width that is specified as input to the model is NOT the width corresponding to the fill template but the width that is expected to develop as the filled beach has been equilibrated by waves and currents.
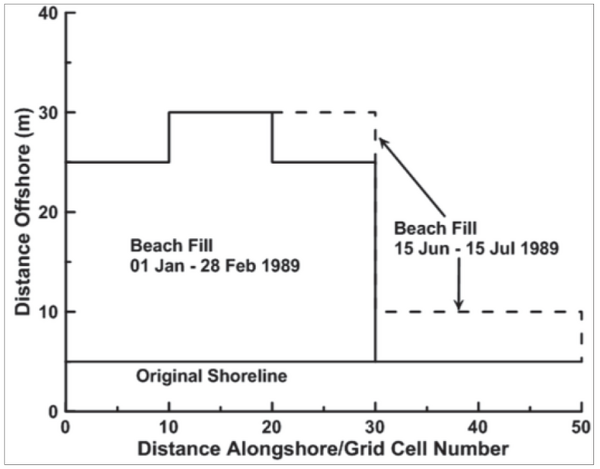
Figure 10 illustrates a simple, schematic beach fill. In GenCade, this fill would need to be represented by a number of individual fills, each with a constant width alongshore. Thus, the beach fill would be represented by three fills: one covering cells 1 through 30, with a width of 20 m, starting on 01 Jan 89 and ending on 28 Feb 89; a second fill covering cells 10 through 20, with a width of 5 m, starting on 01 Jan 89 and ending on 28 Feb 89; a third covering cells 20 through 60, with a width of 5 m, starting on 15 Jun 89 and ending on 15 Jul 89.
