TR-08-13:Chapter3
CMS-Wave Interface
Demirbilek et al. (2007) described the computer graphical interface in the SMS (Zundel 2006) for CMS-Wave applications. A summary of key features of the interface is provided in this chapter to familiarize users with guidelines for the interface usage and implementation of CMS-Wave. The SMS is a graphically interactive computer program designed to facilitate the operation of numerical models and creates input files and output visualization for CMS-Wave. The CMS-Wave interface in the SMS is similar to that of the half-plane model of STWAVE Version 5.4 (Smith 2001b). The SMS can generate CMS grids with variable rectangle cells and half-plane STWAVE grids with constant square cells. Both wave models can use the same grid domain with identical grid orientation and layout, and the same file formats for their bathymetric and spectral energy files. This was done to facilitate the usage of CMS-Wave and allow users to utilize the same settings and files to run both models without modifications.
CMS-Wave files
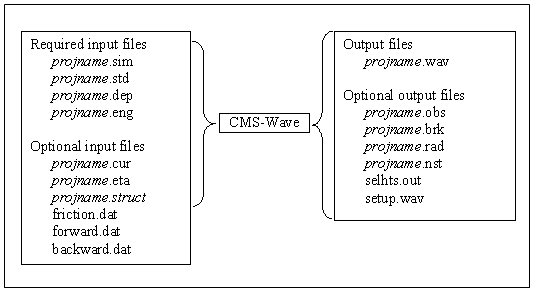
Four input files are required for a CMS-Wave simulation (Figure 1): the simulation file (*.sim), the model parameters file (*.std), the depth file (*.dep), and the input directional spectrum file (*.eng). Optional input files include a current field file (*.cur), a water level field file (*.eta), a friction coefficient field (friction.dat), a forward reflection coefficient field (forward.dat), a backward reflection coefficient field (backward.dat), and a structure file (*.struct). The name of the simulation file can be passed to CMS-Wave as a command line argument, or the program will prompt the user for this file. The model can be launched in the SMS or at a DOS prompt by specifying the name of the simulation file (*.sim).
Depending on which options are selected in the *.std file, CMS-Wave may generate one to six output files. A wave field conditions file (*.wav) is always generated. Optional output files are calculated spectra (*.obs) and wave parameters with the maximum water level (selhts.out) at selected cells, wave breaking indices (*.brk), wave radiation stress gradients (*.rad), wave setup and maximum water level field (setup.wav), and nesting spectral data (*.nst). Figure 1 shows a chart of input and output files involved in a CMS-Wave simulation. Table 1 presents a list of the type and use of all I/O files, where "projname" is a prefix given by users.
The simulation file (*.sim) stores the coordinates of the origin and orientation of the computational grid, and a list of names of all files used in the simulation. All input and output files, required and optional, are listed in Figure 1 and is described in Table 1. Abbreviated output from sample files was provided in Technical Note ERDC/CHL CHETN-I-74 (Demirbilek et al. 2007) and presented in Appendix A to familiarize users with these files.
Users can run CMS-Wave with the input files of STWAVE Version 5.4 without making changes. In this case, CMS-Wave runs in a basic mode. Although doing this may be useful in some project applications, the basic mode does not take advantage of certain features of CMS-Wave, such as reflection. Users should run CMS-Wave with its special set of parameters as defined in the *.std file. That is, one can edit *.std, without modifying *.sim and *.dep, to add a few additional parameters that are specific to CMS-Wave. Guidance on various parameters and recommended values is given below.
| File Name | Type | Description |
| projname.sim | Input - required | Filenames for input/out of a simulation. |
| projname.std | Input - required | Model parameters and output options. |
| projname.dep | Input - required | Elevation value at each cell. |
| projname.eng | Input - required | Input energy spectra - this includes one spectra for each open boundary for each wave case. Wave spectra may be repeated. |
| projname.cur | Input - optional | Current value at each cell (components in u,v directions). |
| Projname.eta | Input - optional | Water level value at each cell. |
| Projname.struct | Input - optional | Selected structure or feature cells for special calculations including wave transmission, overtopping, and runup. |
| projname.wav | Output - always | Wave height, period, and direction for each cell. |
| projname.obs | Output - optional | Transformed energy spectra at selected cells. |
| projname.brk | Output - optional | Breaking flag or energy dissipated at each cell due to breaking depending on breaking option. |
| projname.rad | Output - optional | Radiation stress gradients (in u,v directions) at each cell. |
| projname.nst | Output - optional | Transformed wave spectra at selected cells |
| selhts.out | Output - optional | Wave parameters at selected cells. |
| Setup.wav | Output - optional | Wave setup and maximum water level field including wave runup. |
Users can provide up to 15 control parameters in the *.std. They are (in sequential orders) iprp, icur, ibrk, irs, kout, ibnd, iwet, ibf, iark, iarkr, akap, bf, ark, arkr, iwvbk, which represent:
- iprp
- = 0, for wave generation and propagation (use wind input if provided)
- = 1, for propagation only (neglect wind input)
- = -1, for fast-mode simulation (for wave generation and propagation)
- icur
- = 0, no current
- = 1, with current input (*.cur), using data sets in the sequential order
- = 2, with current input (*.cur), using only the first set current data
- ibrk
- = 0 (no *.brk file)
- = 1, for output of wave breaking indices (*.brk)
- = 2, for output of energy dissipation fluxes (*.brk)
- irs
- = 0 (no *.rad file)
- = 1, for output of wave radiation stresses (*.rad)
- = 2, for output of wave radiation stresses (*.rad) and wave setup/maximum water level (setup.wav)
- kout
- = 0 (no *.obs and selhts.out files)
- = n, for output of spectra (*.obs) and parameters (selhts.out) at n selected cells
- ibnd
- = 0 (no *.nst file)
- = 1, for nested grid, with linear interpolation of boundary input spectra (*.nst)
- = 2, for nested grid, with morphic interpolation of boundary input spectra (*.nst)
- iwet
- = 0, for normal wetting/drying (use water level input)
- = 1, no wetting/drying (neglect water level input)
- ibf
- = 0, no bottom friction
- = 1, for bottom friction with constant Darcy-Weisbach type coefficient (= bf)
- = 2, for bottom friction with variable Darcy-Weisbach type coefficient (friction.dat)
- = 3, for bottom friction with constant Manning coefficient (= bf)
- = 4, for bottom friction with variable Manning coefficient (friction.dat)
- iark
- = 0, no forward reflection
- = 1, with forward reflection
- iarkr
- = 0, no backward reflection
- = 1, for backward reflection
- akap
- = diffraction intensity factor (0 for no diffraction, 4 for strong diffraction)
- bf
- = constant bottom friction coefficient
- ark
- = constant forward reflection coefficient (0 for no reflection, 1 for maximum forward reflection)
- arkr
- = constant backward reflection coefficient (0 for no reflection, 1 for maximum backward reflection)
- iwvbk (option for selection of wave breaking formula)
- = 0, for Extended Goda (Sakai et al. 1989)
- = 1, for Extended Miche (Battjes 1972; Mase et al. 2005b)
- = 2, for formula by Battjes and Janssen (1978)
- = 3, for formula by Chawla and Kirby (2002)
Users can assign 0 for 15 control parameters in CMS-Wave to run in the basic mode. If only the first six parameters, iprp, icur, ibrk, irs, kout, and ibnd, are provided (minimum requirement) in *.std, a zero will be assigned to the remaining parameters, except that a default value of 1.0 is assigned to the diffraction intensity factor (akap = 1.0) to simulate a weak diffraction condition. If only the first ten parameters, iprp, icur, ibrk, irs, kout, ibnd, iwet, ibf, iark, and iarkr, are provided in *.std (no other information provided for the bottom friction and reflection coefficients), default values of bf = 0.0, ark = 0.5 (for 50 percent energy forward reflection), arkr = 0.3 (for 30 percent backward energy reflection), and akap = 1.0 are used by the model.
CMS-Wave calculates wave transmission, wave runup, and overtopping as special features on selected cells. These cells can represent a floating breakwater, a bottom mound breakwater, a beach segment and the land adjacent to it, jetties, seawalls, or underwater features such as reefs or submerged structures. A trench, submerged mound, or structure can be added to the bed as features without modifying the input depth file. These feature cells need to be specified in the *.struct file. Each feature cell is described by four parameters, istruc, jstruc, kstruc, and cstruc in a line format in the *.struct.
- istruc (i-th column in the grid)
- jstruc (j-th row in the grid)
- kstruc (feature cell identity)
- = 1, for adding alternative feature or structure (immersed or exposed) without modifying the input depth
- = 2, for calculation of wave runup and overwash on beach face or structure, and adjacent land
- = 3, for calculation of transmitted waves of a floating breakwater
- = 4, for a vertical wall breakwater
- = 5, for a composite or rubble-mound breakwater
- cstruc (feature cell property/value)
- = structure depth, for kstruc = 1 (assume a land cell if not provided)
- = beach/structure elevation above mean water level, for kstruc = 2 (use the input depth if not provided; no effect for cstruc < 0)
- = floating breakwater draft, for kstruc =3 (skip if not provided or cstruc < 0.05 m)
- = breakwater/structure elevation, for kstruc = 4 or 5 (use the input depth if not provided; immersed if cstruc < 0)
Components of CMS-Wave interface
The interface for CMS-Wave is designed for the half-plane, i.e., 180-deg sector where waves propagate from offshore toward the shoreline. Similar to other finite-difference models available in the SMS, CMS-Wave is controlled through the 2D Cartesian Grid Module
![]() . The user should select the Set Current Model command in the Edit menu and choose CMS-Wave to activate the model interface. After CMS-Wave is selected as the active model, its menu and tools become available. It is recommended that users become familiar with other modules of the SMS to fully exploit the complete utility of the interface. For example, the CMS-Wave grid can also be generated in the Map Module
. The user should select the Set Current Model command in the Edit menu and choose CMS-Wave to activate the model interface. After CMS-Wave is selected as the active model, its menu and tools become available. It is recommended that users become familiar with other modules of the SMS to fully exploit the complete utility of the interface. For example, the CMS-Wave grid can also be generated in the Map Module
![]() under the CMS-Wave coverage. Likewise, users can select the Scatter Module
under the CMS-Wave coverage. Likewise, users can select the Scatter Module ![]() to import survey data and digital maps to define the bathymetry for the model’s grids.
to import survey data and digital maps to define the bathymetry for the model’s grids.
CMS-Wave Menu
The CMS-Wave menu (Figure 2) commands are listed in Table 2, together with a description of each command.
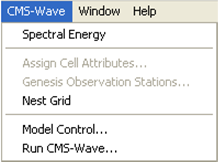
Figure 2. CMS-Wave menu.
Table 2. CMS-Wave Menu Commands.
| Command | Functionality. |
| Spectral Energy | Brings up the spectral energy dialog to define/view wave energy spectra do be used in this simulation. Spectral generation is described in its own section below. |
| Assign Cell Attributes | This command is used to assign cell attributes. A cell can be a typical ocean cell, a special ocean cell (spectral output computed at these), a typical land cell, or a structural cell. It is only available when one or more cells are selected. |
| Genesis Observation Stations | This command is for future capabilities currently under development. |
| Nest Grid | This command is for future capabilities currently under development. |
| Model Control | Brings up the Model Control dialog to specify model parameters. |
| Run CMS-Wave | Launches CMS-Wave with the currently loaded simulation. As the model runs, a dialog monitors progress of the model and gives the user status messages. When the run is complete, the spatial solutions are read in for analysis and visualization. |
CMS-Wave Tools
The most frequently applied CMS-Wave tools in the SMS are listed in Table 3, together with their icon and functionality. Only one tool can be selected (active) at a time. The active tool may be a model-specific tool such as those listed in the table, or it may be a general tool such as Pan, Zoom, or Rotate. The active tool controls which response the program will make if the user clicks or drags the mouse through the graphics window. Typically, there are two types of tools, those that are designed to select entities and those that are designed to create entities. In the CMS-Wave interface, the user can create a grid and may want to select certain cells. Multiple grid entities can be selected using the tools for selecting columns or rows by dragging a box or polygon around more that one entity, or by holding down the SHIFT key while sequentially clicking on entities.
Table 3. CMS-Wave Tools.
Creating a grid
The process for creating a CMS-Wave grid consists of four steps:
- Read in bathymetric data. These data can originate from one or more surveys, or from a previous numerical model simulation. Data should be brought into the SMS as a scattered data set or a digital elevation map (DEM). The most common formats are described as an *.xyz or *.pts file in SMS documentation. Data for coastlines and structures in the modeling domain could either be included in the bathymetry (recommended) or brought into the SMS separately and merged with the bathymetry data inside the SMS.
- Select CMS-Wave as working model. In the Cartesian Grid Module
 , under Data menu, find the Switch Current Model submenu and select CMS-Wave as the working model.
- Define modeling domain. Zoom into the area around the computational domain and select the Create Grid tool
 . To define the extent of the modeling domain, the user must click three times in the graphics window. The first click (Pt 1) is at the location where the lower left corner of the grid will lie. Then the user should move the cursor (a line will appear from the selected corner) to the location where the lower right corner of the grid will be and click again (Pt 2). Finally, the user must move the cursor to the location where the upper right corner of the grid will be and click again (Pt 3). Figure 3 shows a grid being defined. The first two clicks always define the "I" axis of the grid, which is the x-direction for wave propagation.
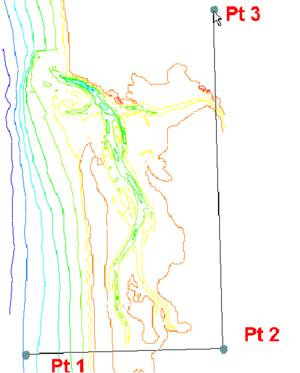
Figure 3. Creating a grid.
- Create a grid. After defining the three points, the Map->2D Grid dialog will appear (Figure 4). This dialog allows users to modify the size, orientation, position, and cell size for the grid that is being created. The grid position and orientation are initialized from the three points digitized in the previous step. If more exact locations are known, users would enter these in the top section of the dialog. In the center section, the individual cell size is entered. The previous SMS 9.2 interface for CMS-Wave supports only square cells. A variable rectangle-cell feature is supported in SMS10. By default, SMS creates a grid with 10 ´ 10 cells, but users can change these values as required by the application.
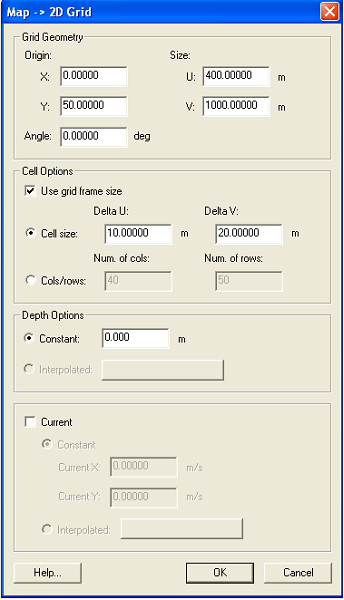
Figure 4. Map ->2D Grid Dialog.
In the lower section of this dialog, users tell the SMS to interpolate the bathymetry values for the grid from the data resident in the Scatter Module. If a scattered data set with a vector functional data set exists in the SMS at the time the grid is created, there is also an option to interpolate current data to the grid. Once this data set is entered, the user clicks the OK button, and a grid is created. Bathymetry values for each cell of the grid, along with values of the horizontal current, are interpolated from the scattered bathymetry data at the centroid of the cells. Grid cells with a negative depth value are classified as dry land and are excluded in the CMS-Wave calculations. After the grid is created, the user can select cells and modify depth values and cell classifications (type).
Editing a grid
Cell depths and attributes in the CMS-Wave grid may be edited, but the grid itself cannot be repositioned. To reposition or change the resolution of a grid, a new grid must be created. This is required if the domain needs to be enlarged or reduced, the grid cell size modified, or the grid orientation adjusted to align it better with the principal wave direction. Various other types of operation are permitted for editing CMS-Wave grid cells, including the following:
- Specification of individual cell elevation. Select one or more cells using the Select Cell tool
 , and specify a elevation value in the edit field located at the top of the application (just below the menus). This feature could be used, for example, to evaluate the response of waves to dredging operations by deepening parts of a navigation channel or to describe dredged material mounds in the modeling domain. This feature is useful if some changes to the underlying bathymetry are desired in a small part of the modeling domain where they can be made manually to a sub-area or selection of cells.
- Classification of cell as land, structure, water, or monitoring (special output) location. This is done by selecting one or more cells using the Select Cell tool
 and specifying the cell attributes using the Assign Cell Attributes command in the menu. This brings up the Cell Attributes dialog.
Monitoring Cells
The SMS interface for CMS-Wave allows for the monitoring of certain cells in the computational domain. To do this, users simply select the cells, as described above in the section on editing the grid, and assign the cell to be a monitoring station (Figure 5). For each monitoring station, CMS-Wave saves the entire (half-plane directional) spectrum in the *.obs output file.
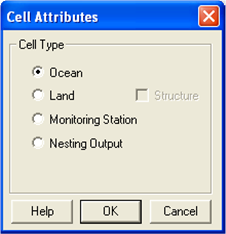
Figure 5. CMS-Wave Cell Attributes dialog.
Defining Spectra
Incident wave conditions for CMS-Wave consist of specifying an energy spectrum at the model’s open boundaries. This requires users to define an input wave spectrum for driving the model. The input spectrum (or spectra for multiple wave conditions) may be generated from an external source such as the National Data Buoy Center (http://www.ndbc.noaa.gov/) or the Coastal Data Information Program (http://cdip.ucsd.edu/) buoys and read in from an energy *.eng file, or created using the spectral energy command in the CMS-Wave menu. This brings up the dialog shown in Figure 6.
In generating the wave spectrum, users first create a spectral grid. The Create Grid button allows users to specify the number, distribution of frequencies, and the directional bin size. As default, the model uses 5‑deg directional bins distributed over a half plane (Figure 6). Once the spectral grid is created, users can press the Generate Spectra button to generate spectra from user-specified spectral wave parameters. The types of parametric wave spectral forms supported are shown in Table 4. Parameters used to generate different wave spectrum types are stored in a tabular text file (*.txt) with the simulation for later reference. The Spectral Energy dialog allows the user to view the spectra in polar or rectilinear coordinates. It also allows the modeler to rotate the spectrum to view it in three dimensions. In the lower section, users can select either or both integrated frequency and directional plots of a generated spectrum.
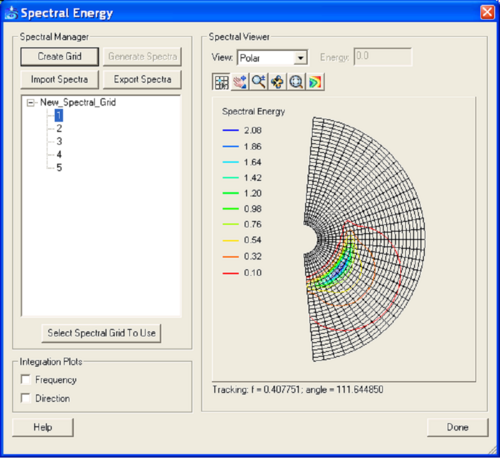
Figure 6. Spectral energy dialog for spectra visualization and generation.
Model Control parameters
The Model Control command in the CMS-Wave menu can bring up the Model Control Dialog shown in Figure 7. This dialog displays the grid dimension and size at the top and model settings in the bottom. Because CMS-Wave runs in the metric system (m, m/sec), setting the Current Coordinates under the Edit menu to use ’Meter’ units (default in SMS10) for both vertical and horizontal coordinates is required.
Table 4. Spectral parameters.
| Method | Required Parameters |
| TMA Spectrum (Shallow Water) | Significant Wave Height (Hs) Peak Wave Period (Tp) Gamma Wave Mean Direction Directional Spreading (nn) |
| JONSWAP Spectrum | Hs and Tp or Wind Speed and Fetch Distance Gamma Wave Mean Direction Directional Spreading (nn) |
| Bretschneider (ITTC) Spectrum | Significant Wave Height (Hs) Peak Wave Period (Tp) Wave Mean Direction Directional Spreading (nn) |
| Pierson-Moskowitz Spectrum | Wind Speed or Hs or Tp Minimum Wave Period (Tmin) Wave Mean Direction Directional Spreading (nn) |
| Ochi-Hubble Double Peak Spectrum | Hs for the low frequency Hs for the high frequency Tp for the low frequency Tp for the high frequency Gamma for the low frequency Gamma for the high frequency Wave Mean Direction for low frequency Wave Mean Direction for high frequency nn for low frequency nn for high frequency |
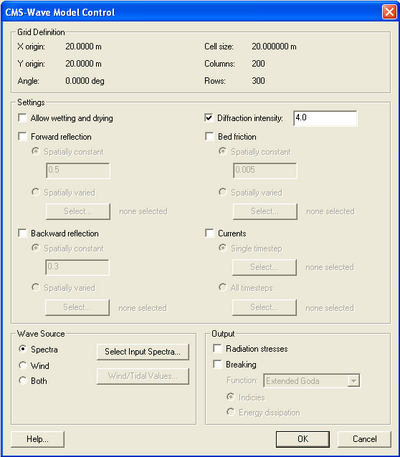
Figure 7. CMS-Wave Model Control dialog.
- Model settings. This section describes the model control dialog for various model settings and computational options. If none of options is selected, the model is run in the basic mode (no wetting and drying allowed, no wave-current interaction calculation even with the current input file provided, no reflection, diffraction, and bottom friction calculations). If the option for diffraction is checked, a default value of 4 for the diffraction intensity factor, k, as shown in Equation 1 is provided. Users can change the default value for different diffraction intensity. The range of the diffraction intensity value is 0 to 4 (4 for strong diffraction). For reflection, a default value of 0.5 (50-percent reflection) is provided for forward reflection, and 0.3 (30-percent reflection) for backward reflection, if both options are toggled. Users can change values of global reflection coefficients for all structures and shorelines. Users can also provide spatially varied reflection coefficient values for different structures/shoreline segments using input files of forward.dat and backward.dat (with the same format as *.dep).
Checking the bottom friction option provides a default bottom friction coefficient of 0.0 for the entire grid. Users can specify a different value for the bottom friction coefficient (0 to 1.0) or provide a file for spatially varying bottom friction coefficients. The filename is friction.dat, and the file format is the same as *.dep.
- Wave source. CMS-Wave allows consideration of multiple wind and wave inputs in a model simulation. By selecting the Select Input Spectra button, a dialog (Figure 8) appears, displaying all the currently loaded spectra, from which users choose which spectra to consider in the simulation.
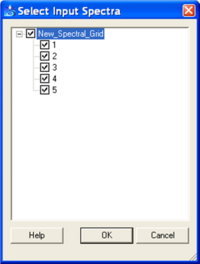
Figure 8. Selecting wave spectra.
- Model output. Once the CMS-Wave simulation is complete, the SMS interface includes tools to read in and display model results. The primary output files (*.wav, *.brk, *.rad) and the optional input water level file (*.eta) and current file (*.cur) include spatially varied data sets for the entire model domain. These data sets consist of either one (scalar) or two (vector) output parameters per cell for each input spectra. Users can load and view these files in the SMS by either using the Open command from the File menu or by dragging and dropping files into the SMS application already open. Reading the *.wav file will add three functional data sets (significant wave height, spectral peak period, and mean direction for the calculated wave field *.wav, or wave setup, maximum water level including wave runup, and mean direction for setup.wav) to the data tree, which consists of a listing of files on the left side of the SMS window.
Reading the *.rad or *.cur file will create a vector data set of radiation stress gradients or currents in SMS. Reading the *.brk file will create either breaking indices (ibrk = 1) showing where the waves break or energy dissipation fluxes (ibrk = 2) in the model domain. Figure 9 shows an example project explorer in the left section of the SMS main dialog after reading in these solution files.
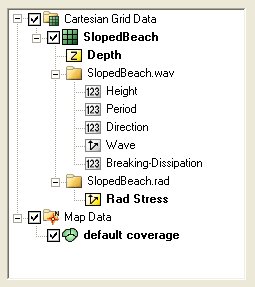
Figure 9. Project Explorer with solution read in.
The model control parameters are listed in the first line of the *.std file. There may be 6 to 15 parameters in the *.std file. The first six parameters are defined for running CMS-Wave in the same mode as the half-plane STWAVE Version 5.4. As was noted earlier, if a simulation is performed with only the first six parameters in the *.std file, this will not take advantage of CMS-Wave’s additional capabilities that are not available in STWAVE Version 5.4. The other nine parameters in the *.std file are special feature settings defined specifically for CMS-Wave. Under the CMS environment, users can use the same input files for CMS-Wave to run STWAVE Version 5.4 in the SMS by providing dummy values for the wave reflection and diffraction intensity parameters in the *.std file.
The SMS can display contours of the selected scalar or vector data sets for either input or output field data over the modeling domain. The *.obs file includes spectra computed by the model at the observation cells. These calculated spectra at the observation cells can be displayed and evaluated as the input spectra using the spectral energy dialog.
| Table of Contents | Chapter 4 - Model Validation |

