TR-08-13:Chapter5
Field Applications
Field applications are presented for three locations: (1) Matagorda Bay, TX; (2) Grays Harbor Entrance, WA; and (3) Southeast Oahu Coast, HI. CMS-Wave calculations are compared to measurements to examine model performance.
Matagorda Bay
Matagorda Bay is located on the north-central coast of Texas. The surface area of the bay is approximately 930 km2 with the depth between 2 to 4 m. The tidal prism of the bay is large because of the large bay surface area, despite having a modest tidal range of about 0.33 m in the bay. The bay is separated from the Gulf of Mexico by Matagorda Island and Matagorda Peninsula. Freshwater discharge, which originates mainly from the Colorado River and the Lavaca River, is less than 10 percent of the daily tidal exchange through the two inlets with Gulf of Mexico. Local wind is the dominant forcing for wave generation in the bay (Kraus et al. 2006).
Directional wave and water level data were collected by a bottom-mounted Acoustic Doppler Profiler (ADP) in 3.8 m of water for September to December 2005, at a middle bay location. The coordinates of this wave measurement station, MBWAV, are 28°31.285'N, 96°24.423'W. Local wind and tide data are available from NOAA sta 87737011 at Port O'Connor (28°26.8'N, 96°23.8'W) in the southwest corner of the bay. Figure 79 shows the wind, tide, and wave data-collection locations. Figures 80 and 81 show the hourly wind, tide, and wave data collected in September-December 2005. Water level data collected from MBWAV and Port O'Connor show that the spatial variation of water level in the bay can be significant under the passage of a front system and strong wind.
Waves generated by the wind are overall small to moderate in the middle of the bay during the data-collection period. Four large-wave events of interest observed in the data were produced by relatively strong wind, greater than 10 m/sec. Large waves were generated on 24 September 2005 under the strong wind of Hurricane Rita. The other three large wave events that occurred on 24 October, 1 November, and 15 November 2005, were produced by cold fronts. These large waves were generated by a wind directed between north and north-northeast. CMS-Wave simulations were performed for these events on a rectangular domain covering the entire bay (Figure 79). The numerical grid consisted of 128 223 cells with cell size of 300 m 300 m. Wave generation and propagation were computed on a spectral grid of 30 frequency bins (0.167 to 0.4 Hz with 0.008-Hz increment) and 35 direction bins (covering a half-plane with 5 deg spacing). Measured wind and tidal elevation were input to the model, and a constant bottom friction coefficient (cf) of 0.005 was specified. Figure 82 shows an example of the wave field generated for 24 October 2005. Table 15 presents measured and calculated significant wave height, spectral peak period, and mean wave direction for the four large-wave events simulated. Calculated waves agree well with the measurements. The calculated spectral peak wave period is slightly underestimated, probably because the model does not calculate the nonlinear wave energy transfer that is more pronounced in shallow water than in deep water.
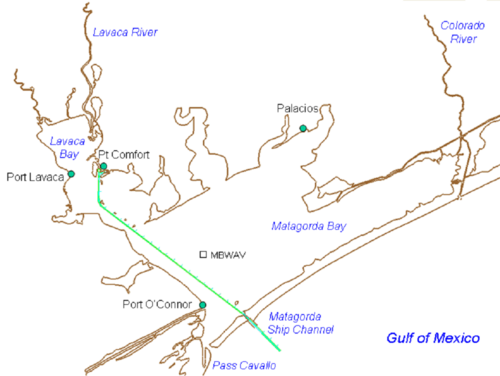
Figure 79. Wind, tides, and wave data-collection stations in Matagorda Bay.
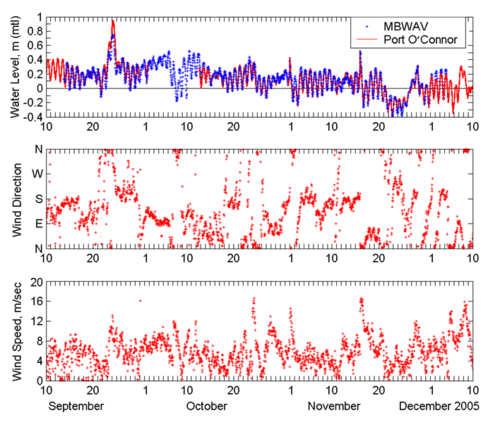
Figure 80. Matagorda Bay wind and water level data, September-December 2005.
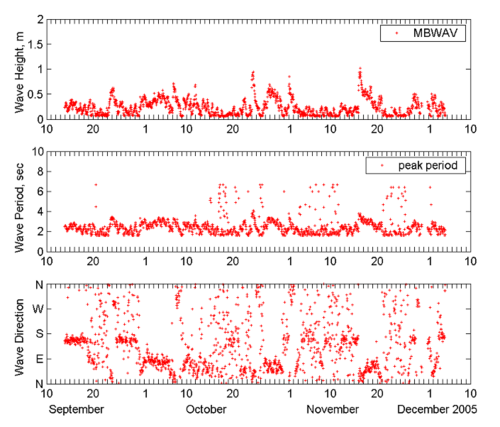
Figure 81. Directional wave data collected at MBWAV, September-December 2005.
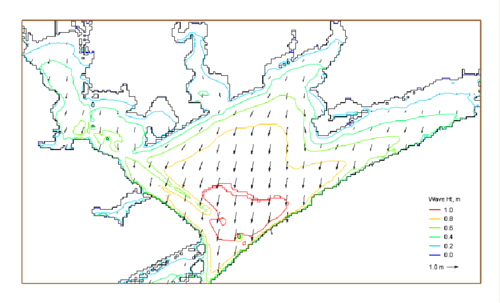
Figure 82. Calculated Matagorda Bay wave field at 08:00 GMT, 24 October 2005.
Table 15. Comparison of measured and calculated waves at MBWAV.
| Date | Time (GMT) | Wind Speed (m/sec) / Wind Direction (deg) |
Depth, mtl (m) | Measured Wave ht (m) / Period (sec) / Direction (deg) |
Calculated Wave ht (m) / Period (sec ) / Direction (deg) |
| 9/24/2005 | 03:00 | 10.5 / 5 | 3.95 | 0.62 / 3.2/ 15 | 0.67 / 2.9 / 10 |
| 10/24/2005 | 08:00 | 15.5 / 10 | 3.95 | 0.95 / 4.0/ 25 | 0.97 / 3.1 / 15 |
| 11/1/2005 | 02:00 | 14.0 / 10 | 3.85 | 0.85 / 3.4/ 20 | 0.88 / 3.1 / 15 |
| 11/16/2005 | 09:00 | 16.5 / 15 | 3.85 | 1.02 / 3.6/ 20 | 1.01 / 3.1 / 20 |
Grays Harbor Entrance
Grays Harbor, located on the coast of southwest Washington, is one of the largest estuaries in the continental United States. Spring tidal prism reaches 570 million m3, corresponding to the surface area of 200 km2 at mean tide level and a tidal range of 2.8 m. The entrance is approximately 2 km wide, and a deep-draft navigation channel is maintained at 12-13 m relative to mean lower low water. The entrance is protected by two rubble-mound jetties. The entrance to Grays Harbor experiences extreme Northwest Pacific waves during winter. Significant wave heights commonly exceed 6 m in winter storms. Strong ebb currents that exist between the jetties can increase wave height by as much as 0.5 to 1.5 m as observed in the inlet entrance.
Strong wave refraction and diffraction at the eastern end of the south jetty contribute to increased beach erosion in Half Moon Bay. To examine the influence of waves and currents in Half Moon Bay, wave and current data were collected at four stations between December 2003 and February 2004. Table 16 presents the location of four measurement stations (Osborne and Davies 2004). During the same time intervals, offshore wave information is available from a Coastal Data Information Program (CDIP) Buoy 036 (46°51.39'N, 124°14.67'W) in water of 40 m (mtl) and from National Data Buoy Center (NDBC) Buoy 46029 (46°8.63'N, 124°30.7'W), located approximately 100 km south-southeast of Grays Harbor. Ocean surface wind measurements are also available from Buoy 46029. Figure 83 shows the location map and local data-collection stations (Buoy 46029 and Half Moon Bay stations HMB1 to HMB4).
CMS-Wave simulations were conducted on a model grid of 440 600 cells, with cell size of 30 m 30 m (Figure 83). Directional wave spectra from CDIP 036 served as the input, discretized in 30 frequency bins (0.04 to 0.33 Hz with 0.01-Hz increment) and 35 direction bins (5 deg spacing of a half-plane), at the seaward boundary. Five days of wave data over 24 28 December 2003 were analyzed for comparison to the calculation (Osborne and Davies 2004). A winter storm occurred during this 5-day interval with the largest offshore measured wave height exceeding 6 m. CMS-Wave was run in steering at 3-hr interval with the CMS-Flow to account for the influence of waves with current and tides. A diffraction intensity value of 2 and a forward reflection coefficient of 0.3 were specified. A constant bottom friction coefficient (cf) of 0.005 was specified in the model. Figure 84 shows the wave measurements at NDBC 46029 and CDIP 036 for 24-29 December 2003.
CMS-Wave was run to examine three different conditions: (1) wave transformation only, (2) wave transformation including local wind input, and (3) coupling with CMS-Flow (with wind, tide, and wave-current interaction). Figures 85 and 86 show calculated maximum current fields during the peak flood and ebb cycles, respectively, in the 5-day wave simulation coupled with the CMS-Flow. Figures 87 to 90 compare calculated results to the measurements. Because the offshore wave likely has reached the fully developed sea under the mild wind condition in the simulation, the influence of wind input on the wave field is insignificant. The effect of shallower water to waves is evident in the comparison of calculated results with data at sta HMB3 and HMB4. The effect of current is more evidenced at sta HMB1 and HMB2, which are located in relatively deep water and closer to the navigation channel. Calculated wave results are overall more satisfactory from the numerical simulation coupled with the CMS-Flow.
Table 16. Coordinates of wave monitoring stations at Grays Harbor.
| Station | Coordinates | Depth, mtl (m) |
| HMB1 | 46o54'36"N, 124o07'30"W | 8.0 |
| HMB2 | 46o54'29"N, 124o06'50"W | 4.0 |
| HMB3 | 46o54'15"N, 124o07'04"W | 1.8 |
| HMB4 | 46o54'15"N, 124o07'18"W | 2.2 |
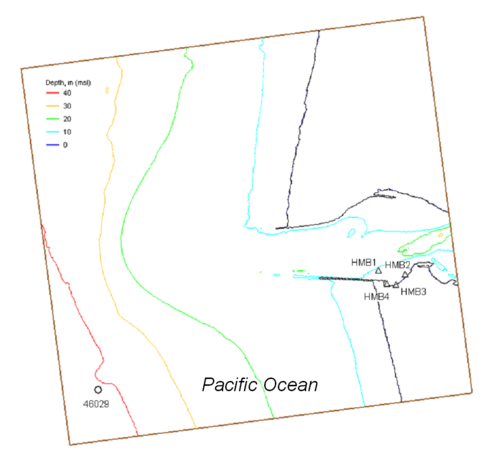
Figure 83. Wave data-collection stations at Grays Harbor.
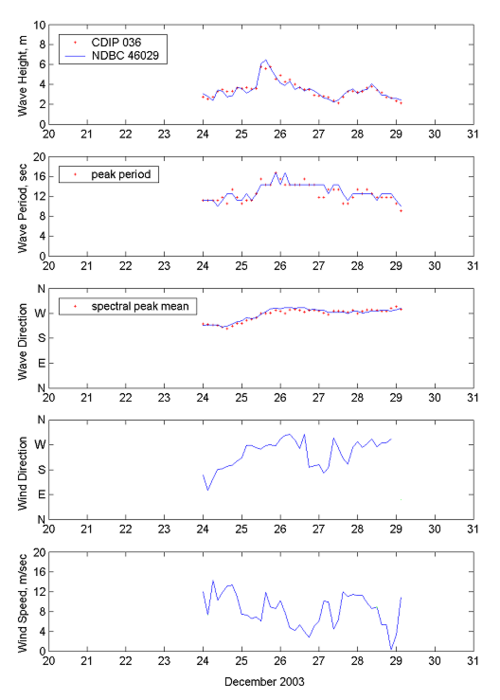
Figure 84. Wind and wave data from NDBC 46029 and CDIP 036, 20-31 December 2003.
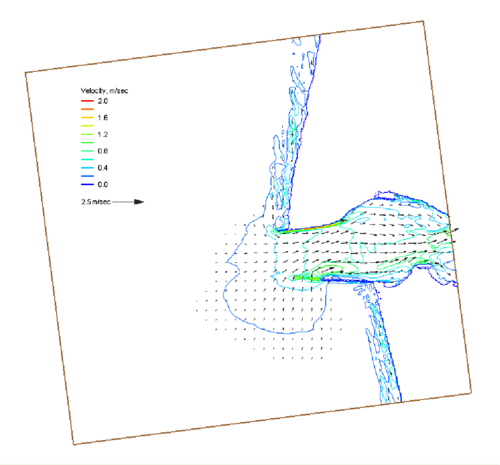
Figure 85. Calculated maximum flood current field, 19:00 GMT, 25 December 2003.
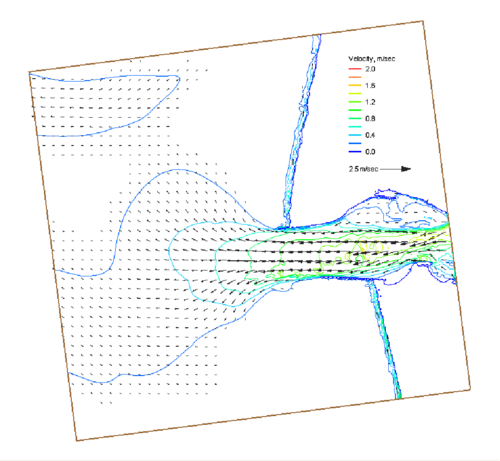
Figure 86. Calculated maximum ebb current field, December 2003.
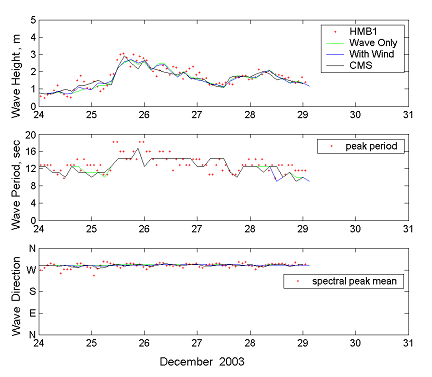
Figure 87. Measured and calculated waves at HMB01, 24-28 December 2003.
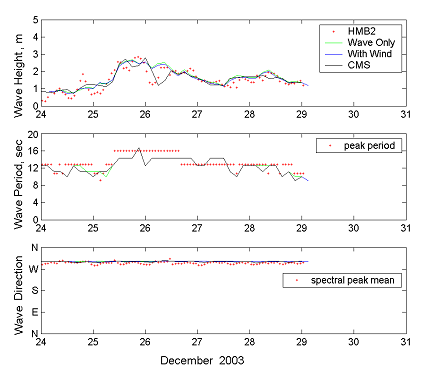
Figure 88. Measured and calculated waves at HMB02, 24-28 December 2003.
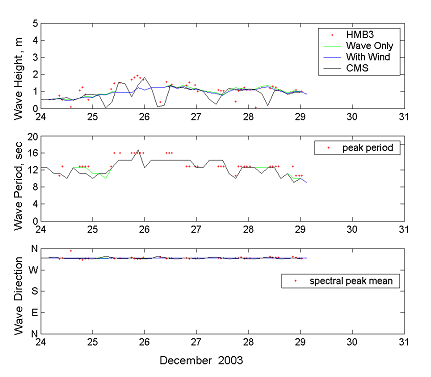
Figure 89. Measured and calculated waves at HMB03, 24-28 December 2003.
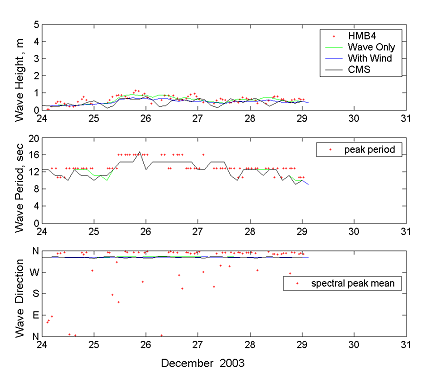
Figure 90. Measured and calculated waves at HMB04, 24-28 December 2003.
Southeast Oahu coast
Directional wave data were collected at the southeast coast of Oahu, HI, for the Southeast Oahu Regional Sediment Management (SEO/RSM) demonstration project conducted by the U.S. Army Engineer District, Honolulu. The data collection included three ADVs (Acoustic Dopper Velocimeters) installed from 9 August to 14 September 2005, in the nearshore. Table 17 lists the location of the ADVs. At the same time, offshore wave data were available from a CDIP Buoy 098 (21°24.9'N, 157°40.7'W), deployed near the study site. This data-collection period is dominated by trade wind weather, typically occurring from April through September in Hawaii, as characterized by wind consistently out of the northeast. The ocean surface wind was measured at NDBC Buoy 51001 (23°25.92'N, 162°12.47'W), approximately 250 km northwest of Oahu Island. Water level data were available from nearby NOAA sta 1612340 (21°18.4'N, 157°52'W) at Honolulu Harbor and sta 1612480 (21°26.2'N, 157°47.6'W) at Kaneohe Bay. Figure 91 shows the ADV, CDIP buoy, and NOAA tidal station locations.
Table 17. Coordinates of ADV stations at southeast Oahu.
| Station | Coordinates | Depth, mtl (m) |
| ADV1 | 21o23'52"N, 157o43'05"W | 2.5 |
| ADV2 | 21o22'31"N, 157o42'14"W | 2.7 |
| ADV3 | 21o19'48"N, 157o40'56"W | 2.5 |
For the wave simulation, a nearshore bathymetry grid was developed covering a 24.2-km coastline including Mokapu Point, Makapu'u Point, Kailua Bay, and Waimanalo Bay. The seaward boundary extends to the 300 m contour, with a maximum 510-m depth (Figure 92). The grid consisted of 310 968 cells with cell size of 25 m 25 m. The incident wave at the offshore boundary was supplied by CDIP Buoy 098. Both wind and water level data were input to the simulation. Thirty frequency bins (0.04 to 0.33 Hz with 0.01-Hz increment) and 35 direction bins (covering a half-plane with 5-deg spacing) were specified for the wave calculation.
The southeast Oahu coast is fronted with an extensive reef bottom that causes waves approaching shore to dissipate more energy than if traveling over a sandy bed. For the wave simulation, it was necessary to specify different bottom friction coefficients in the reef and non-reef areas. For applications, the bottom friction coefficients cf of 0.001 and 0.01 are recommended for sandy beach and reef bottom, respectively. Specific bottom friction coefficient values are necessarily determined from field validation if the bottom is irregular. Figure 92 also shows different bottom friction coefficients specified in the computational domain. The simulation was run with both forward and backward reflection. A constant reflection coefficient value of 1 and default diffraction intensity value of 1 were selected. Surface wind input and water level data were input in addition to the offshore spectral wave forcing.
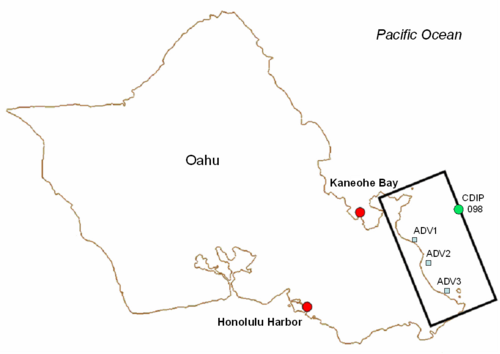
Figure 91. Tide and wave data-collection stations and model domain for SEO/RSM studies.
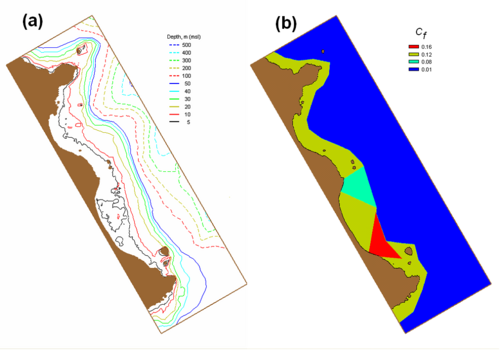
Figure 92. (a) Bathymetry grid, and (b) different bottom friction coefficient regions.
Figures 93 and 94 show calculated wave results with data at three nearshore ADV locations. The calculated waves agree well with the measurements. There is apparent noise in wave period and direction measurements from ADV2 and ADV3, where the local bathymetry and reef bottom may influence the approaching waves.
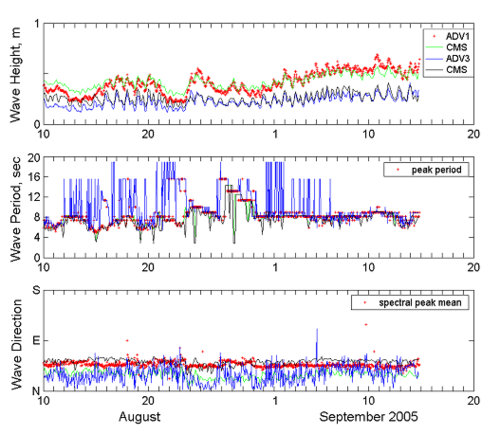
Figure 93. Measured and calculated waves at ADV1 and ADV3, August-September 2005.
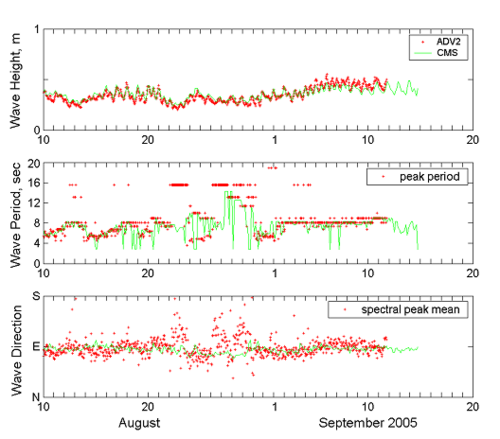
Figure 94. Measured and calculated waves at ADV2, August-September 2005.
| Table of Contents | References and Appendix |