Circ Basin: Difference between revisions
No edit summary |
No edit summary |
||
| Line 1: | Line 1: | ||
'''Test C1-Ex2: Wind-driven Flow in a Circular Basin''' | |||
''Purpose'' | |||
The purpose of this test is to verify the steady state linear | |||
hydrodynamics when forced by spatially variable winds, a linear bottom | |||
friction, and with and without Coriolis force. Specific model features | |||
evaluated in this problem are spatially variable winds and Coriolis | |||
force. | |||
''Problem'' | |||
Assuming steady state conditions and no advection, diffusion, waves or | |||
spatial gradients in atmospheric pressure, the governing equations | |||
reduce to | |||
{{Equation|1=<math>\frac{\partial \left(hU_j\right)}{\partial x_j} = 0 </math> | 2=1}} | |||
{{Equation|1=<math>\epsilon_{ij}f_chU_j = -gh \frac{\partial \eta}{\partial x_i} + \frac{1}{\rho}\left(\tau^s_i-\tau^b_i\right)</math> | 2=2}} | |||
where <math>\epsilon_{ij}</math> is the permutation operator equal to | |||
1 for <math>i,j=1,2</math>; -1 for <math>i,j=2,1</math>; and 0 for | |||
<math>i=j</math>, <math>f_c</math> is the Coriolis parameter, | |||
<math>U_j</math> is the depth-averaged current velocity in the | |||
<math>j</math>th direction, <math>\tau^s_i</math> is the wind driving | |||
force per unit water surface area, and <math>\tau^b_i</math> is the | |||
bottom friction. The problem is further simplified by assuming a flat | |||
bed and deep water conditions <math>h>>\eta</math> , so that | |||
<math>h</math> may be considered constant. A linear bottom friction is | |||
specified as <math>\tau^b_i=\epsilon_{i2}x_jW/R </math> where | |||
<math>f_c</math> is a linear bottom friction coefficient. The wind | |||
stress is given by where <math>W</math> is the gradient or slope of | |||
the wind speed and <math>R</math> is the radius of the circular basin. | |||
''Analytical Solution'' | |||
Dupont (2001) presented the analytical solution to the problem | |||
above. The water surface elevation is given by | |||
{{Equation|1= | |||
<math>\eta = | |||
\begin{array}{cc} | |||
\frac{W x_1 x_2}{2ghR} & f_c=0 \\ | |||
\frac{W f_c}{Rgh\kappa} \left[ | |||
\frac{R^2}{8} | |||
+ \frac{1}{4}\left(\frac{2\kappa x_1 x_2}{f_c}-x_1^2-x_2^2\right) | |||
\right] & f_c \neq 0 | |||
\end{array} | |||
</math> | 2=3}} | |||
The current velocities are independent of the Coriolis coefficient and | |||
are given by | |||
{{Equation|1= | {{Equation|1= | ||
<math> | <math> | ||
U_i = \frac{\epsilon_{ij}x_jW}{2Rh\kappa} | U_i = \frac{\epsilon_{ij}x_jW}{2Rh\kappa} | ||
</math> | 2=4}} | </math> | 2=4}} | ||
''Model Setup'' | |||
The computational grid, shown in Figure 4, has 5 levels of refinement | |||
from 2km to 125m and a total of 15,272 computational cells. | |||
[[File:wind_circular_basin.png ||leftthumb|400px|alt=framework]] | |||
Figure 4. CMS-Flow computational grid used for the wind-driven flow in | |||
a circular basin. | |||
The CMS model is run to steady state from zero current and water level | |||
as initial conditions. The relevant model parameters are summarized in | |||
Table 4. Two cases are run: one with Coriolis and one without. | |||
{| class="wikitable" border="1" | |||
|+ Table 4. CMS-Flow setup for the circular basin test case. | |||
! Parameter !! Value | |||
|- | |||
| Time step || 1 hr | |||
|- | |||
| Simulation duration || 72 hr | |||
|- | |||
| Ramp period duration || 24 hr | |||
|- | |||
| Water depth || 100 m | |||
|- | |||
| Mixing terms || Off | |||
|- | |||
| Wall friction || Off | |||
|- | |||
| Linear bottom friction || On | |||
|- | |||
|coefficient || 0.001 | |||
|- | |||
|Coriolis || 0.0, 0.0001 rad/s | |||
|- | |||
|Wind gradient || 0.0001<math>m^2/s^2</math> | |||
|} | |||
''Results and Discussion'' | |||
''Without Coriolis Force'' | |||
A comparison of the calculated and analytical current velocities and | |||
water levels in the case without Coriolis force are shown in | |||
Figure 5. The goodness-of-fit statistics for the velocity components | |||
and water level are shown in Table 5. The calculated water level shows | |||
excellent agreement with the analytical solution, even along the outer | |||
boundary, and is demonstrated by the NMAE of 0.02%. The current | |||
velocities agree well with the analytical solution. The largest errors | |||
for the current velocities occur near the outer boundary due to the | |||
staircase representation of the curved boundary. The error is reduced | |||
by increasing the refinement at the boundary. | |||
[[File:analytical_without_coriolis.png||leftthumb|400px|alt=framework]] | |||
[[File:calculated_without_coriolis.png||leftthumb|400px|alt=framework]] | |||
Figure 5. Analytical (a) and calculated (b) current velocities | |||
and water levels without Coriolis force. | |||
{| class="wikitable" border="1" | |||
|+ Table 5. Water level and current velocity goodness-of-fit statistics* | |||
for the circular basin test case without Coriolis force | |||
! Variable !! NRMSE, % !! NMAE, % !! <math>R^2</math> !! Bias | |||
|- | |||
|U-velocity || 1.88 || 0.30 || 0.999 || -4.5e-7 m/s | |||
|- | |||
|V-velocity || 2.51 || 0.37 || 0.998 || 9.7e-9 m/s | |||
|- | |||
|Water level || 0.03 || 0.02 || 0.999 || 3.14e-8 m | |||
|- | |||
*defined in Appendix A | |||
|} | |||
''With Coriolis Force'' | |||
A comparison of the calculated and analytical solutions of current | |||
velocities and water levels for the case with Coriolis force is shown | |||
in Figure 6. The goodness-of-fit statistics for the velocity | |||
components and water level are shown in Table 6. Similar to the case | |||
without Coriolis force, agreement between the calculated water | |||
elevation and current velocity and the analytical solutions resulted | |||
in a NRMSE of 0.03% for water level and 2.53% for current | |||
velocities. The largest errors in current velocity occur adjacent to | |||
the outer boundary where the curved boundary exists. A positive | |||
Coriolis parameter corresponds to the northern hemisphere where ocean | |||
currents are deflected to the right. For this case, the Coriolis force | |||
has the net effect of pushing water towards the center of the circular | |||
basin creating higher water levels and lower water levels around the | |||
perimeter. | |||
From Equation (4), it can be seen that the water level, <math>\eta</math>, at | |||
the basin center <math>x_1=x_2=0m</math>, is equal to | |||
<math>Wf_cR/\left(8gh\kappa\right) </math> | |||
for <math>f_c \neq 0/s</math> and equal to 0m for 0/s. | |||
[[File:analytical_with_coriolis.png || leftthumb|400px|alt=framework]] | |||
[[File:calculated_with_coriolis.png || leftthumb|400px|alt=framework]] | |||
Figure 6. Analytical (a) and calculated (b) current velocities | |||
and water levels with Coriolis force. | |||
{| class="wikitable" border="1" | |||
|+ Table 6. Water level and current velocity goodness-of-fit statistics* | |||
for the circular basin test case with Coriolis | |||
!Variable !! NRMSE, % !! NMAE, % !! R2 !! Bias | |||
|- | |||
|U-Velocity || 1.90 || 0.30 || 0.999||-4.5e-7 m/s | |||
|- | |||
|V-Velocity || 2.51 || 0.37 || 0.998||4.6e-9 m/s | |||
|- | |||
|Water level || 0.03 || 0.02 || 0.999||9.5e-8 m | |||
|- | |||
*defined in Appendix A | |||
|} | |||
''Conclusions and Recommendations '' | |||
The analytical solution for the steady-state wind-induced linear | |||
hydrodynamics in a closed circular basin was simulated. Computed water | |||
levels were accurate within 0.03% NRMSE, and showed little influence | |||
from the staircase representation of the curved outer | |||
boundary. Current velocities were less accurate with a NRMSE of 2.53% | |||
due to errors near the outer boundary. For most coastal applications | |||
open boundaries are represented by straight boundaries so the | |||
staircase boundary does not exist. Curved boundaries usually occur | |||
along the wet-dry interface in very shallow water where the current | |||
velocities are usually small due to the increased bottom | |||
friction. However, if the curved boundary occurs in deep water or in | |||
areas where the current velocities are strong, then errors will be | |||
incurred due to the staircase representation of the | |||
boundary. Nevertheless, the errors may be reduced by increasing the | |||
grid refinement along the specific boundary. In the future, this | |||
problem can be eliminated by implementing a boundary fitting method, | |||
such as a cut-cell or embedded boundary, or quadrilateral mesh. | |||
Latest revision as of 21:58, 15 April 2014
Test C1-Ex2: Wind-driven Flow in a Circular Basin
Purpose
The purpose of this test is to verify the steady state linear hydrodynamics when forced by spatially variable winds, a linear bottom friction, and with and without Coriolis force. Specific model features evaluated in this problem are spatially variable winds and Coriolis force.
Problem
Assuming steady state conditions and no advection, diffusion, waves or spatial gradients in atmospheric pressure, the governing equations reduce to
| (1) |
| (2) |
where is the permutation operator equal to
1 for ; -1 for ; and 0 for
, is the Coriolis parameter,
is the depth-averaged current velocity in the
th direction, is the wind driving
force per unit water surface area, and is the
bottom friction. The problem is further simplified by assuming a flat
bed and deep water conditions , so that
may be considered constant. A linear bottom friction is
specified as where
is a linear bottom friction coefficient. The wind
stress is given by where is the gradient or slope of
the wind speed and is the radius of the circular basin.
Analytical Solution
Dupont (2001) presented the analytical solution to the problem above. The water surface elevation is given by
| (3) |
The current velocities are independent of the Coriolis coefficient and are given by
| (4) |
Model Setup
The computational grid, shown in Figure 4, has 5 levels of refinement
from 2km to 125m and a total of 15,272 computational cells.
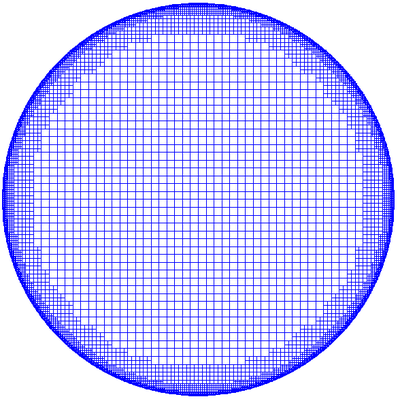 Figure 4. CMS-Flow computational grid used for the wind-driven flow in
a circular basin.
The CMS model is run to steady state from zero current and water level as initial conditions. The relevant model parameters are summarized in Table 4. Two cases are run: one with Coriolis and one without.
| Parameter | Value |
|---|---|
| Time step | 1 hr |
| Simulation duration | 72 hr |
| Ramp period duration | 24 hr |
| Water depth | 100 m |
| Mixing terms | Off |
| Wall friction | Off |
| Linear bottom friction | On |
| coefficient | 0.001 |
| Coriolis | 0.0, 0.0001 rad/s |
| Wind gradient | 0.0001 |
Results and Discussion
Without Coriolis Force
A comparison of the calculated and analytical current velocities and water levels in the case without Coriolis force are shown in Figure 5. The goodness-of-fit statistics for the velocity components and water level are shown in Table 5. The calculated water level shows excellent agreement with the analytical solution, even along the outer boundary, and is demonstrated by the NMAE of 0.02%. The current velocities agree well with the analytical solution. The largest errors for the current velocities occur near the outer boundary due to the staircase representation of the curved boundary. The error is reduced by increasing the refinement at the boundary.
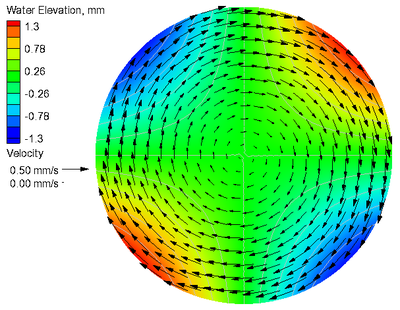
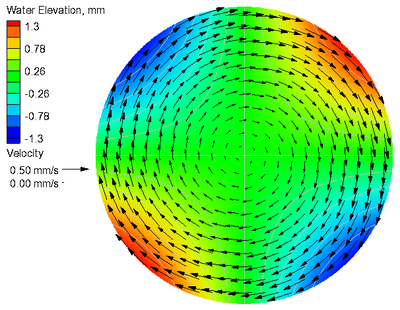 Figure 5. Analytical (a) and calculated (b) current velocities
and water levels without Coriolis force.
- defined in Appendix A
| Variable | NRMSE, % | NMAE, % | Bias | |
|---|---|---|---|---|
| U-velocity | 1.88 | 0.30 | 0.999 | -4.5e-7 m/s |
| V-velocity | 2.51 | 0.37 | 0.998 | 9.7e-9 m/s |
| Water level | 0.03 | 0.02 | 0.999 | 3.14e-8 m |
With Coriolis Force
A comparison of the calculated and analytical solutions of current velocities and water levels for the case with Coriolis force is shown in Figure 6. The goodness-of-fit statistics for the velocity components and water level are shown in Table 6. Similar to the case without Coriolis force, agreement between the calculated water elevation and current velocity and the analytical solutions resulted in a NRMSE of 0.03% for water level and 2.53% for current velocities. The largest errors in current velocity occur adjacent to the outer boundary where the curved boundary exists. A positive Coriolis parameter corresponds to the northern hemisphere where ocean currents are deflected to the right. For this case, the Coriolis force has the net effect of pushing water towards the center of the circular basin creating higher water levels and lower water levels around the perimeter.
From Equation (4), it can be seen that the water level, , at the basin center , is equal to for and equal to 0m for 0/s.
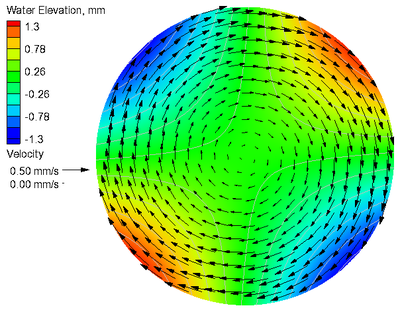
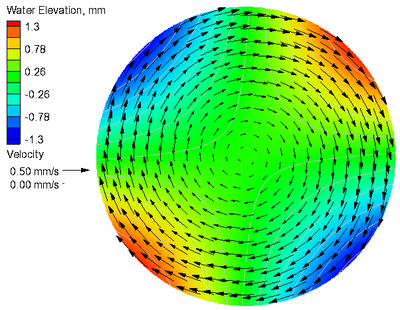 Figure 6. Analytical (a) and calculated (b) current velocities
and water levels with Coriolis force.
- defined in Appendix A
| Variable | NRMSE, % | NMAE, % | R2 | Bias |
|---|---|---|---|---|
| U-Velocity | 1.90 | 0.30 | 0.999 | -4.5e-7 m/s |
| V-Velocity | 2.51 | 0.37 | 0.998 | 4.6e-9 m/s |
| Water level | 0.03 | 0.02 | 0.999 | 9.5e-8 m |
Conclusions and Recommendations
The analytical solution for the steady-state wind-induced linear hydrodynamics in a closed circular basin was simulated. Computed water levels were accurate within 0.03% NRMSE, and showed little influence from the staircase representation of the curved outer boundary. Current velocities were less accurate with a NRMSE of 2.53% due to errors near the outer boundary. For most coastal applications open boundaries are represented by straight boundaries so the staircase boundary does not exist. Curved boundaries usually occur along the wet-dry interface in very shallow water where the current velocities are usually small due to the increased bottom friction. However, if the curved boundary occurs in deep water or in areas where the current velocities are strong, then errors will be incurred due to the staircase representation of the boundary. Nevertheless, the errors may be reduced by increasing the grid refinement along the specific boundary. In the future, this problem can be eliminated by implementing a boundary fitting method, such as a cut-cell or embedded boundary, or quadrilateral mesh.


![{\displaystyle \eta ={\begin{array}{cc}{\frac {Wx_{1}x_{2}}{2ghR}}&f_{c}=0\\{\frac {Wf_{c}}{Rgh\kappa }}\left[{\frac {R^{2}}{8}}+{\frac {1}{4}}\left({\frac {2\kappa x_{1}x_{2}}{f_{c}}}-x_{1}^{2}-x_{2}^{2}\right)\right]&f_{c}\neq 0\end{array}}}](https://en.wikipedia.org/api/rest_v1/media/math/render/svg/bbadc19a18fffefd3416f729a7edbdf389bb74c1)


