Field Experiment Wave Validation Case 3: Difference between revisions
(Created page with "===Southeast Oahu coast=== Directional wave data were collected at the southeast coast of Oahu, HI, for the Southeast Oahu Regional Sediment Management (SEO/RSM) demonstration pr...") |
|||
| Line 30: | Line 30: | ||
The southeast Oahu coast is fronted with an extensive reef bottom that causes waves approaching shore to dissipate more energy than if traveling over a sandy bed. For the wave simulation, it was necessary to specify different bottom friction coefficients in the reef and non-reef areas. For applications, the bottom friction coefficients ''c''<sub>''f''</sub> of 0.001 and 0.01 are recommended for sandy beach and reef bottom, respectively. Specific bottom friction coefficient values are necessarily determined from field validation if the bottom is irregular. Figure 92 also shows different bottom friction coefficients specified in the computational domain. The simulation was run with both forward and backward reflection. A constant reflection coefficient value of 1 and default diffraction intensity value of 1 were selected. Surface wind input and water level data were input in addition to the offshore spectral wave forcing. | The southeast Oahu coast is fronted with an extensive reef bottom that causes waves approaching shore to dissipate more energy than if traveling over a sandy bed. For the wave simulation, it was necessary to specify different bottom friction coefficients in the reef and non-reef areas. For applications, the bottom friction coefficients ''c''<sub>''f''</sub> of 0.001 and 0.01 are recommended for sandy beach and reef bottom, respectively. Specific bottom friction coefficient values are necessarily determined from field validation if the bottom is irregular. Figure 92 also shows different bottom friction coefficients specified in the computational domain. The simulation was run with both forward and backward reflection. A constant reflection coefficient value of 1 and default diffraction intensity value of 1 were selected. Surface wind input and water level data were input in addition to the offshore spectral wave forcing. | ||
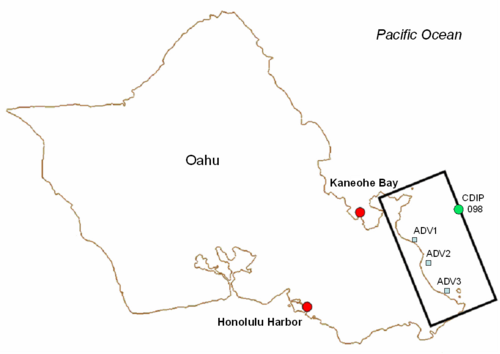
[[Image:TR-08-13_Chapter5_13_1024.png|500px| | [[Image:TR-08-13_Chapter5_13_1024.png|thumb|left|500px|Figure 91. Tide and wave data-collection stations and model domain for SEO/RSM studies.]] | ||
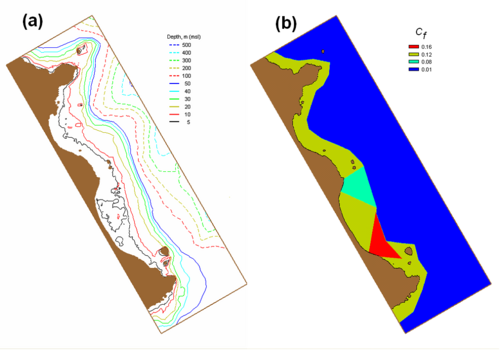
[[Image:TR-08-13_Chapter5_14_1024.png|500px| | [[Image:TR-08-13_Chapter5_14_1024.png|thumb|left|500px|Figure 92. (a) Bathymetry grid, and (b) different bottom friction coefficient regions.]] | ||
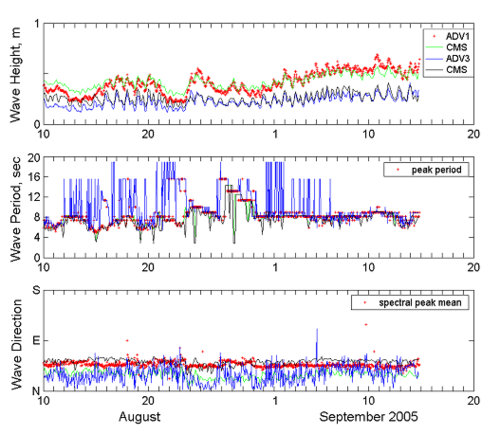
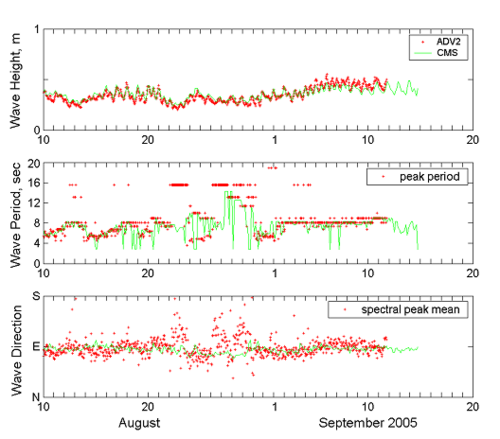
Figures 93 and 94 show calculated wave results with data at three nearshore ADV locations. The calculated waves agree well with the measurements. There is apparent noise in wave period and direction measurements from ADV2 and ADV3, where the local bathymetry and reef bottom may influence the approaching waves. | Figures 93 and 94 show calculated wave results with data at three nearshore ADV locations. The calculated waves agree well with the measurements. There is apparent noise in wave period and direction measurements from ADV2 and ADV3, where the local bathymetry and reef bottom may influence the approaching waves. | ||
[[Image:TR-08-13_Chapter5_15.png|500px| | [[Image:TR-08-13_Chapter5_15.png|thumb|left|500px|Figure 93. Measured and calculated waves at ADV1 and ADV3, August-September 2005.]] | ||
[[Image:TR-08-13_Chapter5_16.png|thumb|left|500px|Figure 94. Measured and calculated waves at ADV2, August-September 2005.]] | |||
Revision as of 16:29, 23 November 2010
Southeast Oahu coast
Directional wave data were collected at the southeast coast of Oahu, HI, for the Southeast Oahu Regional Sediment Management (SEO/RSM) demonstration project conducted by the U.S. Army Engineer District, Honolulu. The data collection included three ADVs (Acoustic Dopper Velocimeters) installed from 9 August to 14 September 2005, in the nearshore. Table 17 lists the location of the ADVs. At the same time, offshore wave data were available from a CDIP Buoy 098 (21°24.9'N, 157°40.7'W), deployed near the study site. This data-collection period is dominated by trade wind weather, typically occurring from April through September in Hawaii, as characterized by wind consistently out of the northeast. The ocean surface wind was measured at NDBC Buoy 51001 (23°25.92'N, 162°12.47'W), approximately 250 km northwest of Oahu Island. Water level data were available from nearby NOAA sta 1612340 (21°18.4'N, 157°52'W) at Honolulu Harbor and sta 1612480 (21°26.2'N, 157°47.6'W) at Kaneohe Bay. Figure 91 shows the ADV, CDIP buoy, and NOAA tidal station locations.
Table 17. Coordinates of ADV stations at southeast Oahu.
| Station | Coordinates | Depth, mtl (m) |
| ADV1 | 21o23'52"N, 157o43'05"W | 2.5 |
| ADV2 | 21o22'31"N, 157o42'14"W | 2.7 |
| ADV3 | 21o19'48"N, 157o40'56"W | 2.5 |
For the wave simulation, a nearshore bathymetry grid was developed covering a 24.2-km coastline including Mokapu Point, Makapu'u Point, Kailua Bay, and Waimanalo Bay. The seaward boundary extends to the 300 m contour, with a maximum 510-m depth (Figure 92). The grid consisted of 310 968 cells with cell size of 25 m 25 m. The incident wave at the offshore boundary was supplied by CDIP Buoy 098. Both wind and water level data were input to the simulation. Thirty frequency bins (0.04 to 0.33 Hz with 0.01-Hz increment) and 35 direction bins (covering a half-plane with 5-deg spacing) were specified for the wave calculation.
The southeast Oahu coast is fronted with an extensive reef bottom that causes waves approaching shore to dissipate more energy than if traveling over a sandy bed. For the wave simulation, it was necessary to specify different bottom friction coefficients in the reef and non-reef areas. For applications, the bottom friction coefficients cf of 0.001 and 0.01 are recommended for sandy beach and reef bottom, respectively. Specific bottom friction coefficient values are necessarily determined from field validation if the bottom is irregular. Figure 92 also shows different bottom friction coefficients specified in the computational domain. The simulation was run with both forward and backward reflection. A constant reflection coefficient value of 1 and default diffraction intensity value of 1 were selected. Surface wind input and water level data were input in addition to the offshore spectral wave forcing.
Figures 93 and 94 show calculated wave results with data at three nearshore ADV locations. The calculated waves agree well with the measurements. There is apparent noise in wave period and direction measurements from ADV2 and ADV3, where the local bathymetry and reef bottom may influence the approaching waves.
| Table of Contents | References and Appendix |


